Wi-Fi Site Surveys, Analysis, Troubleshooting runs on a MacBook (macOS 11+) or any laptop (Windows 7/8/10/11) with a standard 802.11be/ax/ac/n/g/a/b wireless network adapter. Read more about the 802.11be support here.
Why’s My WiFi Not Working: 2026 Troubleshooting Guide
Need help with WiFi troubleshooting? Discover how to diagnose and fix weak signals, slow internet, and noisy networks using NetSpot.
Wi-Fi always seems to give out when you need it most — right before a meeting, in the middle of a large download, or just as you’re settling in to watch something online. The good news? A lot of these problems are easier to fix than they seem. With a little time and the right approach, you can often sort things out on your own.
This guide breaks down the most common Wi-Fi issues and the steps you can take to sort them out. We’ll also look at how specialized apps, including tools like NetSpot, can help you get a clearer picture of what’s going on with your network.
Before You Start: A Quick WiFi Troubleshooting Checklist
Before jumping into complex troubleshooting, it’s smart to rule out a few common issues. Many WiFi problems come down to something surprisingly simple.
- Is your WiFi router definitely plugged in and powered on?
- Are you sure you're connected to the correct WiFi network (SSID)?
- Have you checked whether your router’s firmware needs an update?
- Is the issue happening on one device or across all your devices?
Running through these quick checks first can save a lot of time and frustration. If everything looks fine here but you’re still seeing slow speeds or frequent disconnects, it might be time to look deeper into your network setup.
Common WiFi Problems and How to Fix Them
Before we get into any deep troubleshooting, start with the one thing that surprisingly fixes a huge number of WiFi issues. There’s a reason it’s the first thing most tech support reps ask you to try when you call in with a “my WiFi is broken” complaint.
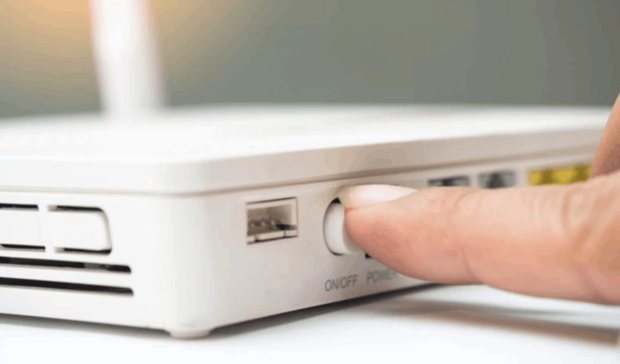
If your connection’s acting up for no clear reason, this 3-step reset might do the trick:
Unplug your WiFi router from the power outlet.
Wait about 30 seconds.
Plug it back in and give it a minute or two to fully reboot.
Routers, like other electronics, have capacitors — small components that hold a bit of power even after you unplug the device. Waiting those 30 seconds lets everything truly power down. That hard reset clears out temporary glitches in the router’s memory or CPU and lets it start fresh. In practice, this “turn it off and on again” routine really does solve a surprising number of random WiFi problems.
It’s a small step, but if your WiFi is not working at all, this method is often enough to bring everything back online.
Still not fixed? No problem — let’s take a closer look at some of the most common WiFi issues and what you can do to handle them.
WiFi Doesn’t Work in One Room
Problem:
Wi-Fi connectivity issues in certain rooms often stem from physical obstructions, distance from the router, and interference from other electronic devices. Thick walls, floors, and large furniture can block or weaken Wi-Fi signals, especially if the materials are dense like concrete or metal.
The further a room is from the router, the weaker the signal, leading to poor connectivity. The layout of the house and the positioning of the router also play significant roles.
Solution:
Start with the most obvious: try placing your router as centrally as possible, up high, rather than hiding it in a corner, closet, or on the floor. Since concrete walls and metal surfaces can interfere with signal strength, keep it away from these areas and other electronic devices that could create additional interference. Simply repositioning your router can significantly improve coverage in many cases.
If this still isn't enough, you're likely reaching the limits of your current coverage. In this case, adding a mesh WiFi system or an additional access point will help distribute the signal more evenly from room to room. Mesh configurations work especially well in large apartments, multi-story buildings, or spaces with complex layouts and many walls.
Expert Tip:
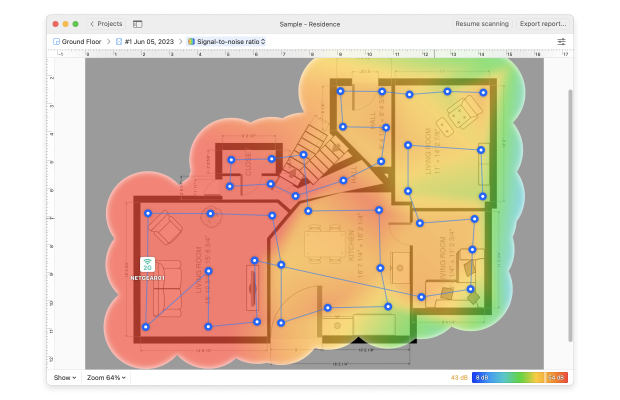
Before spending money on new gear, try using a WiFi analyzer app like NetSpot or VisiWave. A quick scan with one of these tools can generate a WiFi heatmap — a visual map that shows where your signal is strong, weak, or completely dead. That way, you’re not just guessing: you see exactly where the problem areas are and can make smarter decisions about whether to move the router, add an access point, or invest in a mesh system.
Slow Internet Over WiFi
Problem:
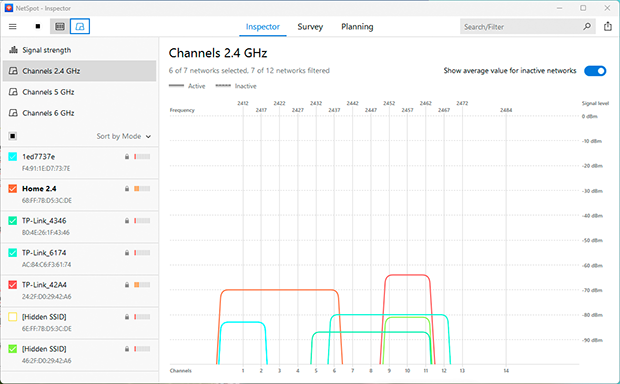
If you notice your internet acting up — download speeds stay low and make you nervous, the video you’re watching keeps buffering, and your calls start freezing (especially during peak hours) — there’s a good chance the real issue is WiFi channel congestion.
In crowded buildings, dozens of routers are fighting for the same frequencies. The 2.4 GHz band gets hit the hardest because it only has a few non-overlapping channels, so interference piles up very quickly.
WiFi Keeps Disconnecting Randomly
Problem:
Few things are more frustrating than when your WiFi keeps disconnecting for no reason. This may be caused by a variety of underlying factors — most commonly an overheating router, outdated firmware, or even unstable power supply to the device.
Solution:
Start by checking the physical condition and placement of your router. If it's tucked away in a tight, dusty cabinet or surrounded by other electronics, it may be overheating. Move it to a well-ventilated spot with some space around it. If the vents are dusty or blocked, gently clean them.
Next, check your router’s settings. An outdated firmware can cause random disconnects or slowdowns, especially if there have been security patches or performance updates released by the manufacturer. Log in to your router’s admin panel and check for any available firmware updates.
Also, consider the age of your equipment. If your router is more than 4–5 years old, it may simply be struggling to keep up with modern devices and network demands. Upgrading to a newer model with support for Wi-Fi 6 or Wi-Fi 6E can help eliminate these random dropouts.
Expert Tip:
Make it a habit to review your router’s firmware status once a month. Many newer routers support automatic reboots on a schedule — doing this once a week can improve stability and reduce background glitches.
Can’t Access Certain Websites
Problem:
You’re online — WiFi’s connected, apps work, maybe even streaming is fine. But some websites just won’t load, giving you “DNS not found” errors or endless loading wheels. This often happens when your DNS cache gets corrupted, either on your device or your router, making it hard for your system to translate domain names into actual IP addresses.
Solution:
The first step is to flush the DNS cache, which forces your device to request fresh address info from the network:
- On Windows, open Command Prompt and run:
ipconfig /flushdns - On macOS, open Terminal and type:
sudo dscacheutil -flushcache; sudo killall -HUP mDNSResponder
After that, do the classic move — restart your router. Turn it off, pause for half a minute, and power it back on. It sounds simple, but it’s one of the most effective ways to fix stubborn WiFi issues like this.
Expert Tip:
Try this: open your terminal or command prompt and type
ping 8.8.8.8
If you get a response, it means your internet connection is alive — the issue is most likely DNS-related, not a full outage.
Download/Upload Speeds Are Too Low
Problem:
If your WiFi appears to be fine at first glance — the indicators are full, the connection is stable — but data takes a very long time to download and uploads are practically nonexistent, then the problem is usually not a lack of signal, but rather network congestion, poor router placement, or interference from other equipment.
Solution:
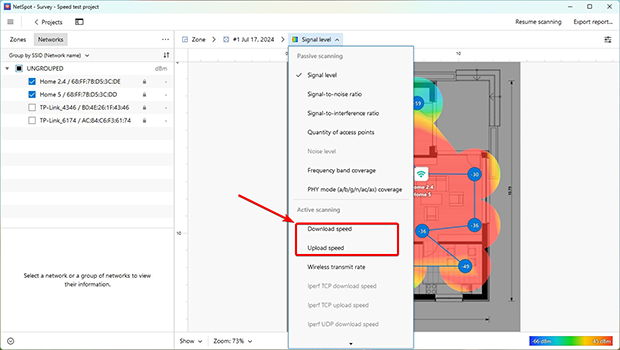
Measure what’s really going on. Start by running an Active Scan using a Wi-Fi analyzer like NetSpot. One of the most useful features here is the ability to generate download and upload speed WiFi heatmaps. These maps show where throughput actually falls off, even in spots that show “good” signal on your phone or laptop.
Wireless Network Troubleshooter Tips with NetSpot’s Heatmaps
NetSpot goes beyond simple WiFi scanning — it's a full-fledged diagnostic toolkit available for Windows, macOS, Android, and iOS. Whether you’re dealing with weak signal, interference, or inconsistent speeds, the app helps you visualize what’s really going on across your network.
With features like real-time signal analysis, download/upload speed testing, and most importantly, the ability to build detailed heatmaps, NetSpot gives you a clear view of problem areas — no guesswork needed.
If you’re on a PRO or Enterprise edition, NetSpot opens up a set of troubleshooting heatmaps that help you track down WiFi problems. They highlight exactly where your network falls short and what’s causing it. In the next sections, we’ll look at the main heatmap types and how to read them so you can fine-tune your wireless coverage.
Tip 1. Issues with SNR
The Signal-to-Noise Ratio (SNR) heatmap, which is available in the macOS version of the software only, will show you where your signal strength is not strong enough to overcome the existing environmental noise from other electronic devices.
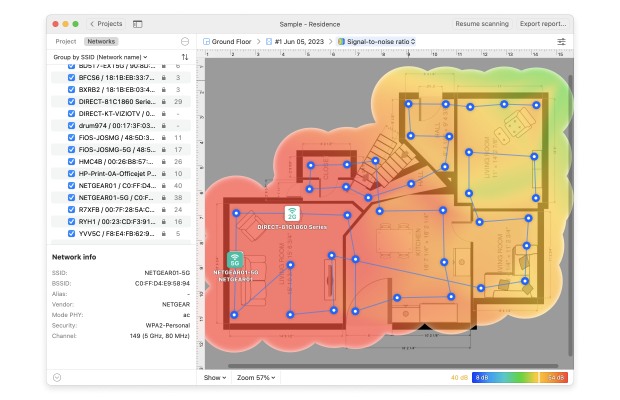
Areas of green are of concern and blue areas are critical. If your wireless network troubleshooting scan shows SNR issues, you will need to consider raising your signal strength or lowering the surrounding noise.
Tip 2. Low signal level
The Low Signal Level heatmap will show you where your signal strength is weak. Causes of weak signal strength include too much distance between the router and the device, or something physically blocking the signal between the router and device.
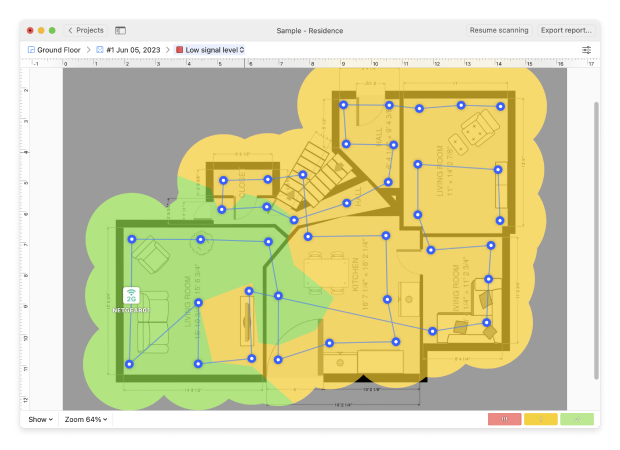
If your WLAN troubleshooting scan shows areas of red and yellow signal levels, you may need to explore ways to boost your signal level.
Tip 3. High noise level
The High Noise Level heatmap will show you where the levels of noise are high. Noise can be caused by electronic devices such as microwave ovens, cordless phones, Bluetooth devices, and wireless video cameras.
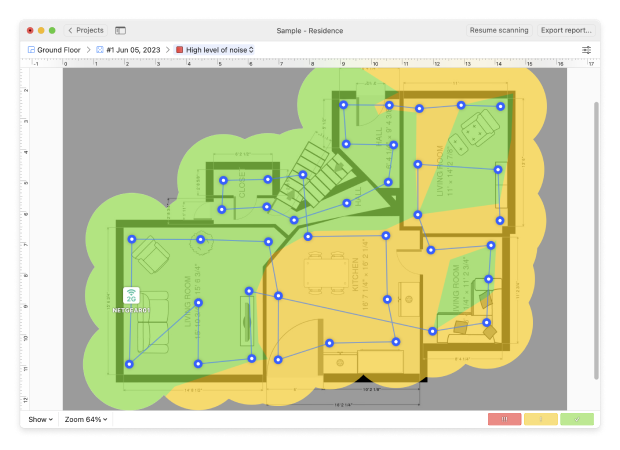
If your WiFi troubleshooting survey highlights large red or yellow patches on the Noise Level heatmap, it usually means the signal is fighting against a lot of background interference. In that case, it’s worth looking for noisy devices nearby and either moving them away from the access point or adding some physical separation between them and your WiFi gear.
Tip 4. Overlapping channels (SIR)
The Overlapping Channels WiFi heatmap shows how clean your signal is compared to interference from other transmitters around you. In most homes and offices, that interference comes from neighboring WiFi networks that sit on the same or partially overlapping channels.
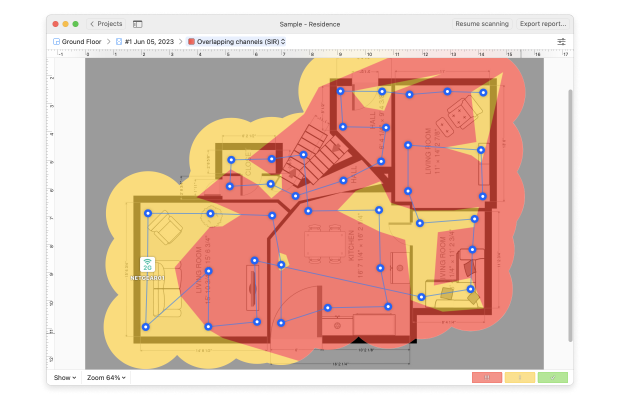
When this heatmap is covered in red and yellow, it’s a sign that your network is competing too hard for airtime. The easiest fix is to switch your WiFi to a less crowded channel and, if possible, a less congested band.
With NetSpot, you can see which channels are overloaded and pick one where nearby networks are weaker or fewer in number. Once you adjust the channel, run another quick scan to confirm that your SIR values look healthier.
Tip 5. Low download and upload rates
An active scan of your network gives you Low Download Rate and Low Upload Rate heatmaps, which show where users are most likely to hit slowdowns. Red and yellow areas on these maps point to spots where downloads, cloud backups, or video calls can feel sluggish.
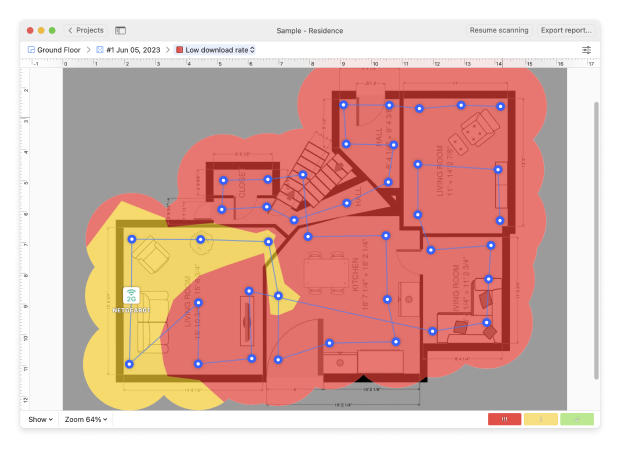
If you see persistent “slow zones”, it’s a clear sign something in your setup needs attention. When you see a lot of red and yellow in these heatmaps, you may need to boost your signal strength or rethink your setup — for example by upgrading your hardware, adjusting WiFi protocols, or changing your bandwidth and channel settings.
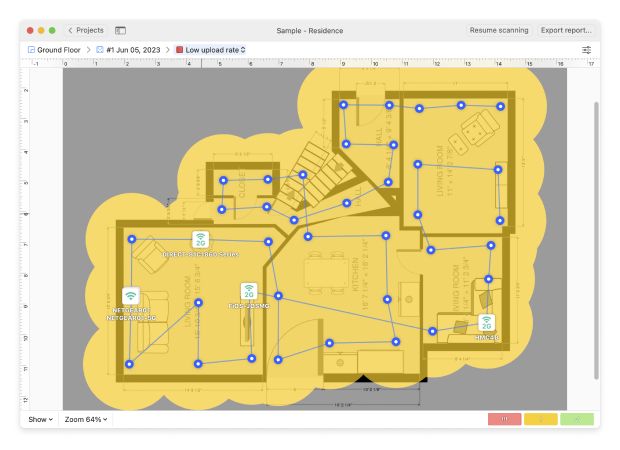
After each change, rerun your active scan — if those problem areas start shifting toward green, you know you’re moving in the right direction.
NetSpot is a practical WiFi diagnostics and troubleshooting tool that visualizes signal strength and interference, making weak zones obvious at a glance.
Use it to test placement, select cleaner channels, and fine-tune configuration for consistent coverage and speed throughout your space — ideal for resolving drops, boosting throughput, and smoothing out everyday connectivity.
WiFi Troubleshooting — FAQs
There isn’t just one reason your WiFi can act up, which is why the best first step is to actually measure what’s going on. Run a detailed check of your network with a wireless analyzer like NetSpot to see where the real problem is coming from.
Signal bars only indicate connection to the router, not internet access. Check if your ISP is down, or flush your DNS cache. You can also use NetSpot to test signal quality and network stability.
There are several things you can do to fix your WiFi connection, and we recommend that you start by restarting your router. If that doesn’t help, then you need to follow the WiFi troubleshooting techniques described in this article to pinpoint the cause of the problem and resolve it.
First, restart both the phone and router. Forget the network and reconnect. If the problem persists, reset network settings or make sure MAC filtering isn’t blocking your device on the router.
Yes, it’s possible to have a working WiFi connection but no access to the internet. This usually happens when the internet service provider is experiencing technical issues or when there’s something wrong with the internet modem.
To troubleshoot any issues with your WiFi start with performing a WiFi site survey in the NetSpot app. New to NetSpot? Not a problem! Just read "How Do I Start My Survey?" and follow the comprehensive guide. First of all identify the area you are troubleshooting. Then you can either upload a map to NetSpot or draw it from scratch.
Once you have a map, you can start taking data samples of your area. When done, you will be able to see the heatmap NetSpot built based upon the measurements you've taken.
You also may check our top of the best apps for WiFi troubleshooting.
Thanks to the Signal-to-Noise Ratio (SNR) heatmap you can easily see where the signal doesn't have enough strength to overcome the noise created by other electronic devices in the area. Green and blue areas are those of concern, with blue (cold) being critical and needing to be taken care of in the first place.
Refer to the Low Signal Level heatmap to see the areas of weak signal. Weak signal strength might be caused by a router being too far from a device or by an obstacle between router and device physically blocking the signal. If you see green and blue areas on your heatmap, you might want to explore ways to strengthen the signal there.
You'll easily determine the areas with high noise levels thanks to the High Noise Level heatmap. Even such appliances as microwave ovens can cause noise and lower the strength of WiFi signal. If you see green and blue areas on your heatmap — look for electronic devices that might be causing the issue and try moving them to another spot.
Use the Overlapping Channels heatmap to see the areas that have a critical signal-to-interference ratio. The blue and green areas will show you where the interference is the highest. Try changing your network's WiFi channel to eliminate the issue.
To see where your Internet connection speed is slow, perform an active scan of your network, and refer to the Low Download Rate and Low Upload Rate heatmaps. If you see red and yellow areas, you might need to change the protocols or bandwidth, or upgrade your hardware.
Not all devices support 5 GHz. Also, some routers disable 5 GHz by default. Check your router settings and make sure the band is enabled.
