Unlimited WiFi site surveys

Whether you are working on a perfect WiFi coverage for your clients or troubleshooting your own — NetSpot is an indispensable assistant.
Need a license for 10 or fewer users? Get NetSpot Enterprise for $699 right now →

Benefit with the endless possibilities of WiFi site survey

  • Cross-platform

    NetSpot Enterprise is a cross-platform (Mac and Windows) solution serving individuals and engineering teams alike.
  • Full coverage

    Get the most efficient and full-bodied WiFi coverage throughout the planned space, be it a small office, a stadium, or an Expo Center.
  • Smart placing

    NetSpot saves you money by helping you build an optimal WiFi network not by crowding your space with unnecessary equipment.

Zones and Snapshots

The complete survey project consists of zones — specific areas that are scanned with NetSpot. Each zone is associated with an area map. The larger area you are going to analyze the more reasonable it is to zone it and perform the survey in stages. It is especially useful for larger projects spreading onto multiple floors in a large building.

You can survey the same zone several times during the day and compare the snapshots of the same zone for the most precise alteration. NetSpot Enterprise offers an unlimited number of zones and snapshots for any size of the area surveyed.

PRO 50 Zones and Snapshots
ENTERPRISE Unlimited Zones and Snapshots
Zones and Snapshots

Datapoints

You don't have to perform the full scan every time. The map of your surveyed space may be huge, but you can scan only a portion of it at a time by selecting the required datapoints. Enterprise edition allows you to itemize your map as precisely as needed because you are getting an unlimited number of datapoints.

PRO 500 Datapoints per zone
ENTERPRISE Unlimited Datapoints per zone
Datapoints

Visualizations

For the most precise analysis there are numerous visualizations that assist in comparing Wi-Fi signals by their various network connection parameters. Visual analysis has always been the best approach to analyze specific signal values.

Passive scanning

  • Signal-to-noise ratio

    It compares the level of WiFi signal to the background noise level, the latter being the amount of outside interference determined at each measuring point.
  • Signal level

    It displays the strength of your WiFi signal, which is important in combination with other values showing how signal level corresponds to interference level for example.
  • Signal-to-interference ratio

    In signal-to-interference ratio the latter is specific to co-channel interference from other radio transmitters.
  • Quantity of access points

    NetSpot always shows you the number of currently detectable access points on your network.
  • Noise level

    Shows the amount of outside interference measured at each point.
  • Frequency band coverage

    It allows quick visual analysis on different frequencies.
  • PHY mode coverage

    It builds visualization by WiFi protocols/modes and shows where 802.11a/b/g/n/ac/ax mode is used.

One-point survey

With NetSpot you can travel to the project site light - with just one hotspot at your disposal - and easily map out a great WiFi network with even coverage.

All you need to do is start a new survey project in the app, place the hotspot in its first location, take a few measurements and then move on to the next location with the same hotspot.

You can then merge all taken snapshots into one heatmap and work with the network as if it had multiple APs.

More about merging snapshots

Plan WiFi networks of any size with just 1 hotspot

Active scanning

  • Upload speed

    This speed reflects the rate of data transfer from the user's computer to the Internet.
  • Download speed

    This speed reflects the rate of data transfer from the Internet to the user's computer.
  • Wireless Transmit rate

    Shows the speed of data transfer from an AP to a wireless device.
  • Iperf3 upload, download, and jitter visualizations

    As well as throughput testing with Iperf 3 or custom speed test servers, they help test the bandwidth performance.

Troubleshooting

  • Issues with SNR

    For troubleshooting purposes use the Issues with SNR visualization, which will help you determine the spots with the low SNR level that can affect your network connectivity.
  • High level of noise

    High noise levels can affect the signal strength of your network and create areas of poor connectivity or no connectivity at all — “dead zones”.
  • Low signal level

    Seeing visually where the low signal level is helps you fix issues with poor to no connection with certain access points.
  • Overlapping channels (SIR)

    NetSpot will show you where there are overlapping channels, and the signal level is low, as well as low download and upload rates.
Planning & Prediction

NetSpot is a perfect tool for planning an entirely new wireless network in a new space when there is no previous estimate yet available on how many hotspots this network might require.


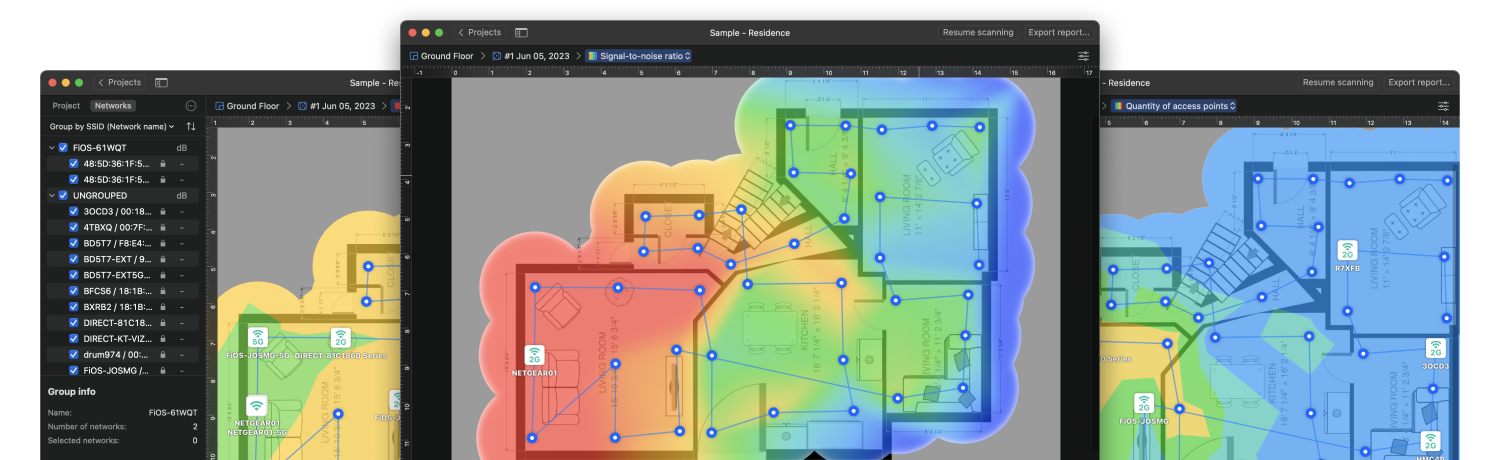
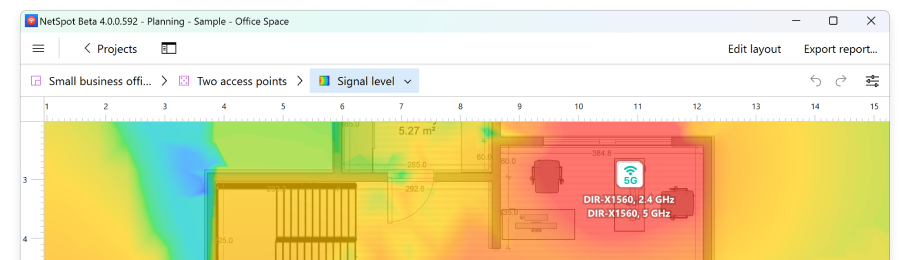
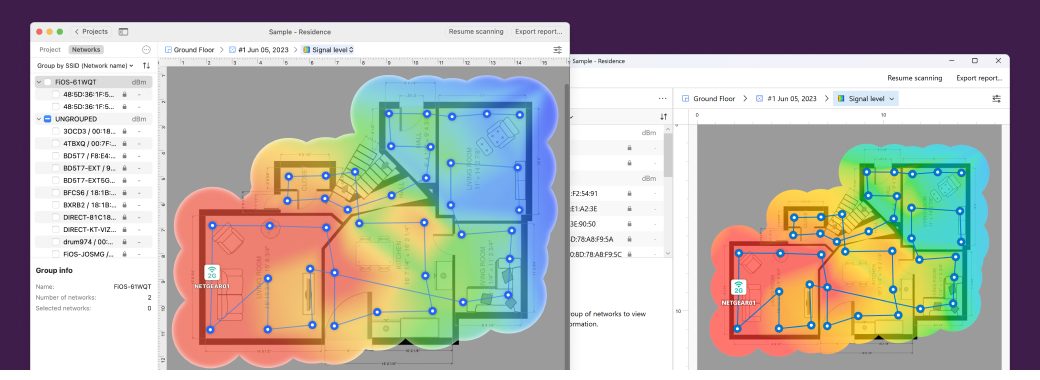
You can simply sketch a plan of the living or office quarters, select the materials walls are made of, which equipment you have in mind for this WiFi setup, and based on that NetSpot will help you predict how many access points you'll need, where to place them, and where your router should be placed for optimal results.


Planning a WiFi network in NetSpot is easy: "move" around your potential router, play with the amount of access points, and create detailed and straightforward reports for your clients. You can also create an APoS survey by merging the snapshots.


More about Planning & Prediction

Planning & Prediction

Cross-platform

NetSpot 3 for macOS and Windows are two apps sharing the same backend logic for a seamless user transition between them, featuring a lot of attention to UI nativity. Both desktop editions of NetSpot (for Mac and Windows) are pretty much identical, which allows for a lot of flexibility when sharing survey projects. Desktop versions also support opening survey projects created in NetSpot for Android.

For Mac
macOS 10.12+
For Windows
7/8/10/11

crossOverviewImage

PRO vs Enterprise

Depending on the size of your project you may need a license covering all your employees. See the comparison below.
PRO For single user only
Enterprise For multiple users
Zones per project
50
Unlimited
Snapshots per zone
50
Unlimited
Datapoints per heatmap
500
Unlimited
Unlimited APs and flexible APs grouping: by SSID, channel, vendor, security, etc.+custom groups
All 20+ visualizations
Technician extra license
1
10
Full-featured Inspector, Survey and Planning modes with data export
Custom speed servers and Iperf3 support
Easily transfer data from one project to another: zones, AP aliases, other data
  • Happy Users

    500K

  • Years on the Market

    10

  • Companies

    75K

  • Countries and counting

    150+

companyLogoXS
Get NetSpot Enterprise
This license is for up to 10 users.

Available for macOS 10.12+ or Windows 7/8/10/11 computers with a standard 802.11a/b/g/n/ac/ax wireless network adapter for $699.
Portable computers aka laptops or MacBooks are recommended.

Request Company-Wide License Quote

Need more than 10 employees or field experts to run, manage and share NetSpot survey data? Request it now.