Wi-Fi Site Surveys, Analysis, Troubleshooting runs on a MacBook (macOS 11+) or any laptop (Windows 7/8/10/11) with a standard 802.11be/ax/ac/n/g/a/b wireless network adapter. Read more about the 802.11be support here.
Wi-Fi Heatmaps
NetSpot, Wi-Fi heat map software for Windows and macOS, simplifies Wi-Fi coverage optimization and performance troubleshooting by making the collection and analysis of wireless data effortless even for regular home users.
What is a Wi-Fi Heat map?
A Wi-Fi heatmap overlays a graphical depiction of Wi-Fi signal strength on top of a map of some real physical space, such as your home or office. When you look at a Wi-Fi heatmap, you can instantly see where the Wi-Fi signal is strongest and where it’s so weak that even tasks that don’t require too much bandwidth, such as sending email messages, are barely doable.

As you can probably imagine, having an accurate Wi-Fi heatmap at hand is indispensable when simulating and setting up a Wi-Fi network. Without the ability to see where strong signal levels end and weak signal levels begin, it’s impossible to select the best place for the wireless router to ensure that the entire area is evenly covered.
Wi-Fi heat map may sound complicated and difficult to understand and create, but that couldn’t be further from the truth. Thanks to modern Wi-Fi heatmappers like NetSpot, anyone can create a detailed Wi-Fi heat maps in a matter of minutes and understand them at a glance.
How to Create Wi-Fi Heatmaps with NetSpot?
NetSpot is an easy-to-use Wi-Fi heatmapper that was designed to simplify the process of creating Wi-Fi heatmaps as much as possible while still delivering results that are accurate enough even for professional use.
Here’s how to create Wi-Fi heatmaps using NetSpot:
Step 1
Launch NetSpot and activate the Survey mode using buttons at the top of the main window.
Step 2
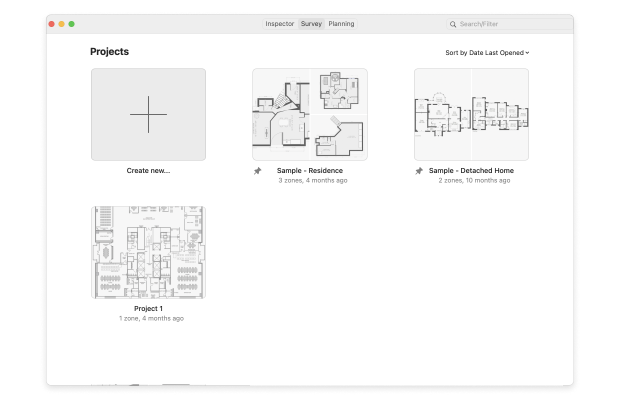
Click the “Create new…” button to start a new project.
Step 3
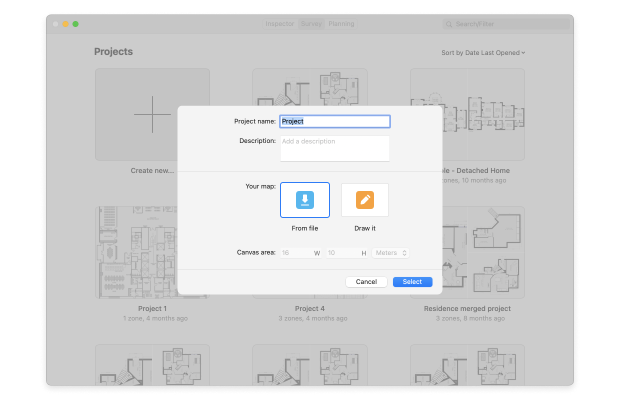
Name your Project and provide an optional description. You’ll be prompted to provide a map of the area you want to survey. You can either upload an existing floor plan or use NetSpot’s built-in tools to draw one.
Step 4
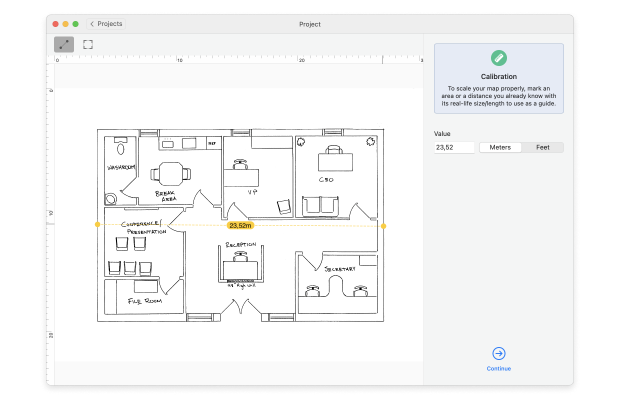
After adding your map, calibrate it so that NetSpot understands how large the surveyed area is.
- Tip: For larger, open spaces, you can use less frequent sampling stops. However, areas with higher object density will require more data points for precise heatmaps.
Step 5
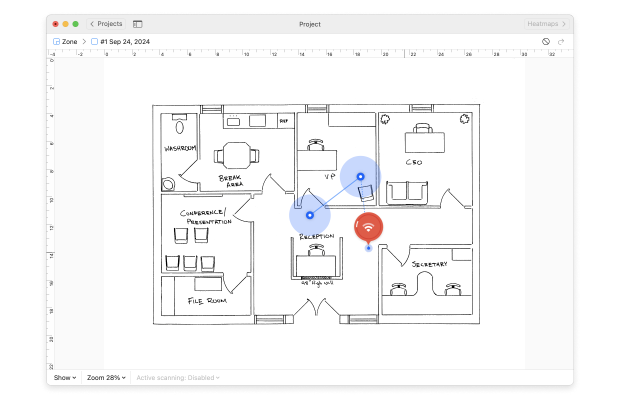
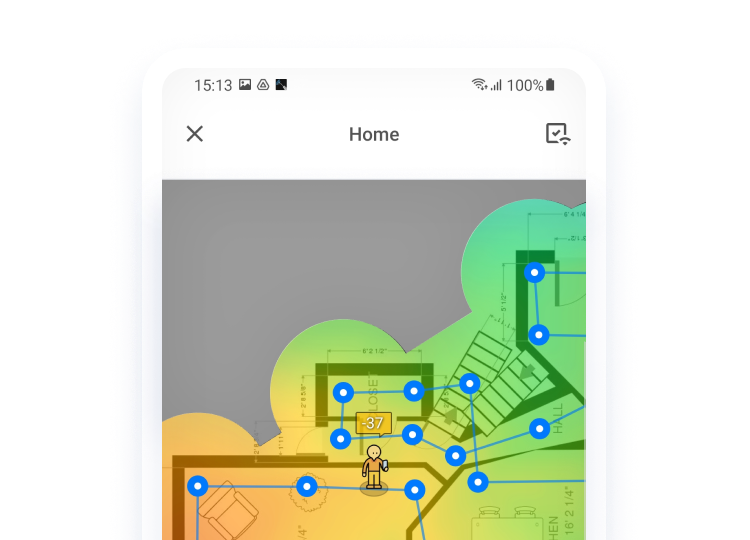
Begin the heat mapping process. Carry your device from one spot on the map to another, taking measurements at each point. NetSpot will display blue, overlapping circles to show the areas you’ve covered. Once you’ve surveyed the entire area, click the “Heatmaps” button to view the results.
Step 6
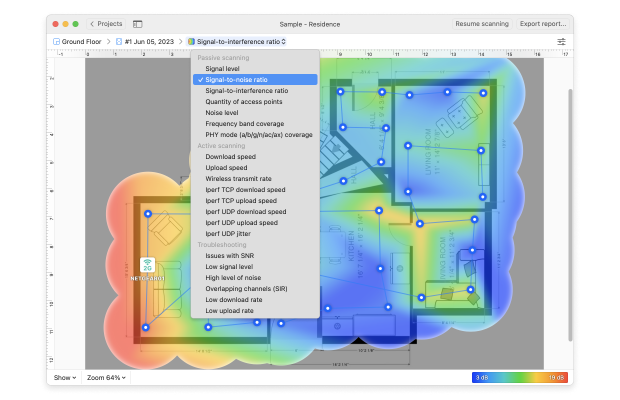
Analyze the Wi-Fi heatmap generated by NetSpot. The default view shows the signal-to-noise ratio, but you can explore other visualizations like signal level, signal-to-interference ratio, or frequency band coverage by clicking on the currently selected visualization and choosing a different one from the list.
Step 7
The last step is to implement improvements based on your analysis. Use the insights gained from the heatmap to optimize your Wi-Fi network. You can refer to the section “How to Fix Signal Weak Spots?” for practical advice on how to achieve the best coverage possible.
For mobile users, NetSpot offers both Android and iOS versions, bringing the power of Wi-Fi heatmapping to your smartphone or tablet. You can use them to create Wi-Fi heatmaps directly on your mobile device, and the process is just as simple as when using the desktop version of the Wi-Fi heat map software.
Once done, you can generate a heatmap on your Android or iOS device, you can either look at the results immediately. The Android version additionally allows you to export the project to NetSpot for Mac or Windows for more comprehensive analysis.
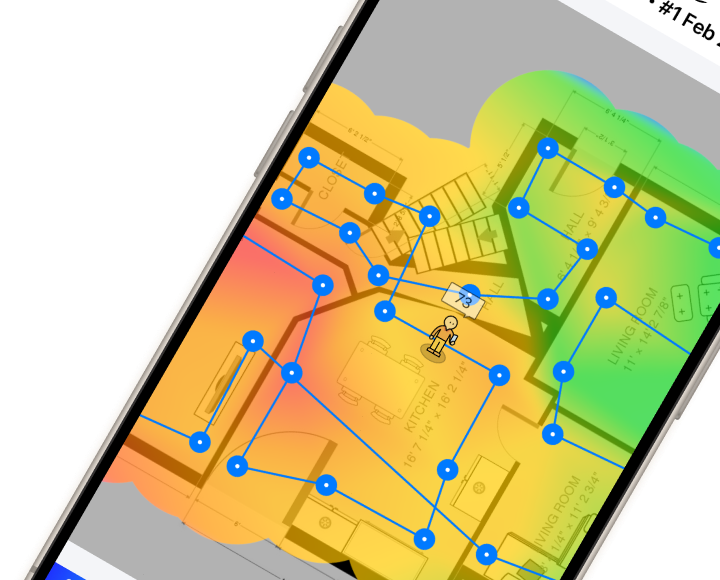
Mobile WiFi survey and analysis
Survey a space of any size directly on your iPhone or iPad in just a few effortless taps.
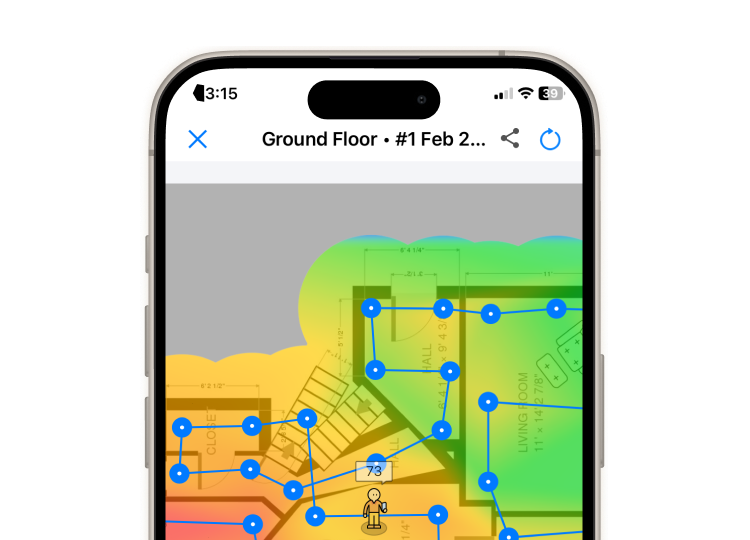
Mobile WiFi survey and analysis
Survey a space of any size directly on your Android device in just a few effortless taps.
Mobile WiFi survey and analysis
Survey a space of any size directly on your Android device in just a few effortless taps.
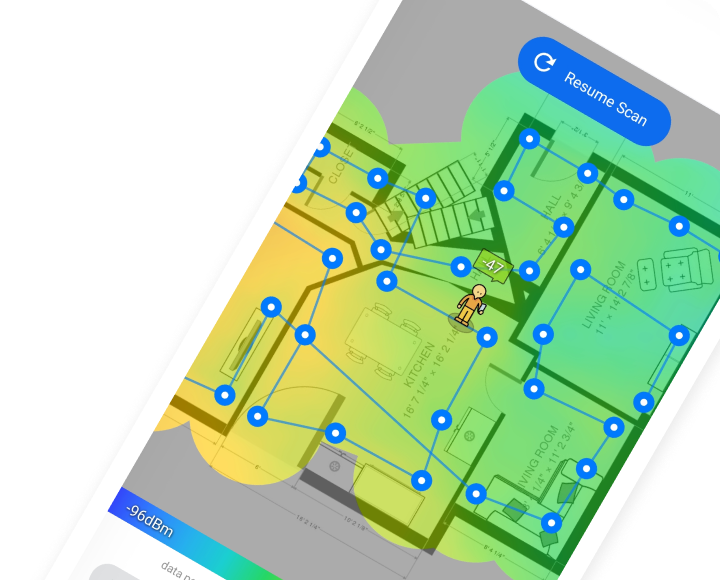
Mobile WiFi survey and analysis
Survey a space of any size directly on your iPhone or iPad in just a few effortless taps.
How to Read Wi-Fi Heatmaps?
The image below shows a Wi-Fi heatmap generated by NetSpot. Notice how different parts of the map have different colors. The color red means that the signal is very strong (hot), green means that the signal is average, and blue means that the signal is weak (cold).
These three main colors create an endless array of possible color gradients, depicting raising or falling signal levels.
Types of Wi-Fi Heat maps
Signal-to-Noise Ratio
The map above displays the signal-to-noise ratio (SNR), which compares the level of the Wi-Fi signal to the level of background noise, which may be produced by microwave ovens, cordless phones, wireless game controllers, wireless video cameras, and many other electronic devices that can be found in most homes today.

Signal-to-Interference Ratio
SNR doesn’t include co-channel interference from other radio transmitters, which is where the signal-to-interference ratio (SIR) comes in. SIR is available as one of the premium visualizations in the PRO or Enterprise version of NetSpot.

Other visualizations available in the PRO version of NetSpot include signal level, quantity of access points, noise level, frequency band coverage, PHY mode coverage.
Signal level
Signal level corresponds to the strength of your Wi-Fi signal, and its purpose is to help you understand how well your Wi-Fi network is functioning in different locations.

Secondary signal level
Shows the second strongest Wi-Fi signal strength detected at a specific measuring point. You can see how the secondary signal covers your space, where the clients may have inefficient switch between the APs, and experience degraded WiFi performance.

Quantity of access points
Quantity of access points shows the number of access points detectable at each measurement point on the map.

Noise level
Noise level is the amount of outside interference detected at each measurement point and it’s best understood in comparison to the signal-to-noise ratio.

Frequency band coverage
Frequency band coverage shows you which frequency bands are present in the surveyed area.

PHY mode coverage
Finally, PHY mode coverage shows you which 802.11 protocols are present in your scanning area, including protocol overlap.

How to Fix Signal Weak Spots?
The easiest way to fix signal weak spots is with better router placement based on information provided by a WiFi mapper app like NetSpot. Avoid placing your router inside cabinets, near windows, behind furniture, or in hard-to-reach corners. Ideally, your router should be right in the center of your house, apartment, or office.
If you can’t place your router in the center of your space, you may want to consider purchasing a Wi-Fi extender, which is an electronic device that repeats the wireless signal from your router to expand its coverage. Wi-Fi extenders are relatively inexpensive, and their only inconvenience is the fact that they create a separate Wi-Fi network.
To avoid constantly switching between two different Wi-Fi networks, you can instead purchase a brand-new Wi-Fi router, preferably one with support for the 2.4 GHz, 5 GHz, and the latest 6 GHz Wi-Fi bands. The 6 GHz band, introduced with Wi-Fi 6E, offers several advantages that can help fix signal weak spots:
- Less interference: The 6 GHz band is less crowded, which means there's much less signal interference to worry about.
- Wider channels: It supports wider channels that allow for faster data transmission rates.
- Lower latency: Designed with applications that require real-time responsiveness in mind, the 6 GHz band is a boon to gamers and everyone else whose biggest enemy is high latency.
High-end Wi-Fi routers are equipped with multiple antennas and can focus the Wi-Fi signal to connected devices with a technique called beamforming. Some advanced routers now incorporate all three bands (2.4 GHz, 5 GHz, and 6 GHz) to provide more options for optimizing your network coverage.
Another option are so-called mesh Wi-Fi router setups, which consist of a main router and multiple satellite nodes placed throughout your space. These nodes work together seamlessly to create a single, expansive Wi-Fi network.
Of course, even the best Wi-Fi router on the market won’t fix all signal weak spots unless you configure it properly and use a Wi-Fi channel that’s not occupied too much.

NetSpot's Inspector Mode takes a quick snapshot of nearby Wi-Fi networks and presents wireless data as an interactive table, allowing you to instantly see which Wi-Fi channels are used the most across all available bands. This information can help you choose the least crowded channels for your network.
SO, WE RECOMMEND

NetSpot
Wi-Fi Heat map — FAQ
What is a Wi-Fi Heat map?
A Wi-Fi heat map is a visual representation of wireless network signal strength and coverage within a specific area. It uses color gradients to indicate signal quality, helping identify dead zones, weak spots, and optimal locations for routers or access points, ensuring efficient Wi-Fi performance and coverage.
What are the colors of the Wi-Fi heat map?
Wi-Fi heat maps use color gradients to represent signal strength. Typically, red indicates strong signal strength, followed by yellow and green for moderate signals. Blue and purple represent weaker signals. The colors help visualize network performance across an area.
How do I map my Wi-Fi signal strength in my house?
To map your Wi-Fi signal strength, use a tool like NetSpot. Upload a floor plan, then walk around your house with your device, marking locations. The software records signal data at each spot, generating a heat map that visually shows your Wi-Fi coverage, highlighting strong and weak signal areas.
Mapping your home helps you decide whether you simply need to move your router to a more central location or if your layout requires a mesh system to penetrate thick walls.
If you are wondering whether this level of detail is necessary for your specific setup, join the discussion on this forum about Wi-Fi heatmaps vs. basic analyzers.
Get NetSpot for Free
Wi-Fi Site Surveys, Analysis, Troubleshooting runs on a MacBook (macOS 11+) or any laptop (Windows 7/8/10/11) with a standard 802.11be/ax/ac/n/g/a/b wireless network adapter. Read more about the 802.11be support here.
Fix weak signal spots by placing the router better