WiFi Checker Software Explained
Is your WiFi network performing as well as it should? If not, you need to diagnose the problem using a WiFi checker app so you know exactly what needs to be done to fix it.
A WiFi checker (or a WiFi coverage checker) is a type of software designed to help users analyze wireless networks. These tools collect real-time data on surrounding WiFi signals, providing the necessary insights to assess coverage, speed, and overall performance, or to support the deployment of a new network from scratch.
Jump to...
What Is a Wi-Fi Checker and What Does it Check?
WiFi checkers can be subdivided into four different categories based on what they check.
WiFi speed checkers measure the maximum download and upload speed of a WiFi network. This is useful for understanding whether you're getting the performance promised by your ISP or if slowdowns are caused by poor wireless conditions.
A WiFi coverage checker goes further by showing how well the signal propagates throughout your home or office. Instead of just reporting numbers, it visualizes strong and weak areas by building Wi-Fi heatmaps from on-site measurements. These heatmaps make it easy to see where coverage drops, where dead zones exist, and which parts of the space have stable connectivity. Such insights are critical when deciding whether to move a router, add an access point, or switch to a mesh system.
WiFi signal checkers focus more narrowly on technical parameters like RSSI (Received Signal Strength Indicator) and channel usage. By monitoring RSSI, they show how strong the signal is in a specific spot. It gathers data on WiFi signal strength, noise, and channel usage. Together, this data helps identify interference and suggests which WiFi channels are less crowded.
WiFi security checkers can be used to find poorly secured WiFi networks that might become targets of malicious hackers. It scans for encryption types and flagging networks that use outdated security protocols such as WEP, or no encryption at all. These are unsafe and should be avoided or upgraded.
The best WiFi checkers, such as NetSpot, combine the features of WiFi speed checkers, WiFi signal checkers, and WiFi security checkers, and they make it easy even for inexperienced users to diagnose and fix all kinds of WiFi-related issues.
Let’s take a closer look at how NetSpot works in practice and what features it offers.
NetSpot for Android: Your Go-To WiFi Checker
NetSpot for Android stands out as an incredibly powerful yet easy-to-use WiFi checker app.
NetSpot supports both quick diagnostics and in-depth wireless surveys — whether you want to run a WiFi speed checker to test your ISP’s real performance or build a WiFi coverage heatmap to reveal signal weak spots.

NetSpot for Android is compatible with phones, tablets, and Chromebooks, and supports Wi-Fi 4 (802.11n), Wi-Fi 5 (802.11ac), Wi-Fi 6 (802.11ax), and Wi-Fi 6E in the 6 GHz band — making it future-proof for modern environments.
The interface is clean, intuitive, and requires no technical background to get started. Just install the app, give it the required permissions, and start scanning.
You can filter data by signal strength, band (2.4, 5, and 6 GHz), or security type to focus on specific issues, include or exclude networks. After gathering your data in NetSpot for Android, you can export your project and open it in the desktop version of NetSpot on Windows or macOS.
Let’s break down how NetSpot for Android helps you as a:
✅ WiFi Signal Checker
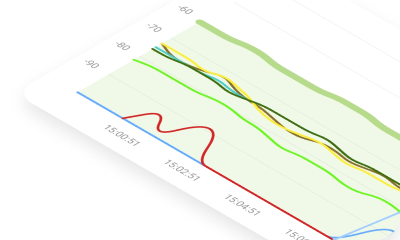
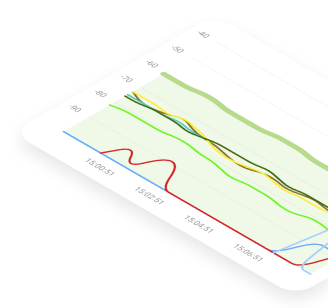
NetSpot’s Inspector Mode allows you to discover nearby WiFi networks, analyze their details like SSID, BSSID, signal strength, frequency bands, and encryption types, and switch seamlessly between table and chart views. It also detects hidden networks that are not broadcast in the usual SSID list, giving you a complete view of the wireless environment.
This gives you instant visibility into the current wireless environment and helps you identify potential issues like weak signals or overlapping networks.

For a visual understanding, the Comparison tab displays how all nearby networks are spread across channels, making it easier to detect overlaps and suboptimal configurations. This makes it easy to see whether your network is operating on a congested channel or if neighboring signals are interfering.
The dedicated Channels tab takes it one step further by analyzing WiFi congestion and automatically recommending the optimal channel to reduce interference.

This feature is especially useful when configuring or troubleshooting routers in crowded environments.
✅ WiFi Speed Checker
NetSpot includes a built-in Speed Test tool, allowing you to instantly measure your download speed and ping.

This is ideal for checking your ISP performance in specific rooms or areas of your home or office, especially when you're unsure if the issue is related to coverage or internet throughput.
✅ WiFi Coverage Checker
For comprehensive coverage analysis, NetSpot Android excels with its Wi-Fi heatmap functionality.
NetSpot’s survey workflow lets you load a floor plan, walk the space, and build color-coded Wi-Fi heatmaps on Android to highlight strong and weak signal areas These WiFi heatmaps help you understand how signal coverage varies across your environment. While heatmaps on Android are simplified compared to the desktop version, they still let you spot dead zones and weak coverage areas.

NetSpot for Android currently offers three main heatmap visualizations:
- Signal level
- Signal-to-interference ratio (SIR)
- Signal-to-noise ratio (SNR)
Each of these helps you assess WiFi performance from a different angle, giving you a more complete picture of your wireless environment.
✅ WiFi Security Checker
In Inspector Mode, NetSpot also displays the encryption type used by each visible network — including WPA2, WPA3, WEP, or open (unencrypted). This helps you assess whether the surrounding networks are secure or vulnerable.
You can also filter networks by security protocol, making it easy to focus only on secure or insecure networks when auditing the wireless environment.

Whether you're a home user optimizing your WiFi or a small business owner troubleshooting performance issues, NetSpot for Android brings professional-grade analysis to your pocket.
NetSpot for Desktop: Comprehensive Wi-Fi Check
NetSpot for Android is a solid choice for quick, on-the-go WiFi diagnostics. But when it comes to in-depth analysis, detailed heatmapping, and network performance testing, the desktop version for Windows and macOS offers a much more powerful toolset.

NetSpot Desktop gives you full access to three major modes:
Inspector Mode
Gives you real-time insights into the WiFi networks around you.
Survey Mode
Provides a comprehensive, map-based analysis of your WiFi network's performance.
Planning Mode
Enables you to simulate and plan your WiFi network's layout and coverage.
NetSpot Desktop runs on Windows 7/8/10/11 and macOS 11+, with full support for Wi-Fi 6E (6 GHz) and Wi-Fi 7 (802.11be) when using compatible adapters. Combined with the ability to import projects from the Android app, it’s the ideal companion for professionals and enthusiasts alike.
Whether you’re troubleshooting performance issues, designing a new WiFi layout, or auditing existing infrastructure — NetSpot Desktop gives you unmatched control, precision, and insight.
Let’s take a closer look at the extra features available in NetSpot for desktop — and how they turn it into a powerful WiFi speed checker, coverage analyzer, and security diagnostic tool.
✅ WiFi Signal Checker
On Android, Inspector Mode shows you the basics, but in the desktop version, Inspector Mode becomes a full diagnostics panel. You see every network parameter — signal strength, channel, band, channel width, security type and more — all in one sortable table.

You can apply advanced filters to focus on exactly what matters. You can filter data by band, signal strength, security type, Wi-Fi standard, channel, channel width, or vendor — all from a single panel.

This makes it easy to focus on specific issues — for example, identifying only wide-channel APs on 6 GHz, or spotting open networks on congested channels.
✅ WiFi Speed Checker
Scanning mode, which goes far beyond simple internet speed tests. It allows you to measure actual network performance — download and upload speeds — from specific locations within your space. These measurements are then tied to the physical map of your site, letting you visualize speed results directly on heatmaps.
This means you don’t just see numbers — you see where the network performs well and where it slows down.

For users who need deeper insights, Active Scanning integrates with iPerf3, giving access to TCP and UDP-based throughput testing. This includes jitter analysis — essential for evaluating stability in applications like VoIP and video calls.
Whether you're checking coverage for a small apartment or testing high-demand areas in a business network, NetSpot’s Active Scanning makes WiFi speed visible and actionable.
✅ WiFi Coverage Checker
NetSpot for desktop offers far more than just a visual overview of signal strength. Compared to the Android version, it delivers comprehensive data collection capabilities, with access to more than 20 types of interactive heatmaps that dissect every critical aspect of your wireless environment.

Passive Scanning Heatmaps
These layers are created as you move through the space, capturing real-time signal data:
Passive Scanning Layers
- Signal Level
Captures raw dBm at every point, so you know exactly where coverage peaks and where it falls off. - Signal-to-Noise Ratio (SNR)
Compares your signal’s strength against ambient noise to uncover areas where interference may overwhelm your network. - Signal-to-Interference Ratio (SIR)
Detects co-channel interference from neighboring transmitters, pinpointing congested frequencies. - Noise Level
Maps background interference throughout the site, highlighting “noisy” zones that sap performance. - Frequency Band Coverage
Visually separates 2.4 GHz, 5 GHz, and 6 GHz usage so you can balance traffic across bands. - PHY Mode Coverage
Shows which Wi-Fi standards (802.11a/b/g/n/ac/ax/be) operate in each area for compatibility insights. - Quantity of Access Points
Counts nearby APs at each survey point, helping you assess network density and overlap.
Active Scanning & Speed Metrics
- Download & Upload Speed
Measures true end-to-end throughput between your device and the Internet. - Wireless Transmit Rate
Tracks real-time data rates from AP to client, revealing local bottlenecks. - Iperf3 TCP/UDP & Jitter
Runs advanced benchmarks against Iperf 3 or custom servers for detailed bandwidth and latency analysis.
Troubleshooting Visualizations
- Issues with SNR
Flags spots where low signal-to-noise ratios can cause drops or slow connections. - High Noise Areas
Highlights regions with excessive ambient interference — common “dead zones.” - Low Signal Zones
Marks areas below your minimum dBm threshold, so you know exactly where coverage fails. - Overlapping Channels
Reveals channel collisions that lead to low signal and reduced download/upload rates.
You can combine these visual layers to get a full picture of your network health — ideal for troubleshooting, optimization, or redesign.
NetSpot allows you to define multiple zones within a single project, which is ideal for multi-room. Each zone can have its own floor plan and survey data, letting you scan separate levels independently while keeping everything organized in one file.
Whether you're mapping a small office or a multi-story building, you can collect, compare, and analyze heatmaps for each floor, making it easier to spot coverage gaps or signal overlap across the entire space.
When your survey is complete, NetSpot lets you export all data — including visual heatmaps, graphs, and tables — to PDF or CSV. These customizable reports are perfect for IT teams, contractors, or documentation needs, and can be shared with just a few clicks.

NetSpot also comes with a clear, flexible, and accessible pricing structure, including a free version for basic WiFi checks, a Home edition for personal use, and Pro and Enterprise plans for professional surveys and high-density environments.
It's also important to remember that testing Wi-Fi quality involves not only checking the signal and channels, but also checking the equipment behind the access points. If the cables, switches, PoE modules, or communication channels are weak, you can spend all day "tweaking" the settings and still end up with unstable performance. Therefore, it's worth checking the basic parameters of your wireless infrastructure as part of troubleshooting.
SO, WE RECOMMEND

NetSpot
Wi-Fi Site Surveys, Analysis, Troubleshooting runs on a MacBook (macOS 11+) or any laptop (Windows 7/8/10/11) with a standard 802.11be/ax/ac/n/g/a/b wireless network adapter. Read more about the 802.11be support here.
The best WiFi checkers combine speed, signal, and coverage data end-to-end — and NetSpot ties all it together.
NetSpot for Android gives you what you need out in the field — fast network discovery, heatmaps, and real-time speed checks and even predictive planning — great for quick surveys or designing layouts right from your phone. NetSpot for desktop takes it further with 20+ heatmaps, advanced filtering, full diagnostics — essential tools when you're optimizing a complex setup or preparing to deploy a new wireless network.
FAQ
What’s the difference between a WiFi speed checker and a WiFi coverage checker?
A WiFi speed checker measures actual throughput (how fast data moves). A WiFi coverage checker maps where your signal is strong or weak, usually with heatmaps, so you can see dead zones and interference.
Does NetSpot for Android support 6 GHz (Wi-Fi 6E)?
Yes. NetSpot for Android supports 2.4 GHz, 5 GHz, and 6 GHz bands (with compatible hardware).
Can I build heatmaps on Android — and which types?
Yes. On Android you can build Signal level, Signal-to-Interference Ratio (SIR), and Signal-to-Noise Ratio (SNR) heatmaps; you can also export the project and generate more heatmap types on desktop.
Does NetSpot support Wi-Fi 7 (802.11be)?
Yes. Current guidance: NetSpot for Windows supports Wi-Fi 7 in Inspector/Survey/Planning; on macOS, Wi-Fi 7 APs are visible and Planning supports 802.11be.
When should I use a guest WiFi network instead of sharing my main password?
If you have visitors often, a separate network is one of the easiest ways to reduce risk without making things complicated. A properly configured guest WiFi network keeps guest devices away from your personal devices and smart home gear, while still giving them stable internet access.
Why is my WiFi signal strong but the connection still feels slow?
In most cases, that means the problem isn’t coverage — it’s congestion or interference. Your device can show a “great” signal and still crawl if too many gadgets are competing for airtime, the channel width is too aggressive for a busy band, or your router ends up sitting on a crowded, noisy channel. That’s where WiFi capacity planning becomes useful, because it looks at real performance under load — not just signal bars.
When is it no longer a Wi-Fi configuration issue — and more about your overall wireless infrastructure?
If you’ve already tested multiple channel setups, optimized placement, and confirmed signal strength — but issues persist — then the problem might be deeper. Inconsistent speeds, random disconnects, or poor performance under load can all point to limitations in your wireless infrastructure. This includes how access points are powered, connected, and distributed throughout your space.
How does a WiFi checker fit into setting up a WiFi network from scratch?
A WiFi checker is most useful both before and after setup. Before deployment, it helps you understand the existing wireless environment — neighboring networks, channel congestion, and signal conditions — so you can make better placement and configuration decisions. After setup, it lets you verify that coverage, performance, and channel choices work as expected in real rooms, not just on paper. This is why WiFi analysis tools are often part of the broader process of how to set up WiFi, rather than something you use only when problems appear.
Can a WiFi checker help with event WiFi deployment?
It can — but event WiFi plays by different rules. At events, a large number of devices come online in the same place at the same time, which puts extreme pressure on airtime and quickly exposes capacity limits.
A Wi-Fi test tool is used to confirm channel conditions, interference levels, and actual throughput during setup, but events typically don't offer much room for experimentation. Therefore, most of the work is done at the initial stage, during planning and capacity modeling, and therefore, Wi-Fi deployment at events is typically considered a separate, more limited type of deployment.
Get NetSpot for Free
Wi-Fi Site Surveys, Analysis, Troubleshooting runs on a MacBook (macOS 11+) or any laptop (Windows 7/8/10/11) with a standard 802.11be/ax/ac/n/g/a/b wireless network adapter. Read more about the 802.11be support here.
Wi-Fi checkers fall into a few practical buckets based on what they measure