WiFi analyzer app runs on a MacBook (macOS 11+) or any laptop (Windows 7/8/10/11) with a standard 802.11be/ax/ac/n/g/a/b wireless network adapter. Read more about the 802.11be support here.
WiFi Analytics Software: What It Is and How to Choose
Discover the best WiFi analytics software of 2026 — from basic scanners to advanced wireless heatmap tools.
If you pay for high-speed internet but still experience "dead zones" in your apartment, slow speeds, or an unstable connection, the problem may not be with your provider. Often, it's related to how your Wi-Fi works in your specific environment.
Before replacing your router or calling tech support, it's worth trying to understand what's happening at the wireless network level. That's what WiFi analytics software is for — tools that help you understand and fix problems hidden from the average user.
What Is WiFi Analytics Software
Let's understand what WiFi analytics apps are and what tasks they should solve.
Essentially, good WiFi analytics software is like an X-ray for your WiFi network. It allows you to see a complete picture of how your wireless network is performing in real-world conditions.
- They scan your wireless environment in real time. It scans your wireless environment to list nearby networks and technical details.
- They show connected devices.
- They help identify weak spots, sources of interference, and suspicious connections.
- Some programs even allow you to create heat maps of WiFi coverage based on a floor plan.
The right tool can help you see what's actually happening behind the scenes — and fix it.
With these solutions, you get much more than just numbers — you truly understand what affects signal quality and how it can be improved.
Top WiFi Analytics Software (2026 Comparison)
By the end of 2026, there will be a variety of WiFi analysis programs on the market, from simple mobile apps to professional business solutions. But they are all different, and to choose the right WLAN software, it's important to understand which features are truly important.
Here are the key features to look for when choosing the right tool:
✅ Real-Time Network Scanning
Your software should instantly detect nearby networks, showing their SSID, channel, signal strength, and encryption type.
This helps you understand which networks and devices are active around you — and how they might be affecting your own signal.
✅ WiFi Channel Overlap Detection
The tool should highlight when your WiFi is competing with neighbors on the same channel.
Too much overlap causes interference, and a good app can suggest cleaner, less crowded channels.
✅ WiFi Heatmaps
Visual wireless heatmaps show you exactly where your signal is strong — and where it drops off.
Some tools let you walk around your space and map signal strength, SNR, or interference room by room.
✅ Compatibility with WiFi 6, 6E, and 7
Your analytics software should support modern WiFi standards to give you accurate data and insights.
If you're using the latest routers and devices, this is essential for relevant performance diagnostics.
✅ Clean and Intuitive Interface
A simple interface means faster results and fewer headaches — especially if you're not a network engineer.
You should be able to read signal charts, device lists, or heatmaps without digging through manuals.
✅ Exportable Reports and Data
Whether you're troubleshooting for a client or documenting changes, it's helpful to export data in formats like PDF or CSV.
This is especially important for consultants, IT staff, or anyone tracking network changes over time.
Now that we know what to look for in a WiFi analytics tool, let’s compare some of the top options available today. Each tool has its own strengths, but not all of them are built for the same type of user or use case.
| Tool | NetSpot |
| Main Features | Heatmaps, surveys, channel analysis, planning |
| Best For | Home + Pro users |
| Ease of Use | ⭐⭐⭐⭐⭐ Very Easy |
| Wi-Fi 6/6E Support | ✅ Yes |
| Platform | Windows / macOS / Android / iOS |
| Tool | SolarWinds NPM |
| Main Features | Full network + Wi-Fi monitoring |
| Best For | Enterprise / IT teams |
| Ease of Use | ⭐⭐⭐⭐ Medium |
| Wi-Fi 6/6E Support | ✅ Yes |
| Platform | Windows only |
| Tool | Ekahau AI Pro |
| Main Features | Predictive planning, Sidekick hardware |
| Best For | Enterprise, WLAN pros |
| Ease of Use | ⭐⭐⭐ Complex |
| Wi-Fi 6/6E Support | ✅ Yes |
| Platform | Windows / macOS |
| Tool | Acrylic Heatmaps |
| Main Features | Floorplan mapping, heatmaps, reports |
| Best For | SMBs, Admins |
| Ease of Use | ⭐⭐⭐⭐ Medium |
| Wi-Fi 6/6E Support | ✅ Yes |
| Platform | Windows only |
| Tool | Wireshark |
| Main Features | Deep packet inspection |
| Best For | Experts only |
| Ease of Use | ⭐⭐⭐ Technical |
| Wi-Fi 6/6E Support | ⚠️ Limited |
| Platform | Windows / macOS / Linux |
| Tool | InSSIDer |
| Main Features | Signal / channel view, link scoring |
| Best For | Admins & technicians |
| Ease of Use | ⭐⭐⭐⭐ Medium |
| Wi-Fi 6/6E Support | ✅ Yes |
| Platform | Windows only |
| Tool | WiFi Analyzer (Windows App) |
| Main Features | Basic scans, channel suggestions |
| Best For | Home users |
| Ease of Use | ⭐⭐⭐⭐ Easy |
| Wi-Fi 6/6E Support | ⚠️ Basic Support |
| Platform | Windows 10/11 |
| Tool | Vistumbler |
| Main Features | GPS-based discovery, signal mapping |
| Best For | Hobbyists / outdoors |
| Ease of Use | ⭐⭐⭐ Niche |
| Wi-Fi 6/6E Support | ⚠️ Limited |
| Platform | Windows only |
Having analyzed these applications side by side, here’s the gist — pick based on what you need:
- All-in-one WiFi surveying, heatmap creation, and planning — without a steep learning curve: NetSpot is your best bet. It combines intuitive design with advanced features, supports the latest Wi-Fi standards, and works across multiple platforms.
- Enterprise-level monitoring, alerts, and SNMP dashboards: SolarWinds NPM excels at network-wide analytics but isn’t built for physical site surveys.
- Professional-grade WiFi design and validation at scale: Ekahau AI Pro leads for wireless engineers — especially if you’re using their Sidekick hardware.
- Advanced WiFi diagnostics with detailed metrics and filtering: Acrylic Heatmaps is a solid option for users who need granular insight into signal quality and advanced filtering — great for troubleshooting medium-complexity networks, especially in Windows environments.
- Deep packet inspection and protocol-level network analysis: Wireshark is unmatched, but best suited for experienced users working with raw traffic data.
- Quick channel selection and signal diagnostics (home/SMB): inSSIDer is lightweight and effective — especially for avoiding crowded frequencies.
- Fast, simple WiFi scans on Windows: WiFi Analyzer (Windows App) is ideal for one-time checks and quick diagnostics.
- Graph-based signal strength tracking and open-source logging: Vistumbler is niche, but reliable for those who prefer visual signal graphs and manual logging.
Our favorite WiFi analytics software is NetSpot. Among all the solutions presented, it stands out as the most flexible, powerful, and yet easy-to-use WiFi analytics software — suitable for both everyday users and IT professionals, consultants, and network engineers. It's more than just a WiFi analyzer — it's a full-fledged tool for surveying, diagnosing, and designing wireless networks.
-

Inspector Mode
Gives you real-time insights into the WiFi networks around you.
-

Survey Mode
Provides a comprehensive, map-based analysis of your WiFi network's performance.
-

Planning Mode
Enables you to simulate and plan your WiFi network's layout and coverage.
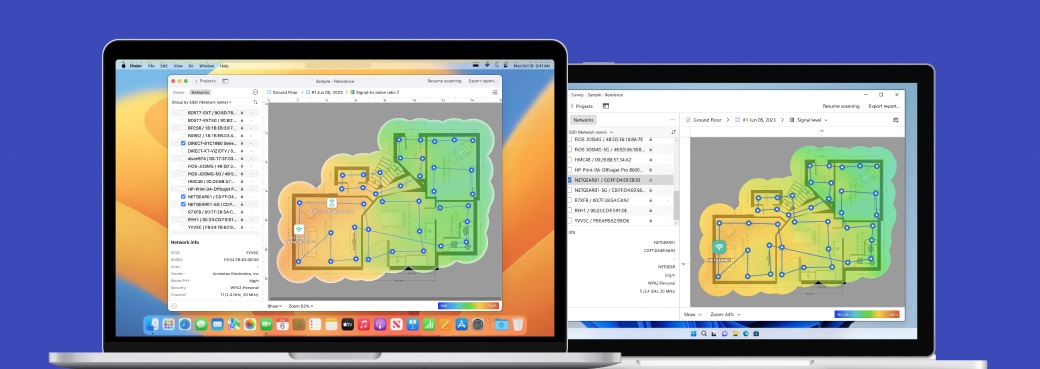
It’s genuinely cross-platform. Use NetSpot on macOS and Windows for deep surveys and planning, and on Android and iOS when you want quick checks, on-the-spot heatmaps, speed/ping from your phone or tablet, and device discovery from your iPhone or iPad. That flexibility means your wifi analytics workflow travels with you from desk to hallway to client site.
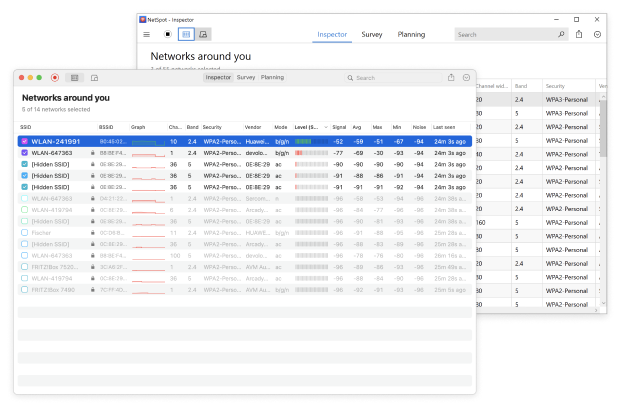
The app is convenient for daily monitoring of your WiFi environment for troubleshooting. The "Inspector" mode provides a visual overview of nearby networks in real time.
The Networks Around You table displays all the necessary network information: SSID/BSSID, band (2.4/5/6 GHz), channel, security, provider, signal strength in dBm, and transmission speed.
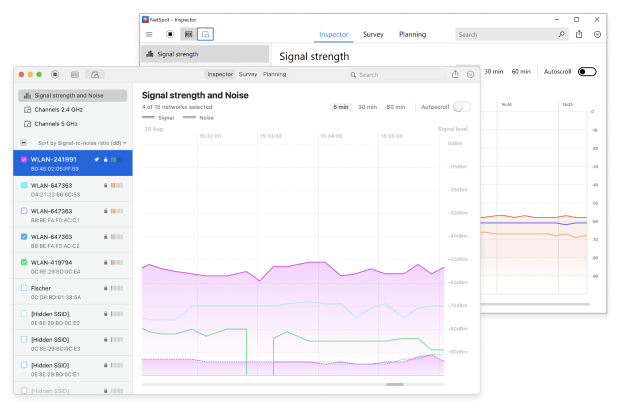
Signal Strength and Channel graphs are also available in real time, allowing you to track changing conditions as you move. These graphs help you identify congestion and interference and quickly select more efficient channels.
When you need the big picture, Survey Mode turns measurements into visual heatmaps. You can display signal strength, signal-to-noise ratio (SNR), interference (SIR), noise, range coverage, and more (over 20 different WiFi heatmaps in total) to instantly see strong and weak areas, as well as overlaps.
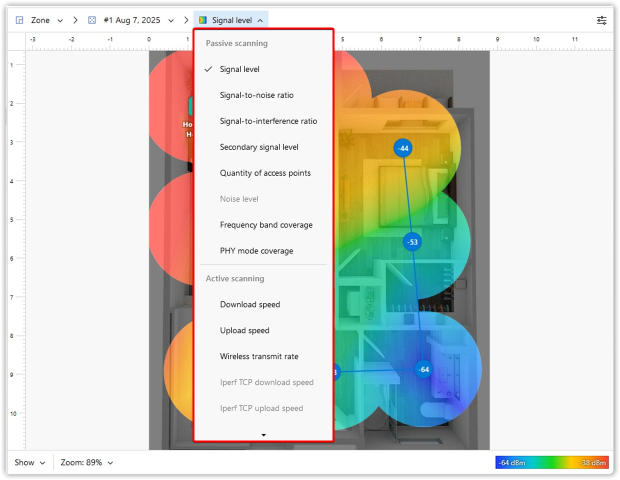
NetSpot translates complex WiFi data into clear, visual heatmaps, showing exactly where your signal is strong, weak, or completely absent. It's the difference between thinking "the signal feels weak in that office corner" and confidently identifying "a -72 dBm with a poor signal level near the glass wall." This level of visibility turns guesswork into actionable decisions.
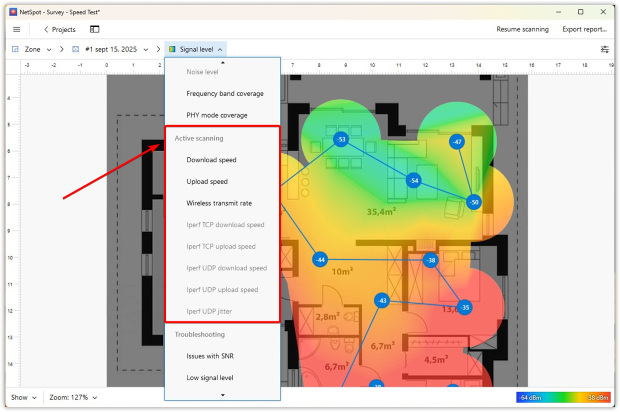
If performance is the question, Active Scanning connects your WiFi analytics directly to real-world results. NetSpot lets you visualize download and upload speeds, monitor wireless transmit rate, and instantly see how your network behaves in different areas of your home or office.
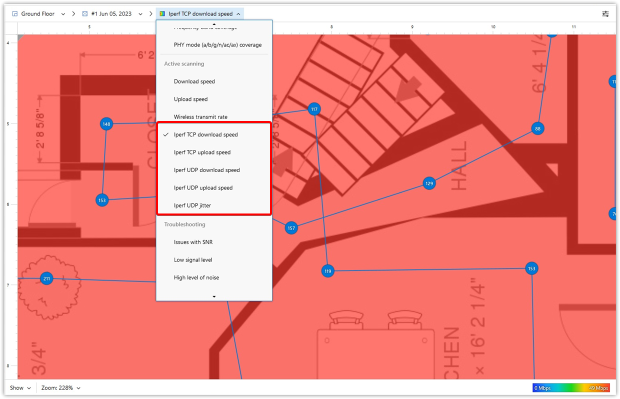
For more advanced users — like IT professionals, system integrators, or anyone who wants to dig deeper — NetSpot also supports iPerf3 testing. You can run TCP and UDP throughput tests, measure latency, and track jitter to get a precise understanding of how your network handles real traffic. This level of detail is ideal when you're troubleshooting inconsistent speeds, preparing for high-bandwidth applications, or validating the impact of hardware or configuration changes.
Also worth noting is the Planning Mode — this is where NetSpot gets strategic. You can design a layout taking into account walls, doors, windows, and materials, upload access point models (or your own specifications), and preview coverage before purchasing equipment or deploying a network.
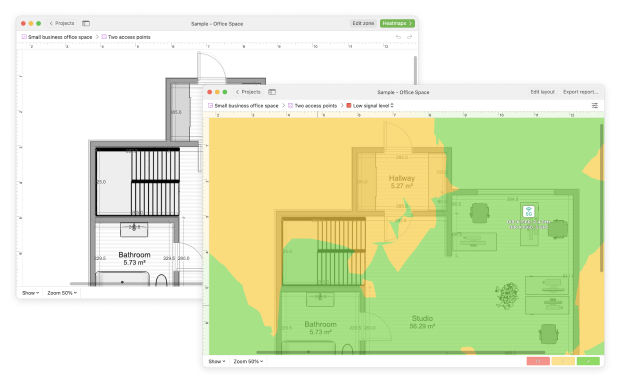
This saves time and money by pre-checking exactly which access points to purchase, the most efficient placement, and even which antennas to choose and how to angle them.
Finally, NetSpot keeps pace with modern WiFi. It’s built to analyze environments across 2.4, 5, and 6 GHz, fully supporting WiFi 6 and 6E standards.
And it doesn’t stop there. NetSpot is actively maintained and regularly updated, with new features and improvements added to support the latest hardware, protocols, and user needs. Whether you're planning for WiFi 7 or troubleshooting a current deployment, you can count on NetSpot to evolve with your network.
Conclusion
If you want to figure out why your WiFi is unstable and stop blindly restarting your router, you should try one of the WiFi analytics software solutions.
There are many such tools available today, from simple mobile apps to professional platforms supporting detailed diagnostics, planning, and visualization. Each has its own advantages, and much depends on your needs, skills, and use cases.
Our personal favorite is NetSpot. It combines a clear interface, extensive features, and cross-platform support. It's a reliable tool for both basic analysis and in-depth work with WiFi coverage, speed, and planning.
FAQ
It’s a tool that helps you analyze and optimize your wireless network — scan signal levels, uncover dead zones, detect interference or unauthorized devices, and visualize coverage with heatmaps.
WiFi analyzers often show basic metrics like signal strength or channel usage. Analytics software usually goes further: surveys, heatmap creation, reports, and long-term monitoring.
Yes. Many tools including NetSpot support both macOS and Windows platforms, so you can run full surveys and diagnostics on either system.
Yes. The good ones are updated to support 2.4, 5, and 6 GHz bands, and many are already preparing for WiFi 7. NetSpot, for example, works across those frequencies.
Real‑time scanning shows a list of present networks with stats like signal, channel, and security. Heatmap or survey mode collects measurements across your space and generates a visual map showing strong, weak, or dead zones.
Some good times:
- You experience drops, buffering, or slow speeds
- You move the router or rearrange furniture
- You add new devices or relocate your home office
- You’ve changed router firmware or settings
- Before an important video call or livestream
- Periodically (e.g. quarterly) to monitor changes
iPerf lets you run TCP/UDP throughput tests, measure latency and jitter — useful for advanced users, IT professionals, or anyone who wants to dig deeper into how your wireless network handles real traffic.

The right tool can help you see what’s actually happening behind the scenes — and fix it.