Wi-Fi Site Surveys, Analysis, Troubleshooting runs on a MacBook (macOS 11+) or any laptop (Windows 7/8/10/11) with a standard 802.11be/ax/ac/n/g/a/b wireless network adapter. Read more about the 802.11be support here.
What is RSSI and its relation to a Wi-Fi network
RSSI, or Received Signal Strength Indicator, is a key metric for evaluating WiFi performance. This guide explains what RSSI means, why it matters, and how to measure it step by step using the NetSpot WiFi signal strength meter to improve your wireless network.
We rarely think about Wi-Fi quality until the internet starts to irritatingly slow when we move from the kitchen to the bedroom. In fact, network stability depends not on a high data plan, but on the RSSI (Received Signal Strength Indicator) — an index of the signal strength reaching your smartphone. RSSI is measured in negative digits (dBm), and the golden rule applies: the closer the value is to zero, the stronger the connection.
There are no hard and fast universal standards, but based on real-world statistics, the following figures can be used as a guide:
- -50 to -60 dBm is the ideal level and a kind of "gold standard" required for smooth 4K streaming and lag-free online gaming.
- Up to -67 dBm is an excellent working minimum, but you shouldn't go below it if you value stable Zoom video calls and fast downloads of large files.
- Up to -70 dBm is the basic limit, suitable for only leisurely scrolling through social media and checking email.
Any readings below -80 dBm are considered critical — in this zone, the internet becomes a continuous series of connection interruptions.
Keep in mind that RSSI is a relative value. Smartphones from Apple, Samsung, or Xiaomi may calculate it slightly differently due to differences in their chips. Therefore, use these numbers as a smart, practical guide to instantly identify blind spots in your home and understand why you're not getting a signal.
Jump to...
What Is RSSI and Why Does It Matter?
RSSI (Received Signal Strength Indicator) is a key metric that network engineers regularly rely on. By making an effort to learn what it is, you can gain a much deeper understanding of the performance of your WiFi network, which is essential for troubleshooting all kinds of performance- and coverage-related problems to enjoy the best experience possible.
In simple terms, RSSI shows how strong the signal is when it reaches your device. It’s usually displayed in negative dBm values — the closer that number is to zero, the stronger your connection. For example, an RSSI of -45 dBm means a rock-solid signal, while -85 dBm is more on the shaky side.
That said, signal strength is just one piece of the puzzle. Today’s Wi-Fi standards — like Wi-Fi 6, 6E, and Wi-Fi 7 — bring more to the table: faster speeds, lower lag, and better performance in busy environments.
These new generations also add smarter tools for analyzing connections, like BSS Coloring, which helps reduce channel interference, and OFDMA, which improves how data is shared across devices. So while RSSI still matters, it works best when viewed alongside these newer metrics.
To really make sense of RSSI, though, it helps to see how it compares to other signal measurements used in mobile networks.
RSSI, RSRP, and SINR — What’s the Difference?
In Wi-Fi, RSSI gives you a raw estimate of signal strength. But in 4G and 5G cellular networks, engineers typically rely on RSRP, or Reference Signal Received Power. Unlike RSSI, which looks at total power including noise and interference, RSRP focuses only on the power of reference signals sent by the cell tower — offering a cleaner snapshot of actual coverage.
Another important point is SNR (signal-to-noise ratio). It essentially shows how much stronger the desired signal is than all the other junk in the air. The higher this figure, the more stable the connection. In the Wi-Fi world, SNR is more often discussed, but the essence is the same: it's a measure of signal "purity".
Each of these parameters highlights the problem in its own way. Understanding how they work together will make it much clearer what's really going on with your network and why it's acting up.
What Does RSSI Stand For?
The acronym RSSI stands for Received Signal Strength Indicator. Let’s explain what each part of this acronym means:
- Received: Wireless signals are typically sent by a WiFi router and received by WiFi devices, such as smartphones, laptops, wireless security cameras, and others. The word received indicates that RSSI is concerned with wireless signals at the time when they're received by WiFi-enabled devices.
- Signal strength: RSSI measures the power present in a received radio signal. In other words, it measures WiFi signal strength.
- Indicator: This is just another word for “measurement,” which is what RSSI is.
Understanding the term is one thing; knowing its numeric ranges and implications is the next step.
What Is RSSI Level?
WiFi signals start gradually losing power from the moment they’re transmitted. Since RSSI is a measurement of received signal strength, it’s always negative, indicating how much signal strength has been lost.
In the real world, it’s impossible to achieve an RSSI of 0, but you want to get as close to 0 as possible. To tell you how close you are, Vendors and chipset makers typically break down RSSI values into several levels.
Each RSSI level represents a certain power level in milliwatts or decibels referenced to one milliwatt (dBm). When you test WiFi signal strength, you should always strive to discover your RSSI level. You can then use the information to determine how much room for improvement there is.
Why Does RSSI Matter?
Now that you understand the RSSI meaning, it’s time to briefly discuss why RSSI matters in the first place.
Many WiFi users rely on internet speed tests to find out how fast their internet connection is. While quick and handy, internet speed tests don’t tell the whole story because there are many different factors that influence your download and upload speeds.
One of these factors is the strength of the received radio signal, and that’s where the RSSI signal strength measurement comes in and why it’s so useful to know it. Because internet speed tests can’t tell you your RSSI, you need to equip yourself with a capable WiFi signal strength Mac app or a Windows WiFi signal strength app.
RSSI Level Meaning Explained
As we’ve already explained in the previous section of this article, RSSI values represent the relative quality of a received signal on a device.
RSSI indicates the power level being received after any possible loss at the antenna and cable level. The higher the RSSI value, the stronger the signal. When measured in negative numbers, the number that is closer to zero usually means better signal strength. As an example, -50 is a pretty good signal, -75 - is fairly reasonable, and -100 is no signal at all.
Here’s a quick overview of acceptable signal strength levels:
| -50 dBm | Excellent | This is the highest signal strength level that can be achieved in real-world conditions. If you manage to achieve an RSSI value of -50, you should have absolutely no trouble enjoying your internet connection to its full potential. |
| -60 dBm | Very good | While not perfect, an RSSI value of -60 is still very good, and most people who don’t know what RSSI is would never guess that their signal strength could be any better. |
| -70 dBm | Good | With an RSSI of -70, you should be able to enjoy most online activities without any major slowdowns and connection drops. From time to time, you may notice that a video is buffering a bit longer than usual or that a file taking a while to download, but that should be the extend of your problems. |
| -80 dBm | Low | This is where things start to get bad. When your RSSI drops to -80, it’s highly likely that your download and upload speeds will suffer considerably, and your latency with them. Sending emails or browsing the web shouldn’t be a problem, but don’t expect to enjoy online games or high-definition video streaming without major issues. |
| -90 dBm | Very low | Most people would find an RSSI of -90 unacceptable for anything beyond the least bandwidth-intensive tasks. At this signal strength level, you are guaranteed to encounter frequent connection drops and issues with lost data packets. |
| -100 dBm | No signal | The more your RSSI nears the value of -100, the closer you get to not having any signal whatsoever. |
RSSI is expressed in arbitrary units, and there’s no standardized relationship of any particular physical parameter to the RSSI reading.
Minimum RSSI
Minimum RSSI is a setting available on some WiFi devices, such as those from Ubiquiti, that allows users to establish a threshold for the lowest acceptable signal strength a device should connect to.
By enabling this feature, you can prevent devices with weak signals from connecting to your network, which often contribute to excessive retries, errors, and network traffic, leading to a decrease in the network’s efficiency and the performance of other connected devices.
Another reason to enable the RSSI setting is that it helps minimize user complaints, which inevitably surface when users experience poor connectivity or slow speeds due to devices with weak signals connecting to the network. By setting an appropriate minimum RSSI value, network administrators can ensure that only devices with strong enough signals can connect, thereby improving the overall user experience.
Determining the appropriate minimum RSSI value depends on the specific needs and layout of your network. If, for example, your network supports high-bandwidth activities like video conferencing and streaming, you may want to set a more stringent minimum RSSI value to ensure optimal performance. In this case, using a value between -50 dBm (excellent) and -60 dBm (very good) would be appropriate, as it would allow only devices with strong signals to connect.
On the other hand, if your network mainly caters to basic activities like web browsing and email, a less strict minimum RSSI value, such as -70 dBm (good), could be sufficient to maintain a satisfactory user experience while accommodating a wider range of devices with varying signal strengths.
The best Android Wi-Fi test apps will help you thoroughly understand your coverage and choose the optimal RSSI level for your needs.
The Difference Between RSSI and dBm
While RSSI and dBm are considered different units of measurement, they both serve the same purpose — demonstrating how strong or weak a wireless signal is.
What is dBm?
The dBm metric measures signal strength relative to one milliwatt (mW). The main difference is that dBm is an absolute value, while RSSI is relative. In practice, RSSI is often displayed in dBm, although there is no strict relationship between the two. This becomes clear if you understand the definition of dBm.
How to Convert RSSI to dBm?
A special comparison table will help you understand RSSI values. However, there's no point in cluttering your head with conversion formulas in practice. There is simply no single conversion standard — each equipment manufacturer interprets these ratios differently. Instead of complex theory, it's better to focus on the main thing: how to boost your Wi-Fi to maximize RSSI levels.
How to improve RSSI and dBm values
There are many proven ways to boost your wireless signal and improve performance metrics:
- Upgrade your router: Modern routers support signal boosting technologies that older models simply don't have. Therefore, purchasing a new, fast router is the easiest, albeit not the most cost-effective, way to immediately boost your RSSI readings.

- Get a stronger antenna: Some routers come with replaceable antennas. If your router is among them, then you can buy a stronger antenna for an instant signal strength boost.

- Place your router in a more suitable spot: A capable WiFi signal analyzer (learn how to check WiFi signal strength on Windows 10) lets you create a visual map of signal coverage, making it easy to see where coverage is strong and where it is insufficient. You can then use this information to place your router in a more suitable spot to minimize signal strength loss.

- Change router settings: Modern routers support two or three different bands, and each band is divided into multiple channels. You can change your router settings to prioritize less used bands and channels over those that are used by other routers in your area.

- Eliminate sources of signal interference: Everything from large electronic appliances to cordless phones can be a source of signal interference. By eliminating as many sources of signal interference as possible, you can reliably improve your signal strength.

How does RSSI relate to signal quality
Even though there is no universal solution, we'll try to break down the approximate interrelation between RSSI and quality percentage.
Signal Quality is a value from 0% to 100%. The higher the number the better the link quality. These are theoretical numbers for ideal conditions in regards to local noise. Depending on the system and device you use it can be determined differently and is based on signal strength and SNR margin. Usually the signal is usable if the quality is above the level of 25-30%.

SNR margin = signal(dBm) - noise(dBm)
E.g. if signal (RSSI) = -55db, and noise = -85db, then:
(-55db signal) - (-85db noise) = 30 SNR margin
Higher SNR margin values mean clearer signals. As an example, using the full 54 Mbps data rate will require at least 25 dB of SNR margin.
Generally,
db more or equal -50 db = 100% quality
db less or equal -100 db = 0% quality
For RSSI signal between -50db and -100db,
quality ~= 2 * (db + 100)
RSSI ~= (quality / 2) - 100
For example:
High quality: 90% ~= -55db
Medium quality: 50% ~= -75db
Low quality: 30% ~= -85db
Unusable quality: 8% ~= -96db
It’s important to keep in mind that RSSI measures only the strength of the signal — not its clarity or reliability. Two devices might report the same RSSI, but have entirely different performance depending on noise, interference, and how busy the Wi-Fi channel is. That’s because RSSI doesn’t tell you how “clean” the signal is — it only shows how strong it was when it hit your device.
This is where SNR (Signal-to-Noise Ratio) becomes crucial. A strong signal surrounded by noise can behave worse than a slightly weaker one in a clean environment. For example, even with a solid RSSI of -60 dBm, your internet speed might crawl if the network is congested or there’s interference from neighboring access points.
It’s also worth noting that a strong RSSI doesn’t guarantee fast internet. While it’s a key ingredient, actual speed depends on many other factors — like router quality, bandwidth limits, the number of connected devices, and your internet provider’s capacity.
To better understand how all this plays out in practice, let’s take a look at two simple graphs that visualize the connection between RSSI, signal quality, and internet speed.


These visualizations show why even small improvements in signal strength might make a noticeable difference in both reliability and performance.
RSSI in 802.11 implementations
RSSI can help determine when the level of radio energy in the channel is lower than a certain point so that the network card is clear to send (CTS). At that time the packet of data can be sent.
The network monitoring tool like NetSpot allows an end user to observe an RSSI value while measuring the signal strength of a WiFi network. It's important to note that RSSI scales can vary between hardware vendors — some use a 0–100 range, while others report values in dBm or apply unique offsets.
For example, certain chipsets may define their own RSSI_Max (e.g., 100), but these values are not standardized and shouldn't be directly compared across devices. Always interpret RSSI in context of your specific hardware and software.
The 802.11 standard does not give any definition of how RSSI value and power level in mW or dBm relate. Chipset makers and vendors give their own accuracy, granularity, and range for the actual power (mW or dBm). Also the range of RSSI values is individual, ranging from 0 to RSSI_Max. RSSI value is obtained during the preamble stage of getting an 802.11 frame, not from the full frame.
To understand and use your signal strength measurements for the most efficient channel planning decisions, NetSpot shows signal strength in two ways.

The Networks Chart visualizes the location of selected networks on the 2.4 or 5 GHz bands in relation to other networks, and displays the signal strengths for each of them.
The Signal Strength graph visualizes the changes in your network’s signal strengths as you move around the space.
Still having issues even though the signal strength is at the acceptable level?
If after all measurements and checks done by a WiFi scan app like NetSpot, that showed your signal strength as acceptable, the connection is still not good, then the problem may be caused by interference. Your computer's WiFi adapter and NetSpot app can help you determine the causes of WiFi interference and improve your wifi signal strength.
How to track signal strength with NetSpot:
Step 1
Download and install NetSpot from its official website. The free version of the application lets you use Inspector Mode, which is often all you need to fix WiFi problems.
Step 2
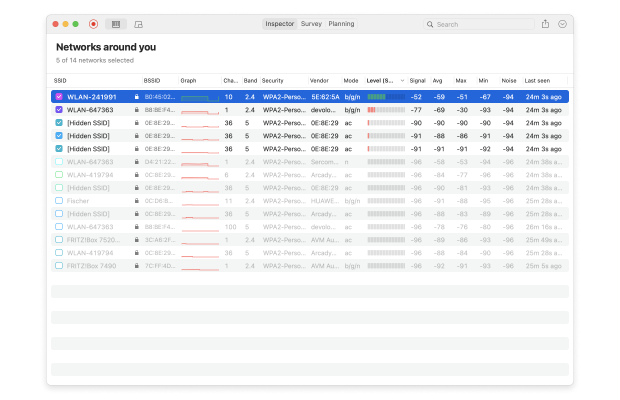
Launch the application and give it a few seconds to gather information about nearby WiFi networks. This will display a list of networks along with their respective signal strengths, channels, and other relevant details.
Step 3
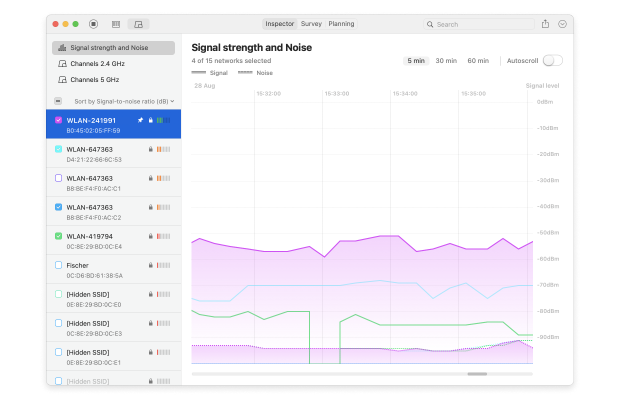
Select the “Signal level and noise graphs” option in the top toolbar. This will show a real-time graph of the signal strength and noise level for the selected network. You can use this graph to monitor the consistency of the signal and identify any potential fluctuations or drops.
Step 4
To check for interference, navigate to the Channels 2.4 GHz, 5 GHz Channels or Channels 6 GHz tab in the NetSpot app. Here, you can see the different channels being used by nearby WiFi networks and their respective signal strengths. If many networks are using the same channel as your network, it could lead to interference and negatively impact your connection.
Use the information gathered from NetSpot to address interference issues. This may involve changing the WiFi channel, moving your router to a different location, or some other weak WiFi signal fix.
Inspect Wi-Fi networks
Analyze the surrounding WiFi networks parameters in real time. Optimize your WiFi network for maximum performance.

Conclusion
RSSI (Received Signal Strength Indicator) is an essential measurement for assessing WiFi performance because it can help you identify areas where WiFi coverage should be enhanced and troubleshoot connectivity issues. Tools like NetSpot make it easy to measure RSSI, interpret its values, and optimize your WiFi network accordingly.
That’s why we recommend downloading NetSpot to diagnose your WiFi issues and achieve a strong, stable connection throughout your entire home or office.
SO, WE RECOMMEND

NetSpot
RSSI Level — FAQs
What should I do if my RSSI is fine, but my internet is still slow?
Sometimes the signal strength is excellent (for example, -60 dBm), but the network is barely functioning. In 90% of cases, interference is to blame. Here's how to solve this problem step by step:
- Check channel congestion. Open the Channel Overlap or Channels 2.4/5 GHz graphs in NetSpot to see how many neighboring routers are using your frequency.
- Switch to a clear frequency. Switch your router to the least congested channel in the settings.
- Narrow the channel width. If there are too many other networks around, avoid wide channels (for example, 80 MHz) — in a crowded area, they only collect unnecessary noise.
- Move the router higher. Move it away from appliances, microwaves, and mirrored surfaces, which can dampen the signal.
- Consider the SINR. In modern Wi-Fi 6/6E and 5G networks, signal purity from noise (SINR) is often more important than just signal strength.
What is RSSI?
RSSI stands for received signal strength indicator and represents the power of a received signal on a device. This measurement indicates the power level being received after a possible loss at the antenna and cable level. The higher RSSI value you are getting, the stronger the signal is.
How does RSSI relate to signal quality?
Signal Quality goes from 0% to 100% — the higher the better, with 100% of course being a value that is theoretical given the ideal conditions. Signal quality can be determined differently based on the devices you are using as well as signal strength and SNR margin. Usually the signal is fine if the quality is above the level of 25-30%.
If you convert technical decibels to more familiar percentages, you can use these numbers as a guide (these values are approximate, but they're enough to get the idea):
- Excellent connection (around 90%) — approximately -55 dBm. The internet literally flies.
- Average quality (around 50%) — approximately -75 dBm. Suitable for casual surfing and video streaming.
- Weak signal (around 30%) — approximately -85 dBm. Dropouts and slow loading times are possible.
- Network not working (around 8%) — approximately -96 dBm. Connecting is practically impossible.
Is it possible to improve the RSSI rating?
Yes, it's entirely possible. Here are a few proven steps that will help boost your signal strength:
- Relocate your router. Find a higher location and closer to the center of your apartment. The key is to keep it away from thick walls and noisy appliances.
- Reduce bandwidth congestion. Switch to a Wi-Fi channel that's less crowded with neighbors.
- Upgrade your hardware. Sometimes a more powerful antenna is enough, but it's better to replace your old router with a modern model right away.
- Expand your coverage area. If you have a large home, deploy a mesh system or install additional access points.
- Find your blind spots. Use apps like NetSpot — they'll clearly show you on a map which corners of your rooms are experiencing signal weakness.
How to understand and use your signal strength measurements?
The 802.11 standard does not universally define the relation between RSSI value and power level in mW or dBm. The range of RSSI values is individual to different device makers, ranging from 0 to RSSI_Max.
In NetSpot you can see signal strengths in two ways, which helps you better understand and use your signal strength measurements. First, the Networks Chart, displays the location of selected networks on the 2.4 or 5 GHz bands in relation to other networks, as well as the signal strengths for each of the networks. Second, the Signal Strength graph, displays the changes in your network’s signal strength values as you move around.
What to do when the signal strength is acceptable, but there are issues with WiFi?
If you have used a WiFi scan app like NetSpot and made sure the signal strength levels are acceptable, but you are still not happy with your connection, then the problem may be caused by interference. Use NetSpot and your computer's WiFi adapter to check for the interference and change things up a bit to avoid it.
What RSSI value is considered good for Wi-Fi?
The "gold standard" for heavy content (such as smooth 4K streaming) is considered to be a range of -50 to -60 dBm. These are ideal values that guarantee maximum speed and a smooth connection.
As soon as the values drop to -70...-80 dBm, network quality noticeably degrades: heavy video starts buffering, and online games become laggy. Anything below -85 dBm is critical, where the internet will constantly drop out.
To put it simply: do you want to download heavy files and play games without lag? Make sure the signal strength on your device doesn't drop below -65 dBm.
Which RSSI value is better — higher or lower?
Since RSSI is measured in negative numbers, the closer the value is to zero, the stronger the signal. For example, -40 dBm is an excellent result, while -80 dBm is on the verge of breaking the connection.
However, remember: a strong signal alone does not guarantee stability. Power is simply the "loudness" of the router. If there is too much radio noise and neighboring networks around, then even with a "loud" signal, data will be lost. For real speed, it's not just raw power that matters, but the clarity of the radio channel itself.
Is an RSSI of 48 good?
RSSI is typically indicated with a minus sign (e.g., -60 dBm), and the closer the number is to zero, the better the signal. However, since RSSI is a relative index with no single, strict standard, some equipment manufacturers display it as a positive scale from 0 to 100, with 100 being the maximum.
If your device uses this 100-point scale, then an RSSI of 48 is a perfectly acceptable result. It's more than sufficient for most everyday tasks: browsing websites, messaging apps, and watching online videos.
Is RSSI 55 good?
Yes, an RSSI value of 55 is generally considered to be good enough for most users and online activities. If measured in negative numbers (with 0 meaning the best signal possible and -100 the worst), then the relative quality of a received signal on a device is slightly worse, but still acceptable.
Is RSSI -72 good?
A received signal strength indication WiFi value of -72 is acceptable but not amazing. Using the methods described in this article, you should be able to improve it until you reach at least -60 (remember, the closer you get to zero, the better).
What RSSI level is considered good for a Ring video doorbell?
The Ring smart doorbell constantly transmits heavy streaming video in real time, so it's very demanding when it comes to network quality. The manufacturer itself states that the ideal range for the device is -41 to -65 dBm. However, the company specifically warns that if the signal stagnates around -60 dBm for a long time, the video may occasionally stutter or become pixelated.
What do these RSSI numbers even mean?
Simply put, the RSSI index shows how much signal strength the signal loses on the way from the router to your device. In real life, radio waves inevitably attenuate, so -20 dBm is the technological ceiling. This ideal level can only be achieved by standing with the device about a meter from the antenna.
All other numbers further down the scale (up to the critical -90 dBm) are the result of the signal penetrating concrete walls, picking up interference from neighboring devices, and losing strength due to distance. The closer your reading is to the coveted -20 dBm, the less loss and the more stable your video call will be.
Is RSSI measured in dB or dBm?
Technically, RSSI has no official units of measurement — it's simply an index. However, in practice, it's often confused or used synonymously with dBm (decibel-milliwatt), which is strictly tied to a power of one milliwatt.
In professional circles, we're accustomed to seeing negative dBm values because it's a well-understood physical quantity. RSSI, on the other hand, is more of an "internal scale" of a device, which each manufacturer interprets differently.
Is RSSI the same as dBm?
Confusion often arises, but RSSI and dBm are not the same thing.
In short, dBm is a universal, absolute measure of signal strength (decibel milliwatts). It's a physical quantity that's the same for all equipment worldwide.
RSSI is a relative index, calculated differently by each hardware manufacturer. Roughly speaking, it's a vendor's internal process: what one router considers a "four", another might consider a "three".
There's no single standard for converting RSSI to dBm, so engineers always rely on dBm as an objective indicator, while RSSI is used more as a quick reference point within a specific ecosystem.
What does "enable minimum RSSI" mean?
Enable Minimum RSSI is a feature (usually found on access points or controllers) that allows you to set a strict sensitivity threshold for client devices.
If the signal strength (RSSI) of a specific device drops below the set threshold, the access point forcibly disables it. This is done to prevent the client from becoming stuck on a weak, fading signal and to timely switch to another network node with a stronger signal. Essentially, this is a roaming management tool and protects the network from "sticky" clients, which degrade overall Wi-Fi performance by attempting to operate at extremely low speeds.
What RSSI level is considered acceptable?
It all depends on what you do online. Here's a simple and straightforward scale to use as a guide:
- Excellent (-50 dBm) — perfect connection. You can download stream in 4K, large files, , and play online without any problems.
- Very good (-60 dBm) — a stable working level, more than enough for 95% of everyday tasks.
- Fair (-70 dBm) — internet use is possible, but high-quality video may occasionally falter.
- Weak (-80 dBm) — expect occasional connection drops and slow website loading.
- Very weak (-90 dBm) — the network is practically unusable; opening anything would be a huge success.
- No signal (-100 dBm) — a dead zone; the device has completely lost the router.
Get NetSpot for Free
Wi-Fi Site Surveys, Analysis, Troubleshooting runs on a MacBook (macOS 11+) or any laptop (Windows 7/8/10/11) with a standard 802.11be/ax/ac/n/g/a/b wireless network adapter. Read more about the 802.11be support here.