Optimize your WiFi Network with Wi-Fi Site Survey Windows Software
WiFi site survey software is essential for unlocking the true potential of your internet connection. Let’s take a closer look at what it does and how you can use NetSpot WiFi site survey Windows software to troubleshoot and optimize any WiFi network.
Jump to...
WiFi Site Survey on Windows
WiFi networks have become an essential part of our daily lives. The trouble is that we don’t see them. Sure, you can see a list of available networks on your smartphone or laptop, and you know where your router is physically located, but you can’t exactly see the wireless signals connecting the router and your devices.
So, when your internet connection suddenly becomes unreliable and your download and upload speeds begin to fluctuate, it can be difficult to pinpoint the issue and apply the correct fix.
WiFi site surveys can give you the information you need to troubleshoot and optimize your WiFi network (or any WiFi network for that matter) by collecting and visualizing important WiFi data, such as signal strength, channel info, and data transmit rate.

There are three major types of WiFi site surveys that you should know about: active, passive, and predictive.
What Is an Active WiFi Survey?
An active WiFi survey is a survey of a specific WiFi network to which you are actively connected to. This type of WiFi survey can obtain invaluable information on network bandwidth, latency, signal strength, and signal-to-noise ratio (SNR), among others.
What Is a Passive WiFi Survey?
To perform a passive WiFi survey, you don’t need to be connected to any specific network. The goal is to capture information on all WiFi activity in the surveyed area to determine how many networks there are, how strong their signals are, and what their configuration is. Equipped with this information, you can make educated decisions about the placement and configuration of your own WiFi network.
What Is a Predictive WiFi Survey?
A predictive WiFi survey is performed prior to the deployment of a WiFi network using specialized software. The software is able to simulate the proliferation of WiFi signals in the surveyed environment, taking into account everything from physical obstacles to interference. While somewhat more technically difficult to perform than active and passive WiFi surveys, predictive WiFi surveys are well worth the extra effort because they can save a lot of money on WiFi equipment.
Who Should Perform a WiFi Site Survey?
It may seem that active, passive, and predictive WiFi surveys are best left to IT professionals or specialists with technical expertise. However, the truth is that almost everyone can benefit from performing a WiFi site survey. This includes:
- Regular home users: Even in a typical household, WiFi signal can be uneven due to various obstructions or electronic interference. Performing a basic WiFi site survey can help identify these issues and lead to a more stable and faster home network.
- Small business owners: With businesses increasingly dependent on reliable internet for point-of-sale systems, customer databases, and other essential functions, a WiFi site survey can ensure optimal network performance and security.
- Network administrators: In medium to large enterprises, the complexity of the network necessitates thorough planning and regular troubleshooting. Network administrators can use WiFi site surveys to maintain peak performance and plan expansions.
- Public institutions: Places like libraries, government offices, and schools often serve a large number of people, so their WiFi networks need to be especially robust. WiFi site surveys play an essential role in helping public institutions meet their connectivity requirements.
- Event organizers: Modern events, such as business conferences, music festival, or sports tournaments, rely heavily on strong and reliable WiFi connectivity for both operational needs and attendee satisfaction. WiFi site surveys make it possible to cover a large venue area with a strong signal.
As you can see, almost anyone can benefit from performing a WiFi site survey, regardless of the setting or scale of the network. Fortunately, modern WiFi site survey software has been designed to be user-friendly, making it accessible even to those without a technical background.
WiFi Site Survey Software
Regardless of which of the three WiFi survey types you choose to perform, you need to equip yourself with a capable WiFi survey app for Windows.
That can be surprisingly difficult because there are many WiFi site survey tools to choose from, and the difference between them can be dramatic. Here are some key characteristics of a good wireless site survey application for Windows:
- Intuitive user interface: Your WiFi site survey software of choice should make your life easier—not more difficult. The best WiFi site survey software tools have an intuitive user interface that nicely blends in with other Windows software and the operating system itself.
- Accurate survey results: The whole point of performing a WiFi site survey is to obtain accurate information on WiFi network, so it goes without saying that choosing accurate software should be your top priority.
- Plenty of advanced features: WiFi site survey software ranges from extremely simple to remarkably complex. While there’s no reason to go with an expensive professional solution if you’re just a regular home user wanting to eliminate signal weak zones, you should still favor software that has plenty of advanced features because you never know when you’ll need them.
- Affordably priced full version: Similarly, there’s no reason to spend an arm and a leg on software whose capabilities you would never be able to take advantage of when simpler and cheaper software is more than able to meet all your needs.
- Helpful customer support: Unexpected issues are not unheard of when using WiFi site survey software to collect information on nearby networks. Helpful customer support can be the difference between finishing the survey successfully and unsuccessfully.
NetSpot WiFi site survey Windows software meets all these criteria and offers number of other benefits as well, which is why we recommend it as the best WiFi site survey software for Windows.
Unlike some of its main competitors, NetSpot WiFi site survey Windows software is constantly updated to maintain compatibility with the latest version of Windows, and new features are added on a regular basis to help users gather accurate information as easily as possible.
In addition to Windows, NetSpot WiFi site survey software is also available as:
- WiFi site survey software for Mac;
- WiFi site survey software for iOS;
- WiFi site survey for Android.
NetSpot WiFi site survey app for Android
Optimize your WiFi network for maximum performance. Inspect, compare, survey, and analyze WiFi networks with NetSpot.

How to Perform a WiFi Site Survey with NetSpot (on Windows)
Performing a WiFi site survey with NetSpot on Windows is so easy that even regular home users with no expert knowledge and previous experience with WiFi site surveys can use the software to troubleshoot and optimize WiFi networks.

NetSpot offers three main WiFi site survey modes: Inspector (for collecting extensive details about surrounding Wi-Fi networks), Survey (for passive and active WiFi site surveys), and Predictive (for simulating WiFi networks before deployment). This makes NetSpot the most comprehensive WiFi site survey solution available for Windows.
Here’s how to perform an active WiFi site survey with NetSpot WiFi site survey Windows software:
Step 1
Download and install NetSpot WiFi site survey software on your computer.
Step 2
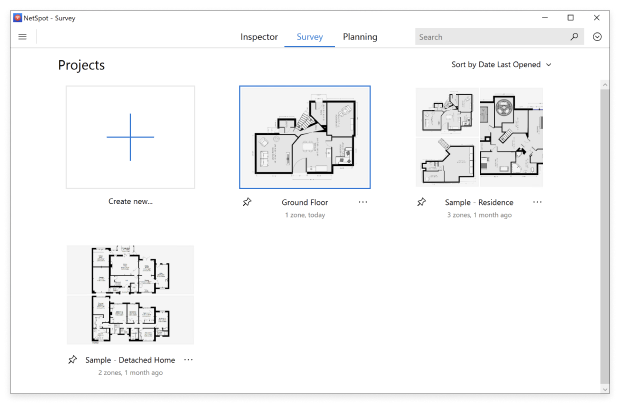
Launch the application and switch to Survey mode.
Step 3
Click the “Create new…” button to start a new survey.
Step 4
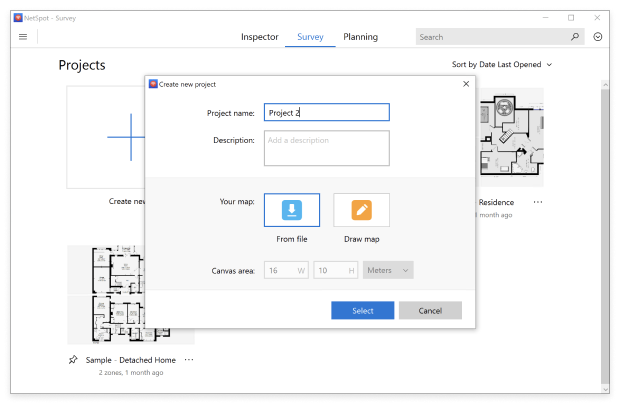
Give your survey a name and import or create a map of the surveyed area.
Step 5
Calibrate the map by selecting two points on the map and entering the real distance between them.
Step 6
Customize the data point precision settings and choose if you also want to measure your upload and download speed. When done, click the “Start scan” button.
Step 7
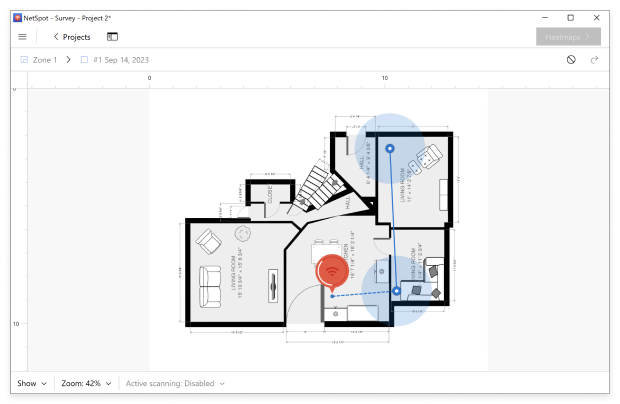
Click the spot on the map corresponding with your actual location and hold still while the scan is in progress. Once done, change your location and repeat the process until you’ve collected enough data.
Step 8
Click the “Heatmaps” button when you’re ready to turn the collected data into detailed heatmaps.
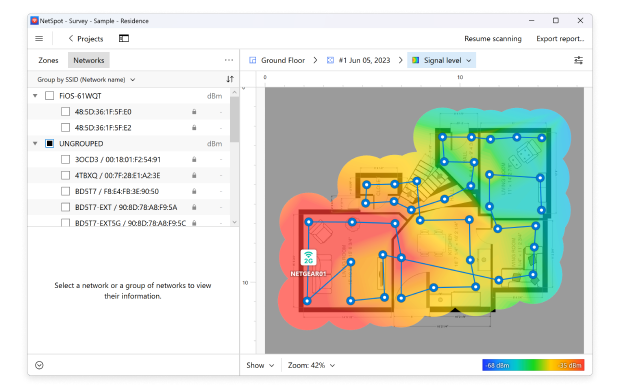
Step 9
Analyze the available heatmaps to figure out how to optimize your WiFi network. Look for areas with poor signal strength or high interference. NetSpot supports several useful WiFi heatmap visualizations, including signal-to-noise ratio, signal level, signal-to-interference ratio, the quantity of access points, PHY mode coverage, and others.
Step 10
Based on your analysis, make the necessary adjustments to your WiFi setup, such as repositioning access points, changing channels, or even adding more access points.
When performing an active WiFi site survey using Survey mode, NetSpot gives you the option to save your surveys and export the gathered data in several different formats. This can be useful for future reference or for sharing with others to collectively decide on the best strategies for optimizing your network.
NetSpot supports several useful WiFi heatmap visualizations, including signal-to-noise ratio, signal level, signal-to-interference ratio, the quantity of access points, PHY mode coverage, and others. The beauty of WiFi heatmap visualizations lies in their intuitive use of colors as a way to represent collected data.
Visualizations
It is no wonder that visual analysis is the most preferred method of research and troubleshooting for many because the graphical overlook it offers on any current situation is unrivaled. Let's see what you can visualize and analyze with NetSpot's heatmaps.
Passive scanning
Signal-to-noise ratio
Allows the comparison of the current wireless signal level to the background noise present at each measurement spot.
Signal level
A measurement that is important when combined with such values as interference or noise; it lets you see how strong your WiFi signal is.
Signal-to-interference ratio
Though somewhat similar to SNR, this heatmap allows visualizing the effect of specifically co-channel interference from other radio transmitters on the signal.
Secondary signal level
Shows the second strongest Wi-Fi signal strength (measured as RSSI) detected at a specific measuring point. By analyzing this signal level, you can see how the secondary signal covers your space, where the clients may have inefficient switch between the APs, and experience degraded WiFi performance.
Quantity of access points
Shows how many access points are detected at each spot of the covered space.
Noise level
Shows the level of effect of the outside interference on the coverage at each measuring point.
Frequency band coverage
Allows you to visually analyze the coverage by available frequencies: either 2.4GHz, or 5GHz, or 6GHz or mixed.
PHY mode coverage
This visualization can be used to see which WiFi protocols are engaged throughout your wireless network. You can see whether 802.11a/b/g/n/ac/ax/be or ax protocol is used.
Active scanning
Upload speed
Reflects the rate at which data travels from your computer to a server on the internet. Upload speed is important for efficient video conferencing, uploading content to video streaming services, etc.
Download speed
Reflects the rate at which data travels from a server to your computer. Streaming movies or music, or downloading raw images requires a sufficient bandwidth.
Wireless Transmit rate
Demonstrates the rate at which data travels from an access point to a wireless device.
Iperf3 upload, download, and jitter visualizations
These visualizations are very effective in demonstrating your bandwidth performance in both directions via TCP and UDP protocols.
Troubleshooting
Issues with SNR
This visualization is aimed to assist you in identifying the areas with the low SNR level affecting your network signal strength negatively.
High level of noise
This visualization is aimed at helping you find the areas with excessive noise, which usually leads to very low signal or even "dead zones" with no connectivity.
Low signal level
Use this visualization to identify where there is a need of a higher signal level in order to obtain the optimal connectivity around the areas affected.
Overlapping channels (SIR)
This visualization can help you sort out the most optimal channel usage. You can avoid excessive channel overlapping for neighboring access points and improve connectivity.
Low secondary signal level
This heatmap allows you to visually assess the areas with a low secondary wireless signal. Based on the results you will be able to see what adjustments you could make in order to improve your secondary wireless setup.
Low download and upload rates
Use this visualization to see the areas of lower upload and download speed values. Sufficient speeds are essential for successful content streaming, video-conferencing, and active bandwidth usage by multiple people.

As you can see, performing a comprehensive WiFi site survey on Windows using NetSpot is something anyone can do, and the accuracy of the gathered results rivals even software applications that are aimed strictly at professional users. Whether you're looking to identify dead zones, optimize channel allocation, or balance loads more effectively, the depth of analysis provided by NetSpot gives you a leg up in managing and improving your wireless environment.
SO, WE RECOMMEND

NetSpot
Wi-Fi Site Surveys, Analysis, Troubleshooting runs on a MacBook (macOS 11+) or any laptop (Windows 7/8/10/11) with a standard 802.11be/ax/ac/n/g/a/b wireless network adapter. Read more about the 802.11be support here.
Get NetSpot for Free
Wi-Fi Site Surveys, Analysis, Troubleshooting runs on a MacBook (macOS 11+) or any laptop (Windows 7/8/10/11) with a standard 802.11be/ax/ac/n/g/a/b wireless network adapter. Read more about the 802.11be support here.