WiFi analyzer app runs on a MacBook (macOS 11+) or any laptop (Windows 7/8/10/11) with a standard 802.11be/ax/ac/n/g/a/b wireless network adapter.
What Is a WiFi Spectrum Analyzer and Why Should I Use One?
Learn what a WiFi spectrum analyzer actually measures and when dedicated RF hardware is needed.
You may not know it, but your home Wi-Fi network is constantly competing for a limited space on the Wi-Fi spectrum and is subjected to many different kinds of interference that negatively affect its performance.
A Wi-Fi spectrum analyzer monitors radio frequency (RF) energy within a specific frequency range — capturing more than just Wi-Fi signals. It relies on specialized hardware to detect this activity, while a software application visualizes the collected data through frequency graphs, airtime utilization estimates, or "waterfall" plots.
A standard Wi-Fi analyzer functions differently. It scans the environment for WiFi networks and gathers information about them, such as the channels in use, signal strength, and other network characteristics.
Both kinds of tools help investigate wireless problems, but they answer different questions. Wi-Fi scanning shows which access points are using a channel. Spectrum analysis reveals whether other transmitters are occupying that frequency, even when they do not advertise a Wi-Fi network.
Jump to...
What Is Wi-Fi Spectrum Analysis?
Wi-Fi spectrum analysis examines RF activity across frequencies used by wireless networks. Instead of measuring only the strength of recognized access points, it looks at energy in the band, how strong it is, and how it changes over time. That matters when a network looks healthy in a Wi-Fi scan but still suffers unexplained slowdowns or disconnections.
These measurements require dedicated RF hardware. In a computer-based setup, a compatible spectrum sensor collects the readings, and the application turns them into frequency plots and waterfall views. A standard laptop Wi-Fi adapter generally cannot supply this data, so installing an app alone is not enough. Standalone spectrum analyzers combine the measurement hardware and display in a single instrument.
| Application | RF hardware | How they work together |
| Chanalyzer | Wi-Spy Lucid | The sensor collects RF measurements; Chanalyzer displays activity across the supported bands and provides tools for recording and reviewing it. |
| WiFi Explorer Pro 3 | A supported external spectrum analyzer | The application combines measurements from the RF sensor with information about detected Wi-Fi networks. Check the developer’s compatibility list for the sensor model you intend to use. |
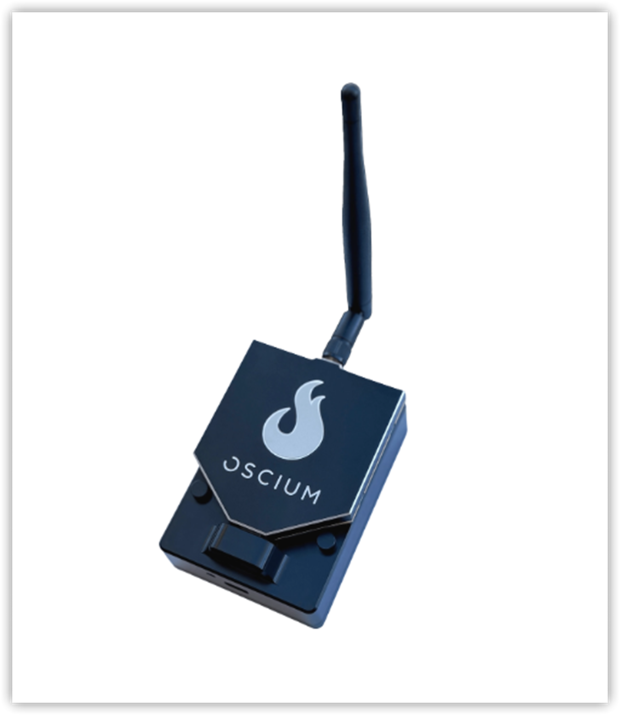
An example of dedicated RF hardware: Wi-Spy Lucid, a USB spectrum analyzer that supplies RF measurements to compatible software such as Chanalyzer
Wi-Spy Lucid collects RF measurements, and Chanalyzer turns those readings into spectrum views and recordings. The sensor and software form a complete measurement setup.
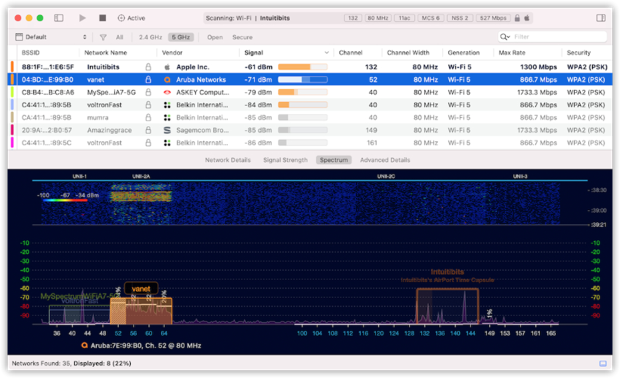
An example of how WiFi Explorer Pro 3 displays RF measurements alongside detected Wi-Fi networks when connected to a compatible spectrum analyzer
Wi-Fi commonly uses the 2.4 GHz, 5 GHz, and 6 GHz bands, subject to regional rules and device support. Channels occupy portions of those bands, and adjacent or overlapping transmissions can affect one another.
Before choosing a setup, check that the software supports your particular sensor and that the sensor covers the bands you need. Support for 2.4 and 5 GHz does not automatically include 6 GHz.
Sharing a channel is not automatically a fault. Wi-Fi devices can coordinate access to the same channel, although contention reduces available airtime. Partially overlapping channels, particularly in 2.4 GHz, can be more troublesome. RF spectrum analysis helps distinguish ordinary Wi-Fi congestion from other radio activity.
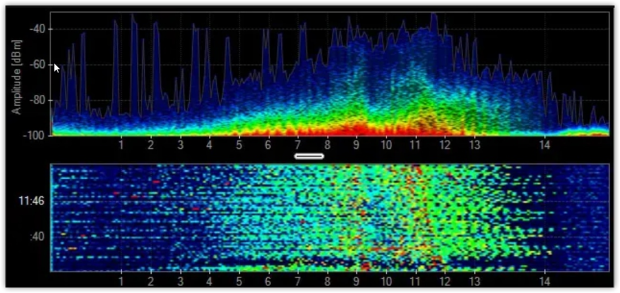
Microwave interference in the 2.4 GHz band. The spectrum view shows the affected frequencies; the waterfall shows when the activity occurs. The pattern varies with the oven and measurement conditions.
Potential non-Wi-Fi interferers include microwave ovens, Bluetooth and Zigbee devices, certain cordless phones, and some wireless video transmitters. Not every electronic appliance causes meaningful interference; the important question is whether it emits energy in the frequencies your Wi-Fi uses.
A true WiFi spectrum analyzer reveals RF interference that ordinary Wi-Fi scans can't see
A Wi-Fi spectrum analyzer app paired with compatible RF hardware can help reveal activity that an ordinary network scan misses. But a spectrum trace does not necessarily identify the exact device: interference signatures provide clues, and locating the source can require moving the sensor, checking when the problem occurs, or switching suspected equipment off temporarily.
When Should I Perform a Spectral Analysis?
A Wi-Fi spectral analysis should be performed throughout the lifecycle of a WiFi network. First, before Wi-Fi deployment, it can be useful to analyze the area to determine whether there is existing interference. In most cases, there will be other Wi-Fi networks, and sometimes non-WiFi transmitters operating in the same bands.
After suitable WiFi frequency bands and channels have been selected and the network is deployed, repeat spectrum measurements can help investigate new or intermittent interference.
Start with Wi-Fi analysis, then investigate RF interference when needed
Spectrum analysis is worth considering when signal strength appears adequate but connections still slow down or drop, especially if the problem occurs in one area, at certain hours, or when particular equipment is running. These patterns suggest where to investigate; they do not prove interference is the cause.
Capture the activity while the problem is happening. A quick check during a quiet period may miss an intermittent transmitter. Compare the results with measurements taken when the connection is working normally.
Why Do Interference and Noise Affect WiFi (802.11) Networks?
If you’re wondering why interference affects WiFi networks in the first place, then we applaud you for asking the right question. The answer to this otherwise complicated problem is simple: WiFi devices exchange data by radio waves.
Radio waves are a type of electromagnetic radiation that can be emitted by all kinds of devices found in most homes and offices, including smartphones, dumb phones, Bluetooth keyboards and mice, smart meters, and more. In fact, all objects that are warm emit some radio waves, including the Earth itself.
For Wi-Fi troubleshooting, what matters is whether unwanted RF activity reaches the frequencies your network uses and is strong or persistent enough to affect reception.
When multiple sources of radio waves are located in the same general area, it’s like when multiple people talk at the same time next to one another and their voices become harder to distinguish.
The effect depends on the transmissions involved. Wi-Fi devices sharing a channel can often detect one another and wait their turn, reducing the airtime available to each. Other signals may make Wi-Fi transmissions harder to decode. Devices then have to resend data, and throughput falls.
A strong signal on a spectrum plot does not, by itself, prove that it is disrupting your network. Check whether its frequency and timing match the affected channel and the observed problem.
How to Detect Noise Sources?
Start by noting where and when the connection fails. Then use a compatible RF spectrum analyzer to observe the affected band during the problem. Look for activity that appears at the same time as the slowdown, occupies the affected frequencies, or becomes stronger as you move toward a suspected source.
Patterns provide clues. Bluetooth activity may appear as short transmissions hopping across frequencies; a microwave oven can produce broader activity in the 2.4 GHz band while running. Other transmitters may produce persistent narrow signals. Real environments contain a mixture of activity, so confirming the source takes more than matching one shape to an example.
NetSpot for Mac can also show where background noise is higher using a Noise Level heatmap.
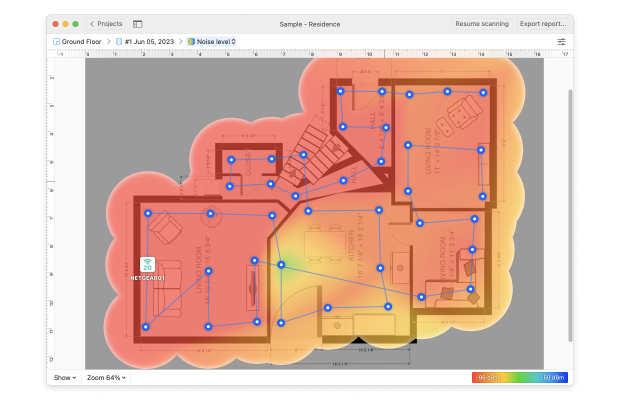
NetSpot’s Noise Level heatmap maps noise readings collected on a supported Mac. It can highlight areas for further investigation, but it does not show the RF spectrum or identify the transmitting device.
This feature depends on the Mac’s ability to collect noise data. Noise measurements cannot currently be collected properly on Windows, although a project containing noise data collected on a Mac can be opened there. The heatmap complements dedicated RF measurements; it does not replace them.
Where safe and permitted, switch suspected equipment off one device at a time and repeat the measurement. Check whether both the RF activity and the connection problem disappear. Keep the sensor position and settings consistent so the comparison is meaningful.
While you may not be able to eliminate all of them, you can always change the position of your router to minimize their impact.
A different channel or frequency band may also help, depending on where the unwanted activity occurs. Repeat the RF capture and the connection test afterward to check the result.
Which Wi-Fi Spectrum Analyzer Should I Use?
A good WiFi spectrum analyzer should meet certain criteria. It should be able to measure RF activity in the frequency bands you need to investigate. Check the actual coverage: a device that supports 2.4 and 5 GHz will not necessarily cover 6 GHz.
Instead of choosing by Wi-Fi generation or security protocol, look at the measurements and views the instrument provides:
| Feature | Why it matters |
| Frequency coverage | The sensor must cover the band and channels you want to test. |
| Power-versus-frequency view | Shows where RF energy appears and its measured power. |
| Waterfall or spectrogram | Shows changes over time, including bursts and recurring activity. |
| Average and peak views | Help distinguish typical activity from brief peaks. |
| Sweep speed and frequency resolution | Affect how well the instrument captures short events and separates nearby signals. |
| Sensitivity and amplitude range | Determine the range of signal levels it can measure. |
| Recording and playback | Let you review intermittent events and compare captures. |
Some applications also offer duty-cycle estimates, Wi-Fi network overlays, or suggested interferer classifications. These can be helpful, but check how they are calculated. An automatic device label is a clue to investigate, not proof of the source.
Once you have shortlisted a sensor, check the software available for it. Features, supported operating systems, and licensing can differ between applications — even when they use the same measurement hardware. Confirm the exact sensor model and software edition rather than assuming that every product from one manufacturer works together.
For an occasional investigation, renting equipment or hiring a wireless specialist may be more practical than purchasing a complete setup. The right choice depends on how often you need RF measurements and how much detail the investigation requires.
How to Perform a Wi-Fi Spectrum Analysis?
To perform a Wi-Fi spectrum analysis, you need RF measurement hardware and software that supports it, or a standalone spectrum analyzer. The controls vary between products, but the basic procedure is similar.
Step 1
Define the Problem
Write down the affected location, Wi-Fi band, channel, and approximate time of failure. Note whether all devices experience it or only one. Run a repeatable connection test so you have something to compare with the RF capture.
For example: a video call drops in one meeting room whenever nearby equipment is operating. That gives you a location, a time window, and a condition to test.
Step 2
Set Up the Analyzer
Connect your spectrum analyzer and open its supported software. Select the band or frequency span covering the affected Wi-Fi channel. Enable a spectrum view and a waterfall so you can watch both power and timing.
Start with the application’s recommended settings. Record the sensor position and any settings you change; those details matter when comparing captures.
Step 3
Record and Compare
Capture the spectrum when the connection is working normally, then record it during the failure. Stay in the same location for the initial comparison.
Watch long enough to catch the suspected event. A short capture can miss a transmitter that operates only occasionally. Save the recordings and note when the connection test slows down or fails.
Step 4
Investigate the Source
Look for activity that changes with the problem. Does a signal appear when a machine starts? Does it stop when that equipment is switched off? Does its measured power rise as you approach one area?
Take readings from several positions. Reflections, walls, and antenna orientation can make the strongest reading misleading, so use several observations to narrow down the location.
Step 5
Make a Change and Retest
Depending on the findings, try a channel change, a different band, greater separation from the source, or an adjustment to the interfering equipment. Change one thing at a time where practical.
Repeat the capture using the same settings and rerun the connection test. The goal is to confirm that performance improved, rather than simply producing a quieter-looking graph.
How to Read a Wi-Fi Spectrum Analysis?
Begin with the axes and legends. A spectrum plot usually places frequency on the horizontal axis and measured power on the vertical axis. A waterfall adds a history of measurements, showing when activity appeared and how long it lasted.
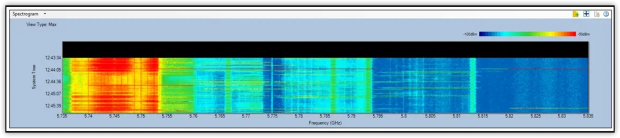
Example of an RF spectrogram showing signal power across frequencies over time. Source: NetAlly, AirMagnet Spectrum XT
Frequency and Channel:
First, locate the affected Wi-Fi channel on the frequency axis. Check whether the observed RF activity falls inside that channel, overlaps part of it, or sits elsewhere in the band.
A peak outside the channel is not automatically relevant. Wider Wi-Fi channels occupy more spectrum, so use the actual channel width when comparing the capture with your network settings.
Band:
The three dominant WiFi bands (2.4 GHz, 5 GHz and 6 GHz) have vastly different characteristics, so it’s important to know which band you are measuring.
Do not draw conclusions about one band from a capture of another. If the problem affects 5 GHz clients, a clear-looking 2.4 GHz trace does not explain their connection.
RF Power :
RF power is often expressed in dBm, or decibels relative to one milliwatt. A less-negative value represents more received power: −50 dBm is stronger than −80 dBm.
These readings are not interchangeable with a Wi-Fi scanner’s signal-strength value for an access point. Spectrum measurements also depend on settings such as resolution bandwidth and detector mode. Compare captures made with consistent settings.
Background Level and Persistent Activity:
The lower background level of a spectrum trace includes the measurement system’s own noise as well as received background energy. A raised level across part of the band may deserve investigation, but the analyzer’s settings and sensitivity affect what you see.
Look for changes relative to a baseline. Persistent activity during every capture and a new signal appearing only during failures call for different investigations.
Timing and Duty Cycle:
The waterfall helps you separate continuous activity from short bursts. A transmitter staying on one frequency can form a persistent band; a hopping transmitter may leave scattered short marks across frequencies. Follow the application’s time direction and color legend.
If a duty cycle is available, check its definition and threshold. It generally describes how often measured activity exceeds a specified level over an observation period. High duty cycle means persistent activity under those settings; it does not automatically mean high Wi-Fi traffic or a confirmed non-Wi-Fi interferer.
Read the views together. Frequency tells you where activity occurs, power shows how strongly it reaches the sensor, and the waterfall shows when it happens. Correlating those observations with a connection test makes the result more useful than any single screenshot.
Conclusion
With the right equipment, you can understand RF activity in the bands your Wi-Fi network uses and investigate possible sources of interference.
Choose a WiFi RF spectrum analyzer that covers the required frequencies, capture the problem while it occurs, and compare the findings with normal conditions. A spectrum signature can narrow down the search. Confirming the source — and checking performance after a change — is what turns that observation into a useful diagnosis.
NetSpot for Mac can complement these measurements with a Noise Level heatmap on supported hardware, helping you spot areas with higher background noise that deserve a closer look.
SO, WE RECOMMEND

NetSpot
WiFi Spectrum Analyzer FAQ
What is a WiFi spectrum analyzer?
A WiFi spectrum analyzer is a software application or a physical device that measures WiFi signals and provides detailed information about them to help with everything from troubleshooting to deployment.
What is the difference between a WiFi analyzer and a spectrum analyzer?
A WiFi analyzer discovers Wi-Fi networks and reports information such as their channels, signal levels, and security settings, while a spectrum analyzer measures RF power across frequency, including activity from transmitters that do not use Wi-Fi.
Which WiFi analyzer is best?
There are many different WiFi analyzers to choose from, some targeting regular home users, while others focusing exclusively on professionals. NetSpot stands out as a versatile WiFi analytics software that is easy enough to use for complete beginners yet capable enough to satisfy the needs of network administrators who deploy WiFi networks for a living.
We've also put together our lists of the best WiFi analyzer apps for Mac and the best WiFi analyzer apps for Windows.
What is a spectrum analyzer used for?
When it comes to WiFi, a spectrum analyzer is often used to investigate suspected RF interference, observe intermittent transmitters, and assess activity across potential Wi-Fi channels.
It helps narrow down likely causes, but a trace alone does not prove which device is responsible or explain every connection problem.
Can a WiFi spectrum analyzer app work without external hardware?
An app can display saved recordings without a connected sensor. For live RF spectrum measurements, it needs compatible measurement hardware — either built into a dedicated instrument or connected separately. A standard laptop Wi-Fi adapter generally provides Wi-Fi scan information rather than raw spectrum data.
Get NetSpot for Free
Wi-Fi Site Surveys, Analysis, Troubleshooting runs on a MacBook (macOS 11+) or any laptop (Windows 7/8/10/11) with a standard 802.11be/ax/ac/n/g/a/b wireless network adapter.