Visualize your WiFi coverage
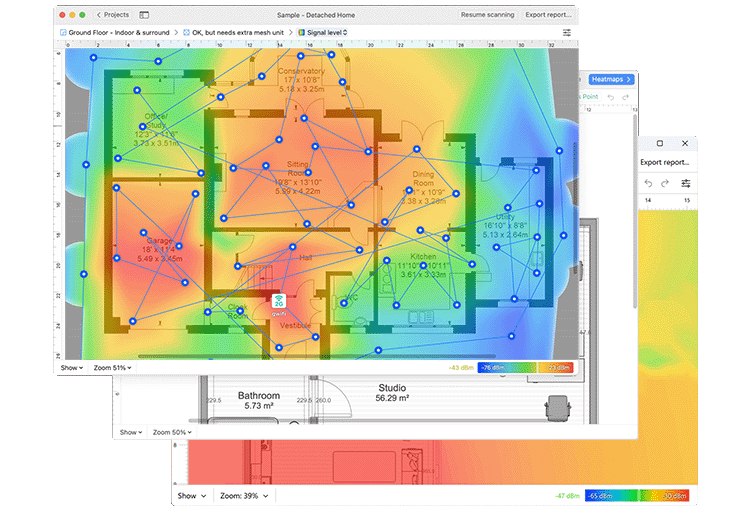
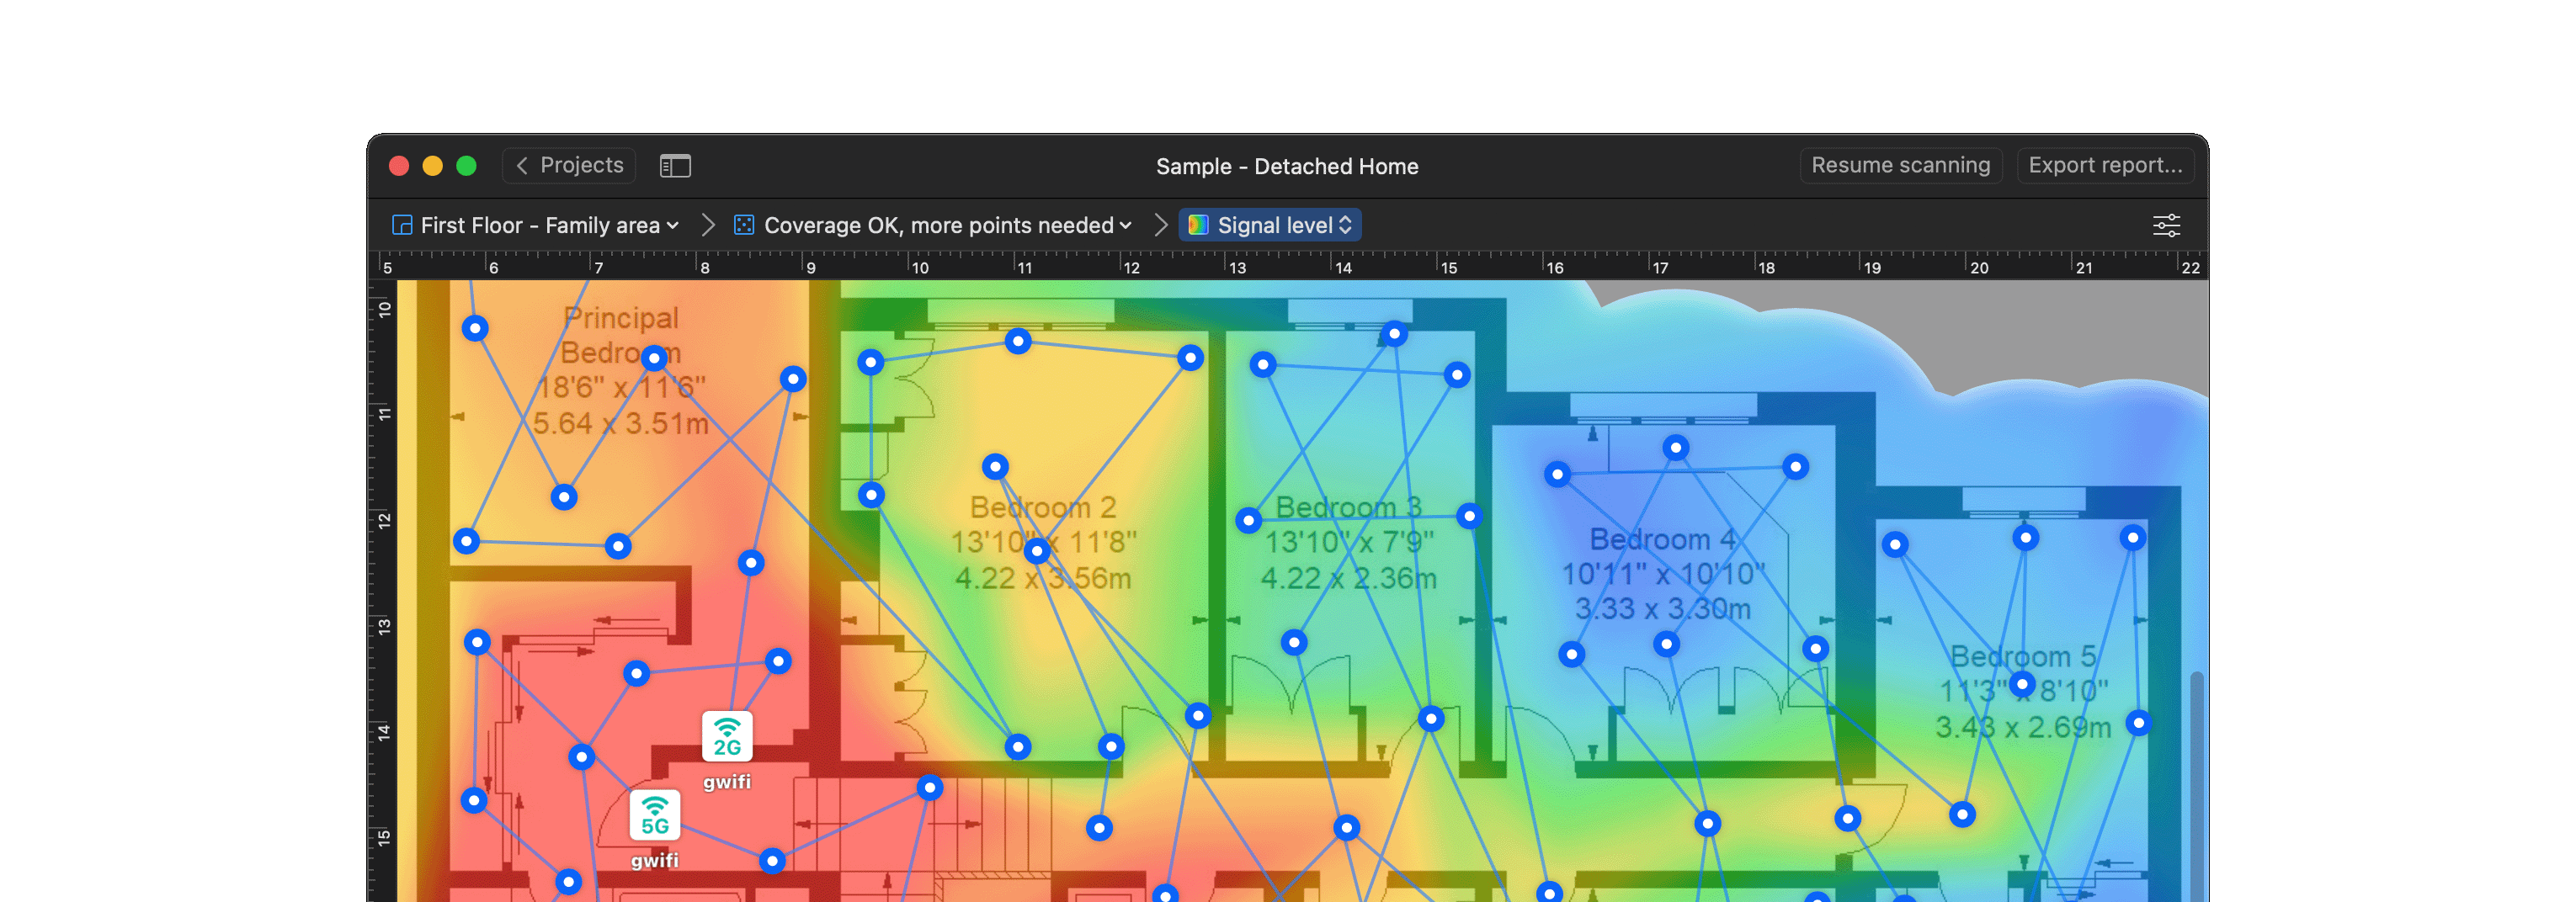
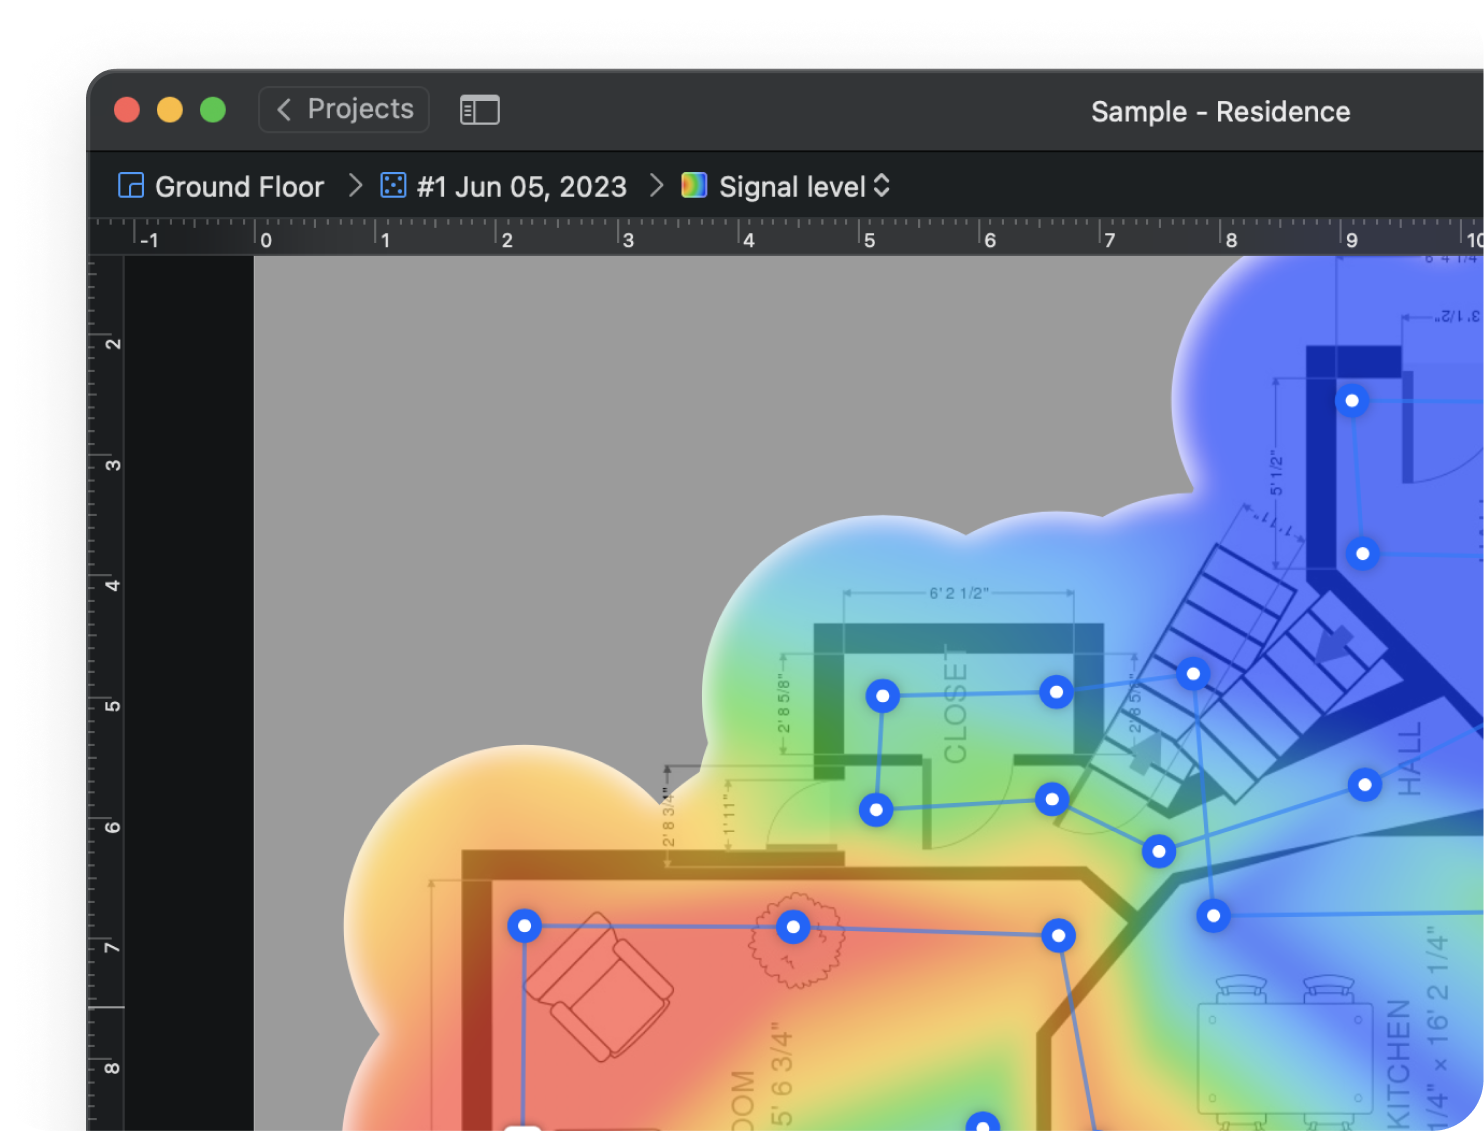
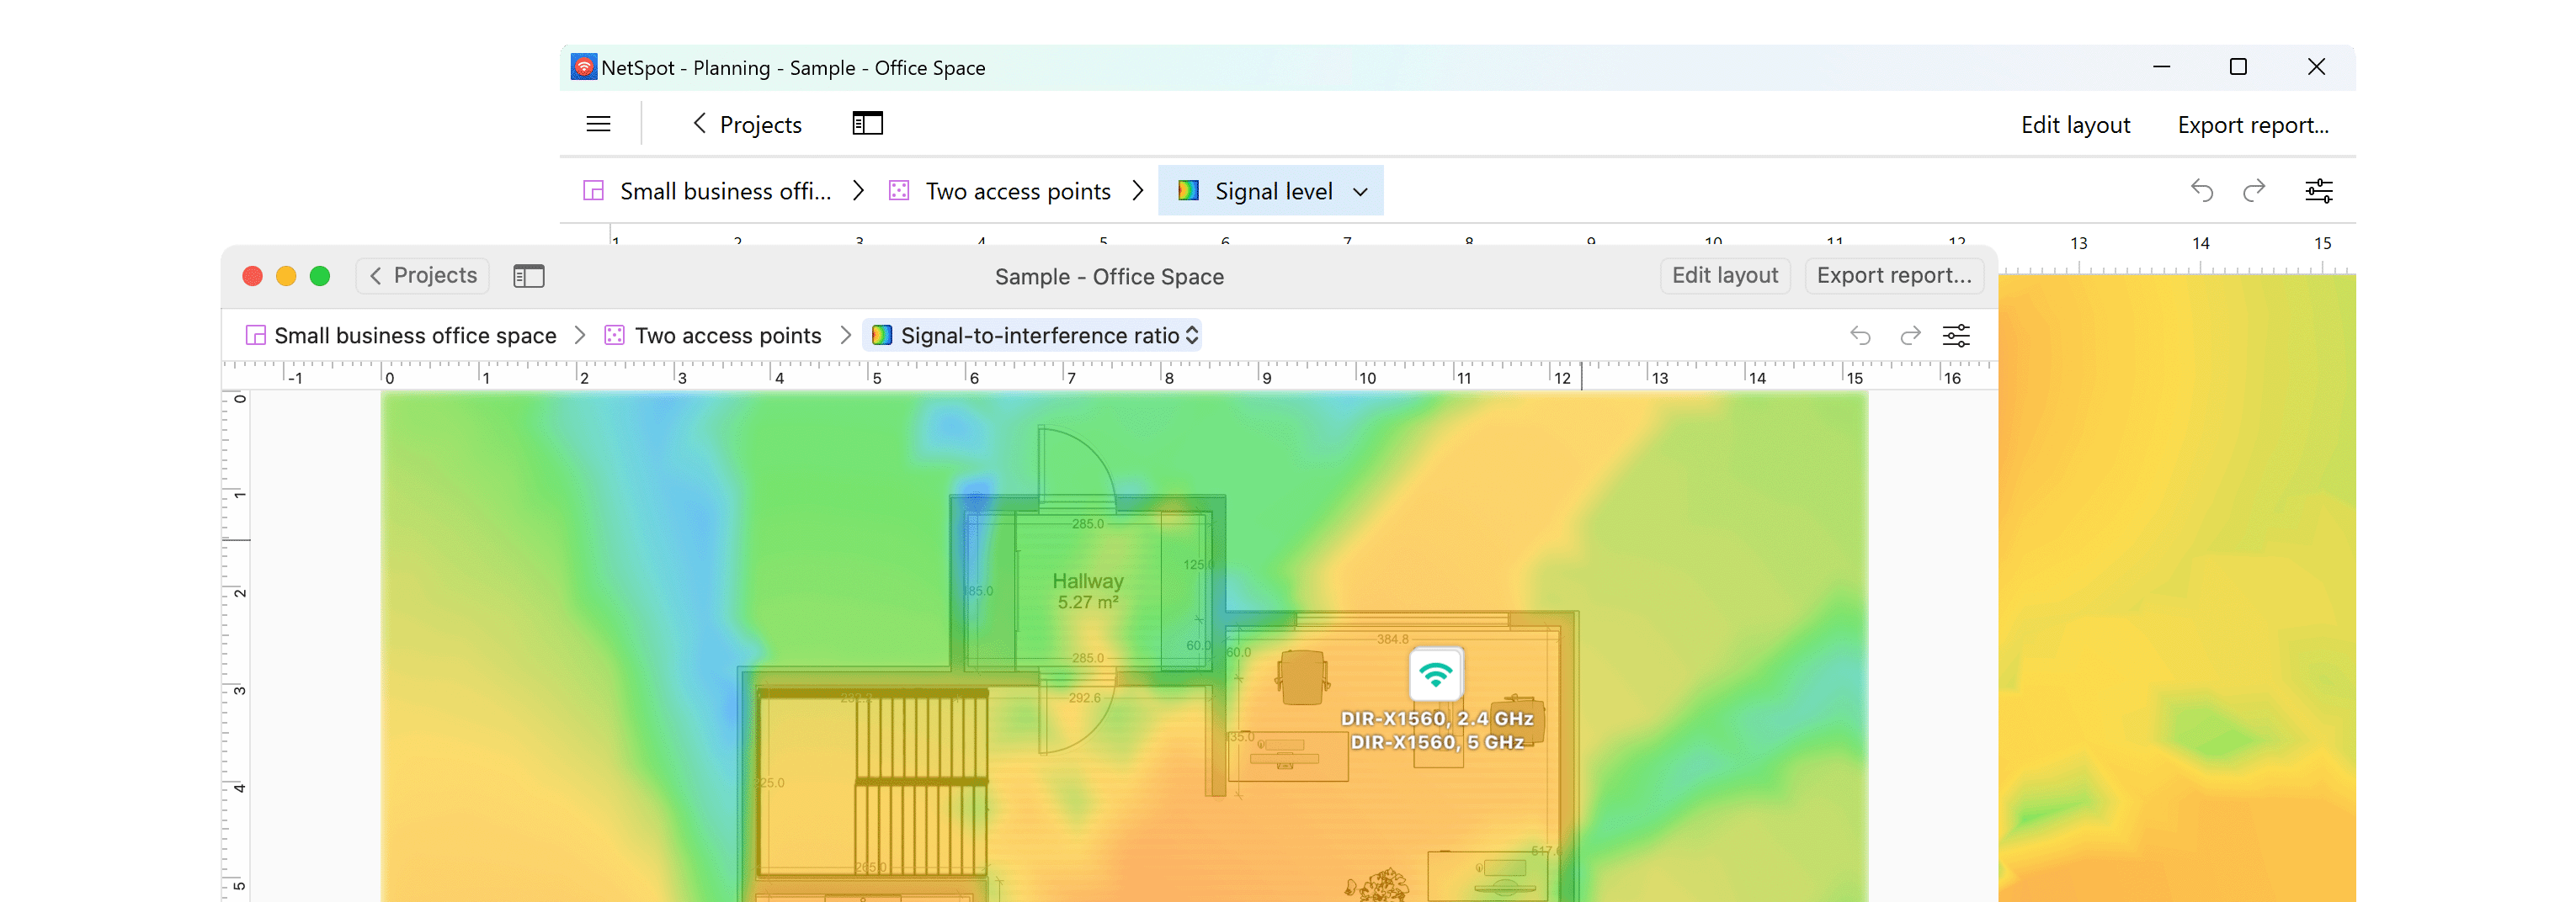
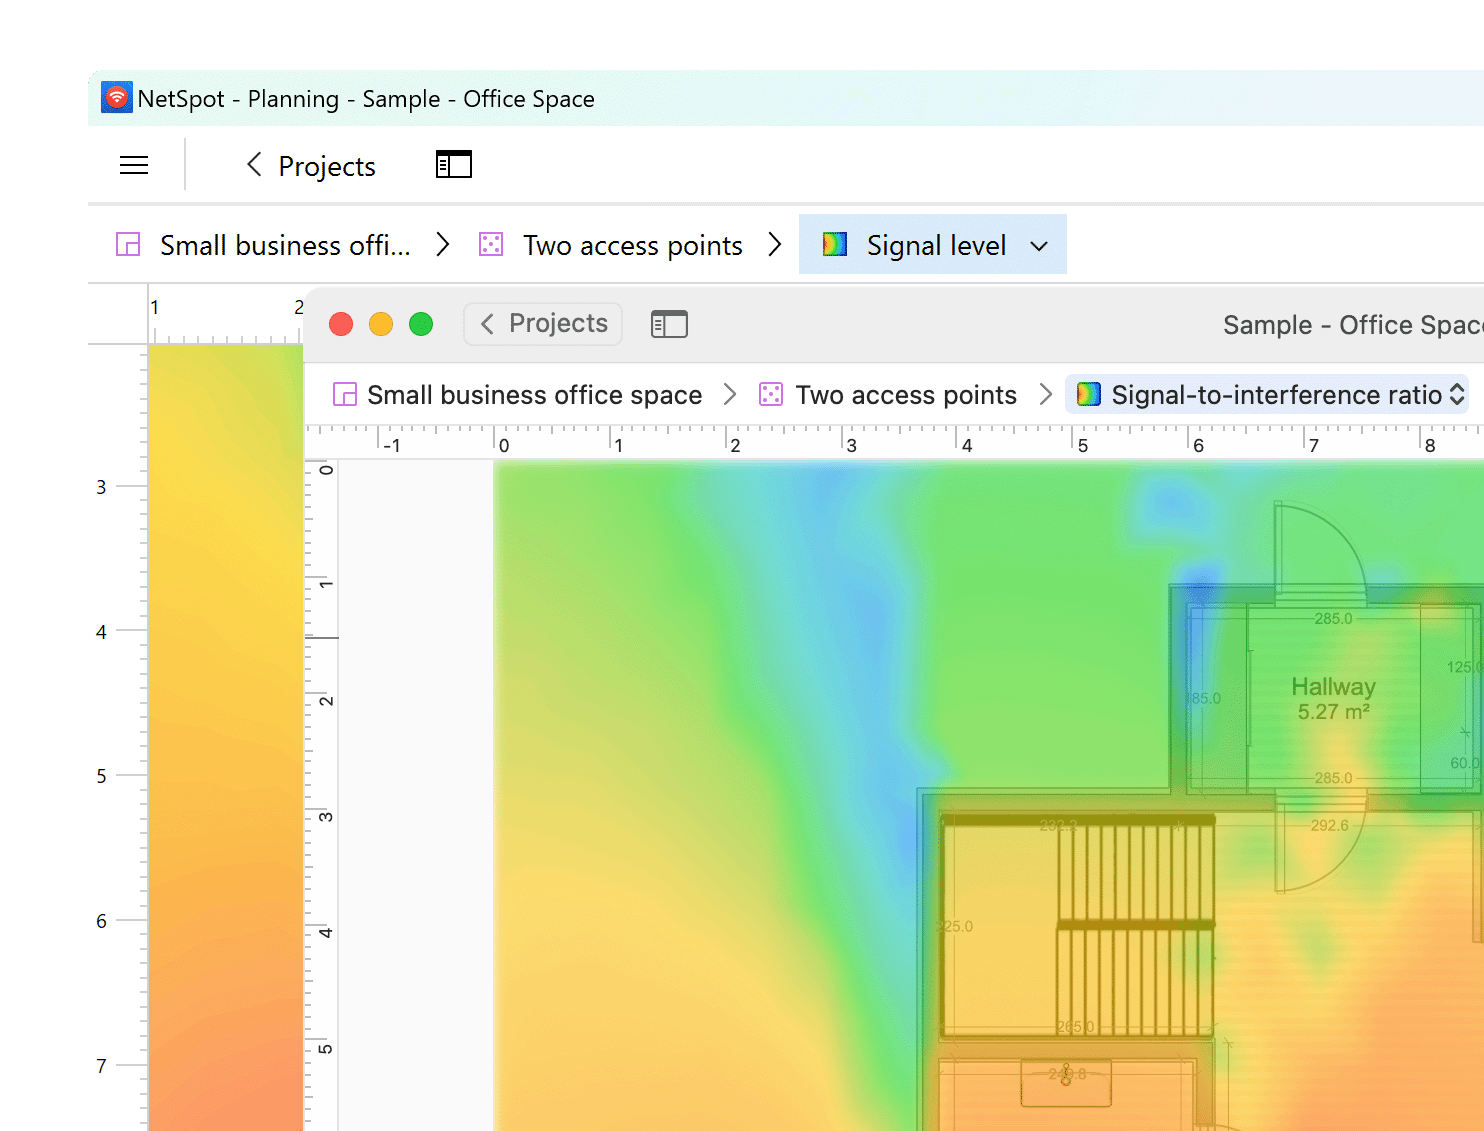
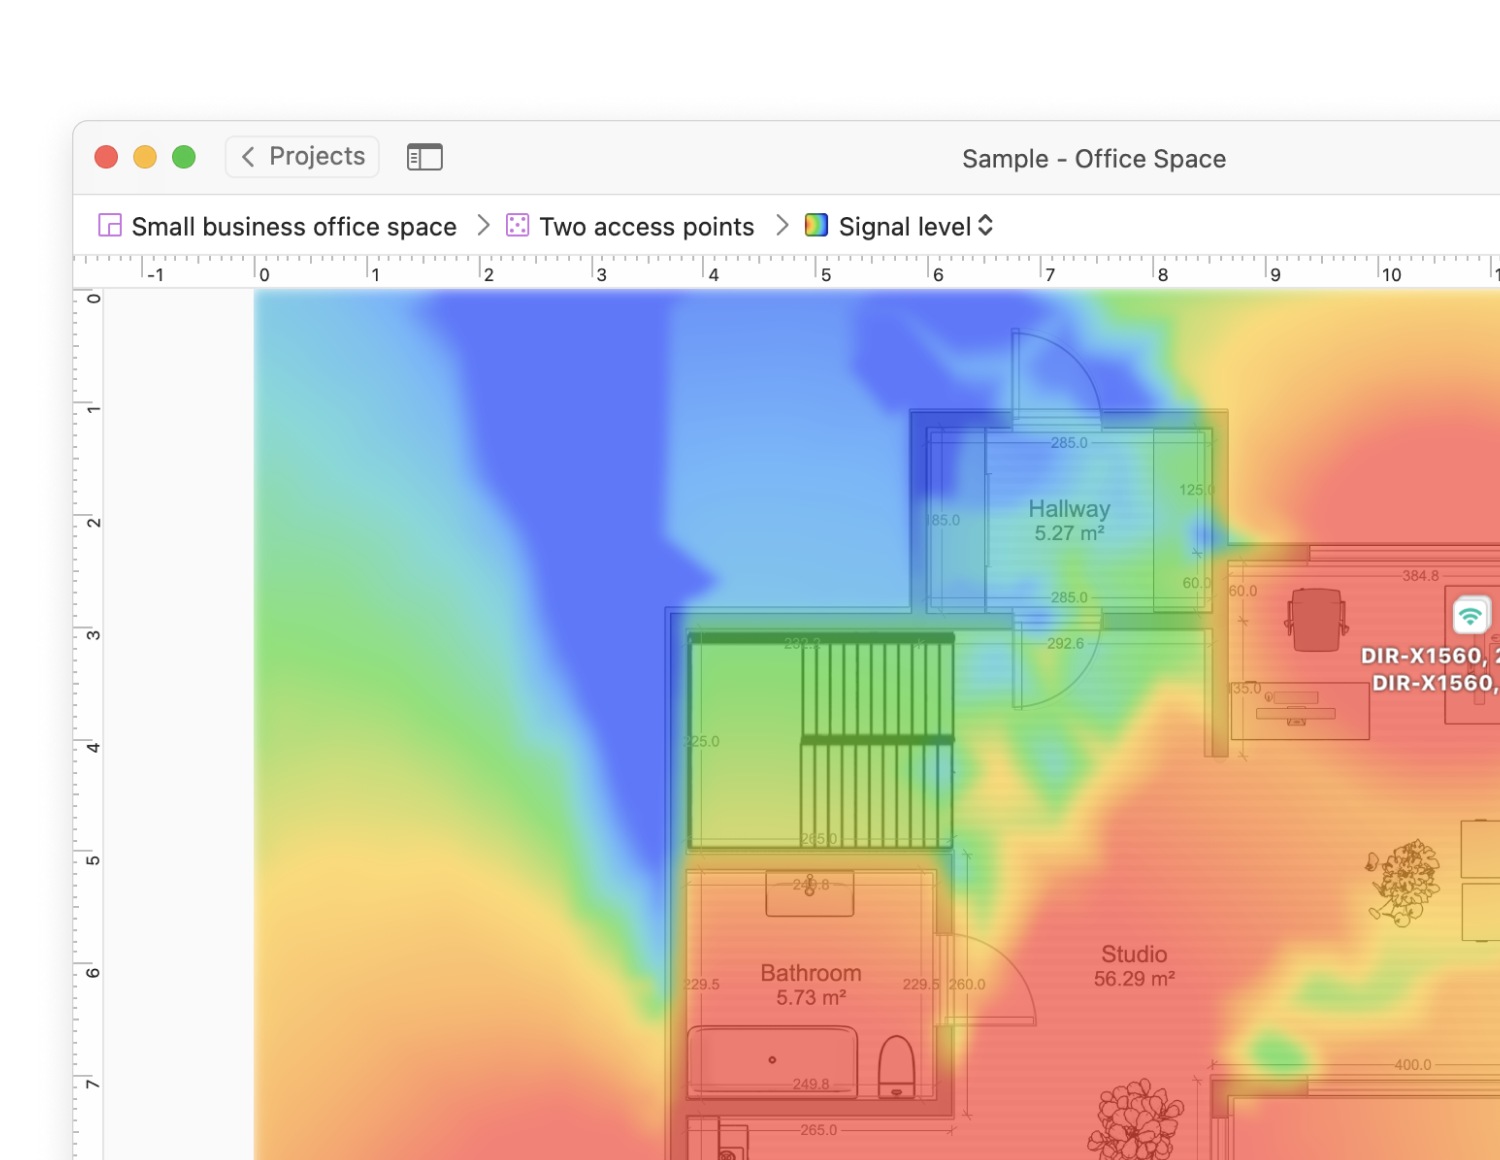
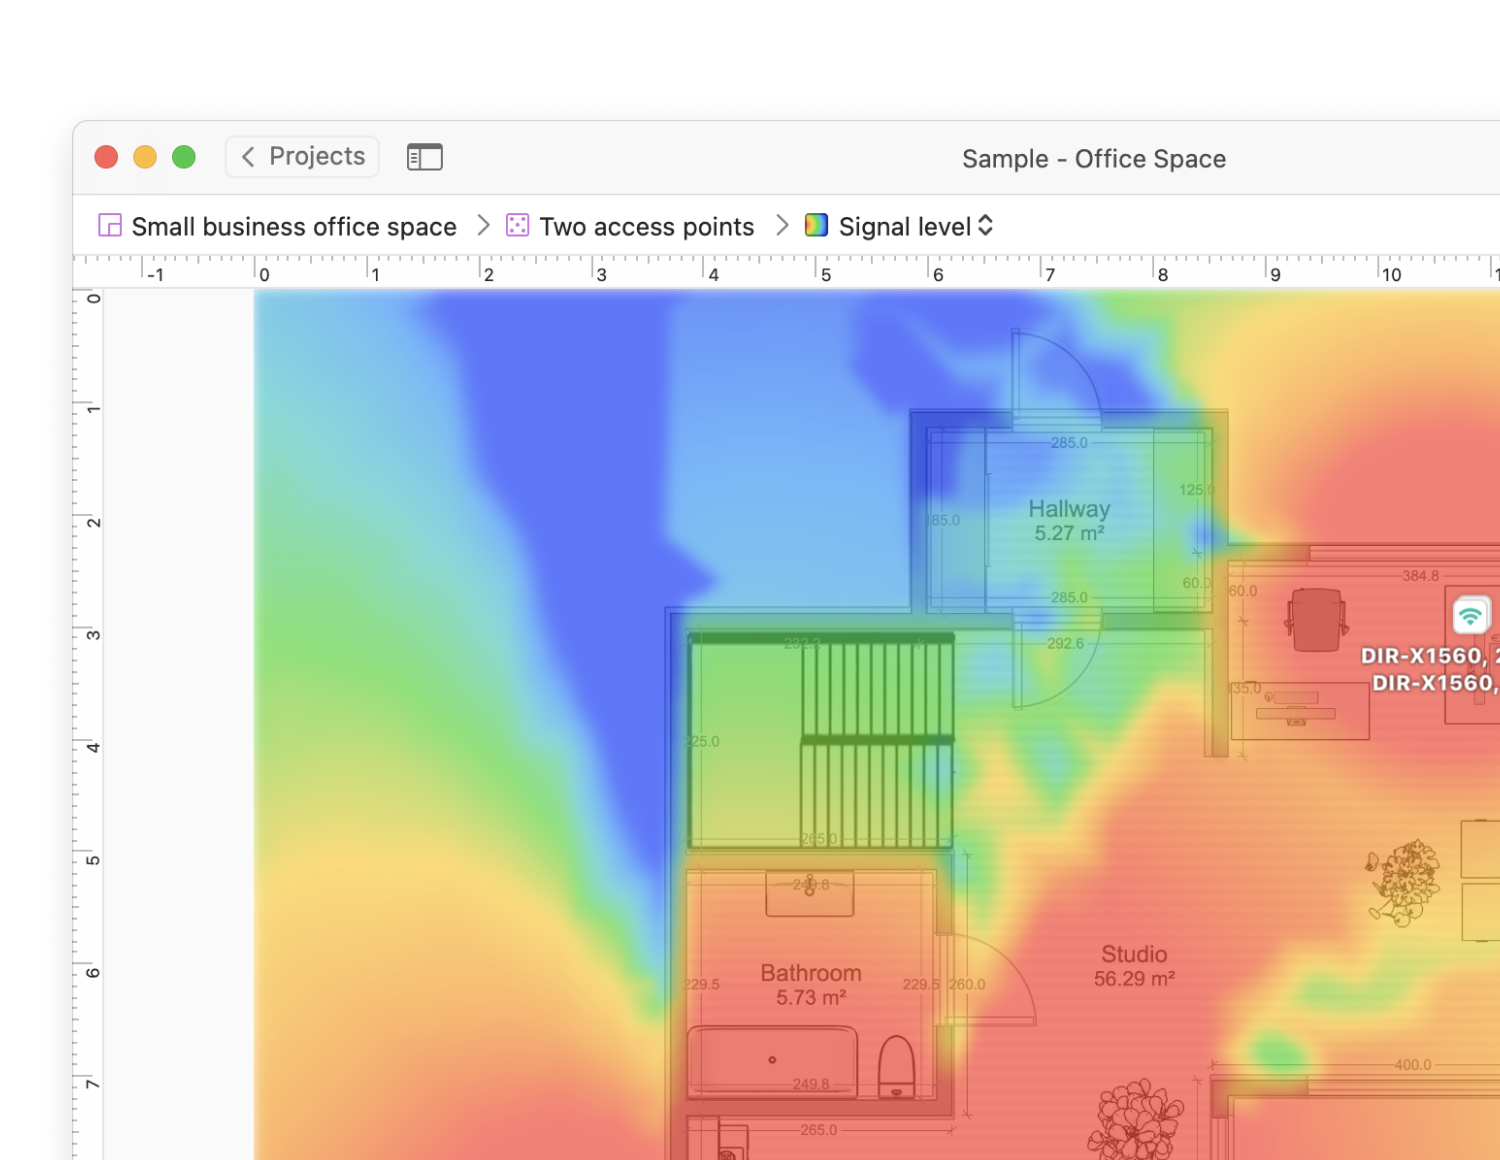
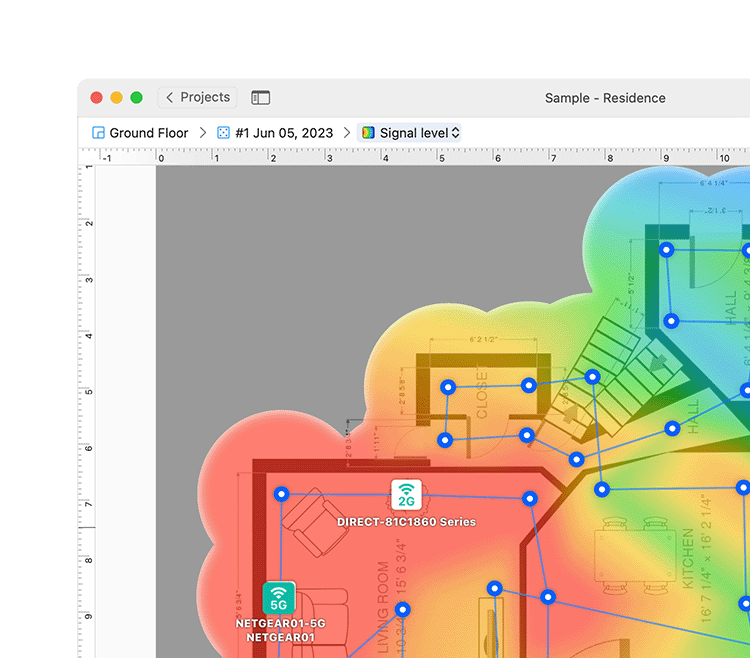
Multiple types of visual heatmaps allow for easy spotting of the dead zones and tweaking the network setup to eliminate them.
Discover NetSpot, the leading WiFi heat map software for Windows & Mac that visualizes your WiFi signal strength, identifies dead zones, and helps optimize network performance. NetSpot streamlines Wi-Fi analysis, troubleshooting, design, and planning.


Get reliable Wi-Fi coverage with NetSpot

Visualize your network in real-time with dynamic, color-coded maps that highlight signal strength, noise levels, and channel overlap.

Drill down into every aspect of your wireless network to identify and resolve dead zones and interference issues quickly.
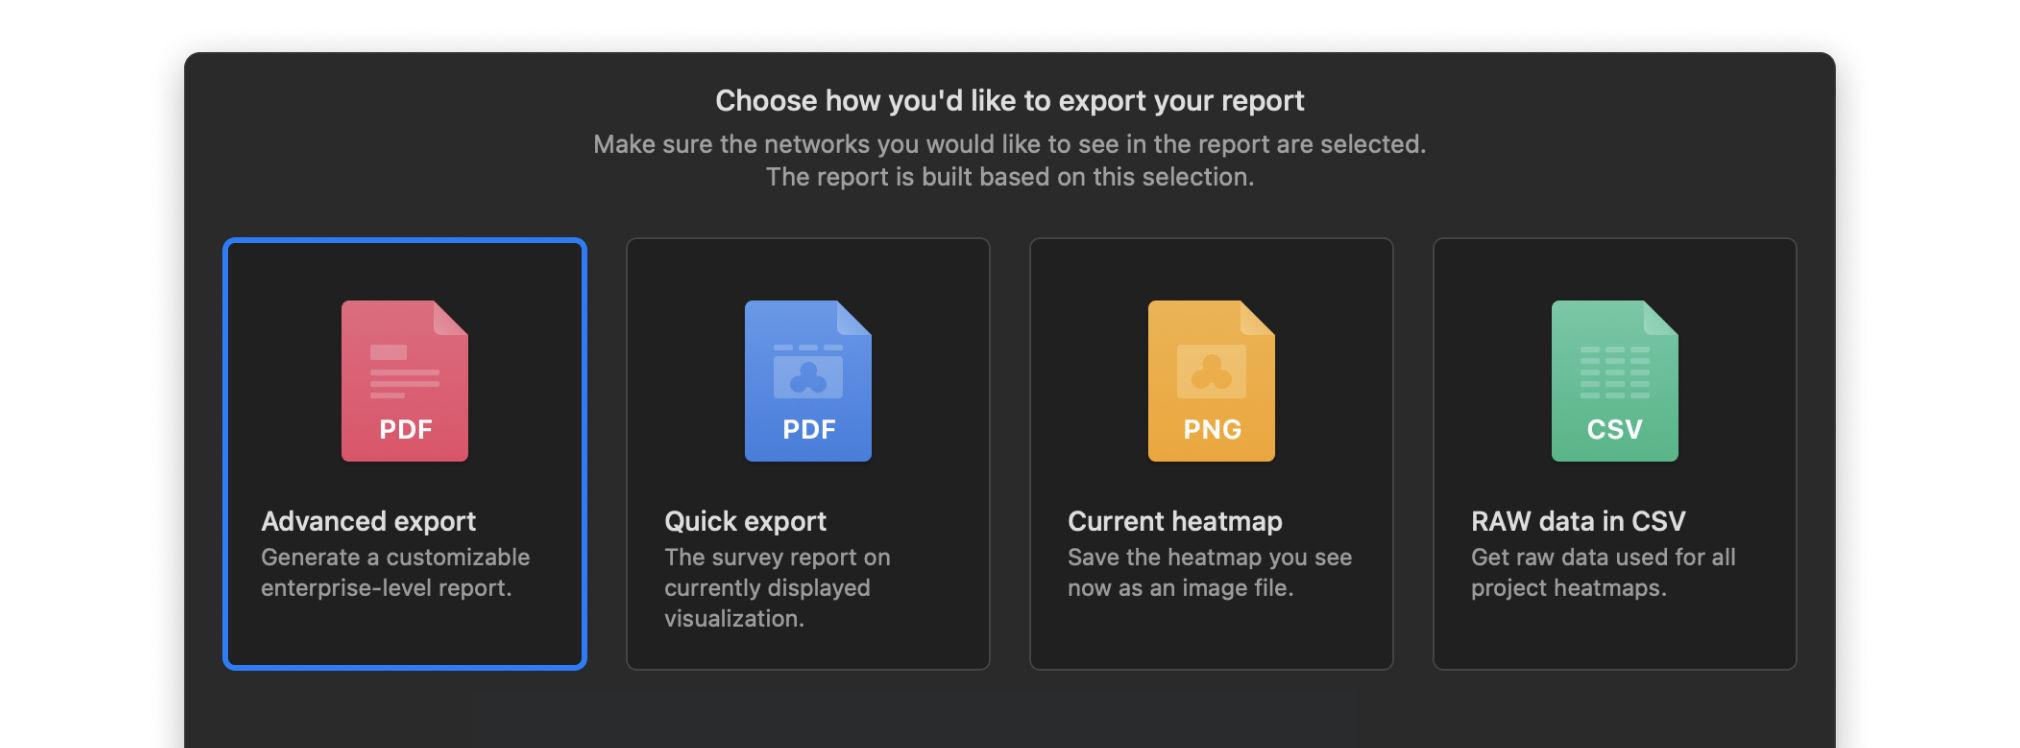
Export your survey project data in PDF or CSV with detailed reports that make it easy to review coverage, compare results, and share findings with your team.

Available on both Mac and Windows, ensuring seamless integration with your existing technology.
With NetSpot, you can effortlessly map your real-life Wi-Fi data to examine every aspect of your network — from signal strength and noise levels to channel overlap and more — allowing you to quickly pinpoint strong signals and dead zones for optimal performance.
We'll walk you through a simple, step-by-step process to measure your signal strength, visualize network coverage, and identify areas for improvement. Whether you're a seasoned IT professional or a home network enthusiast, this guide will equip you with the insights needed to create a detailed Wi-Fi heat map and ensure robust connectivity.
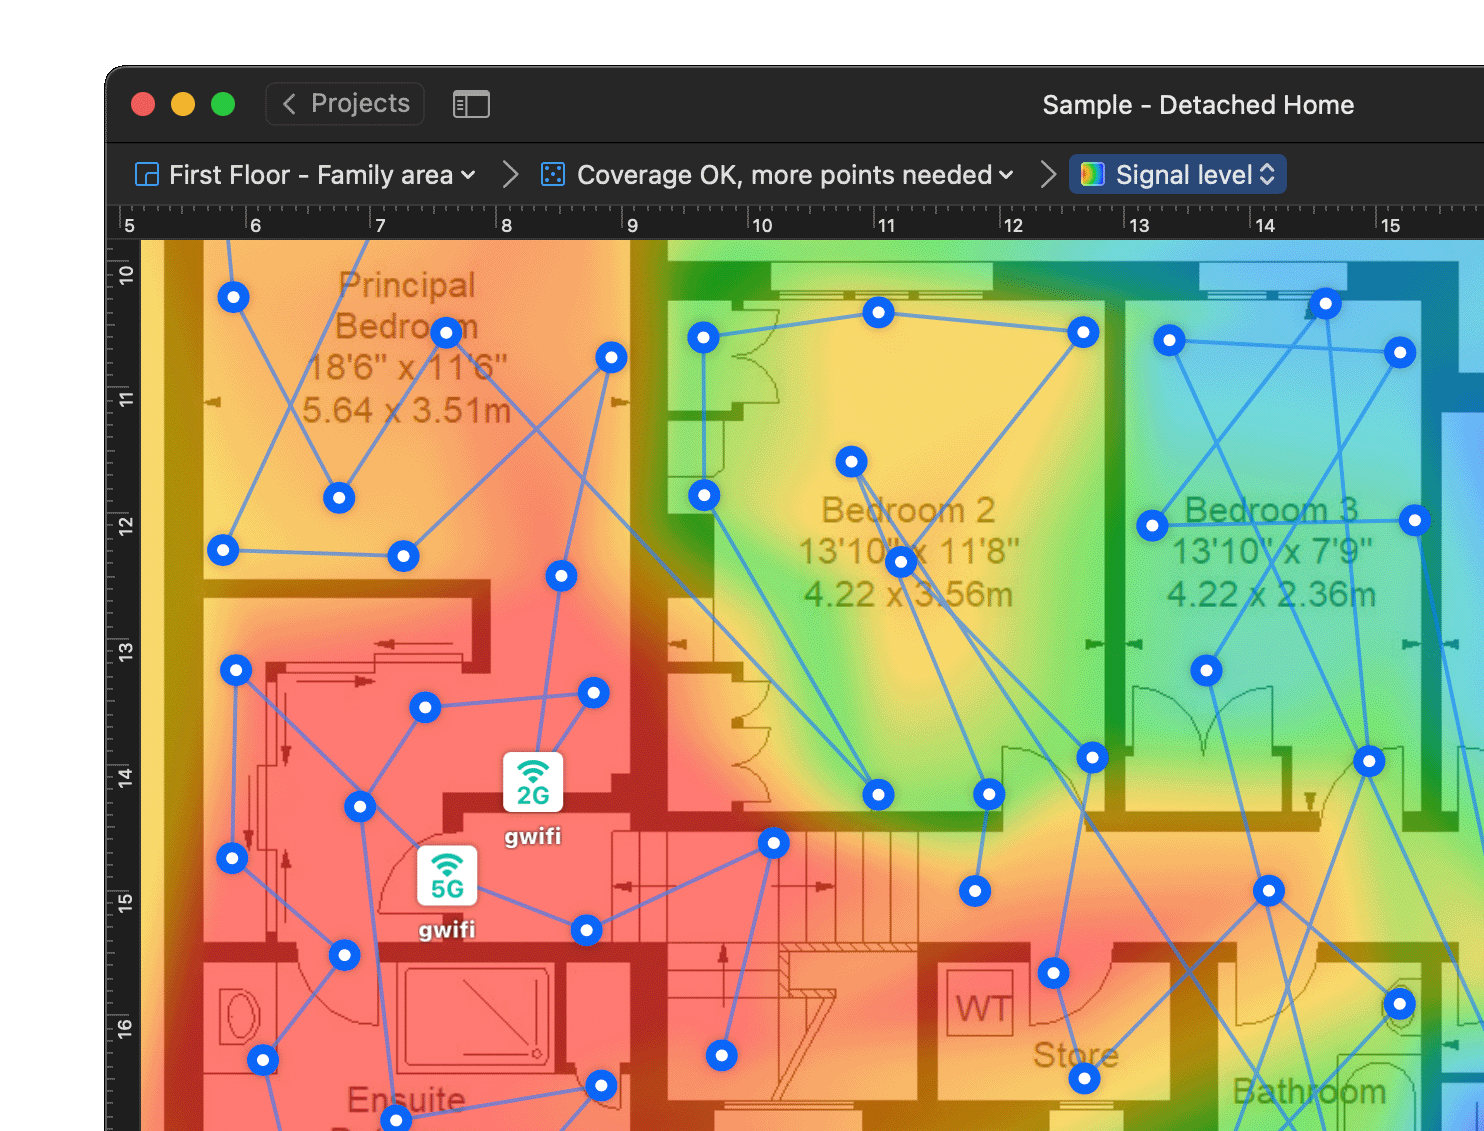
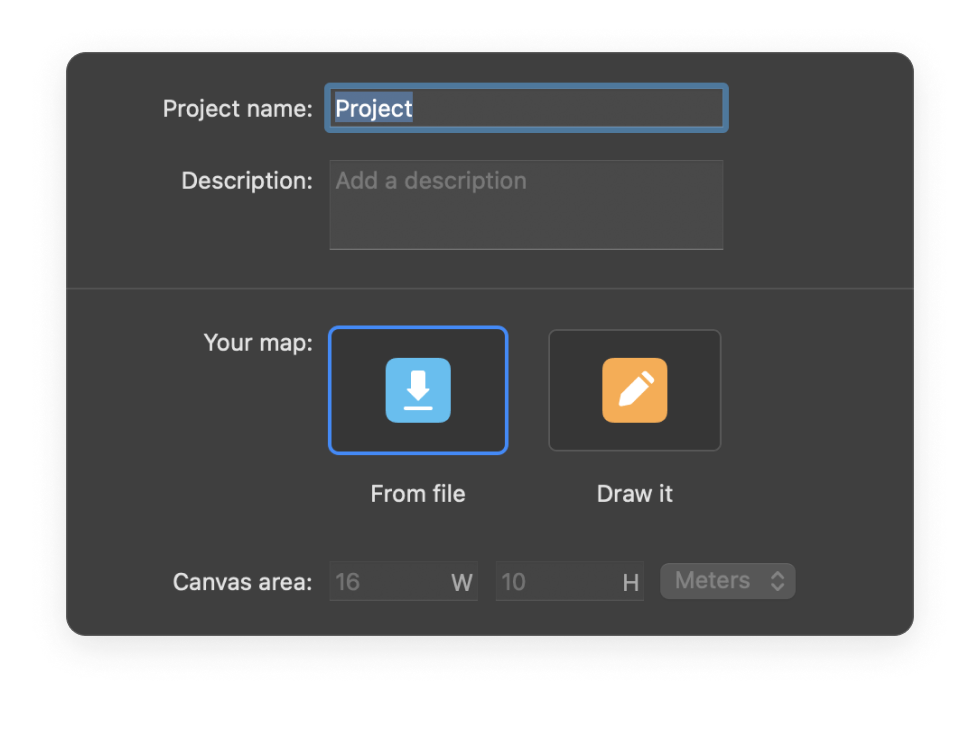
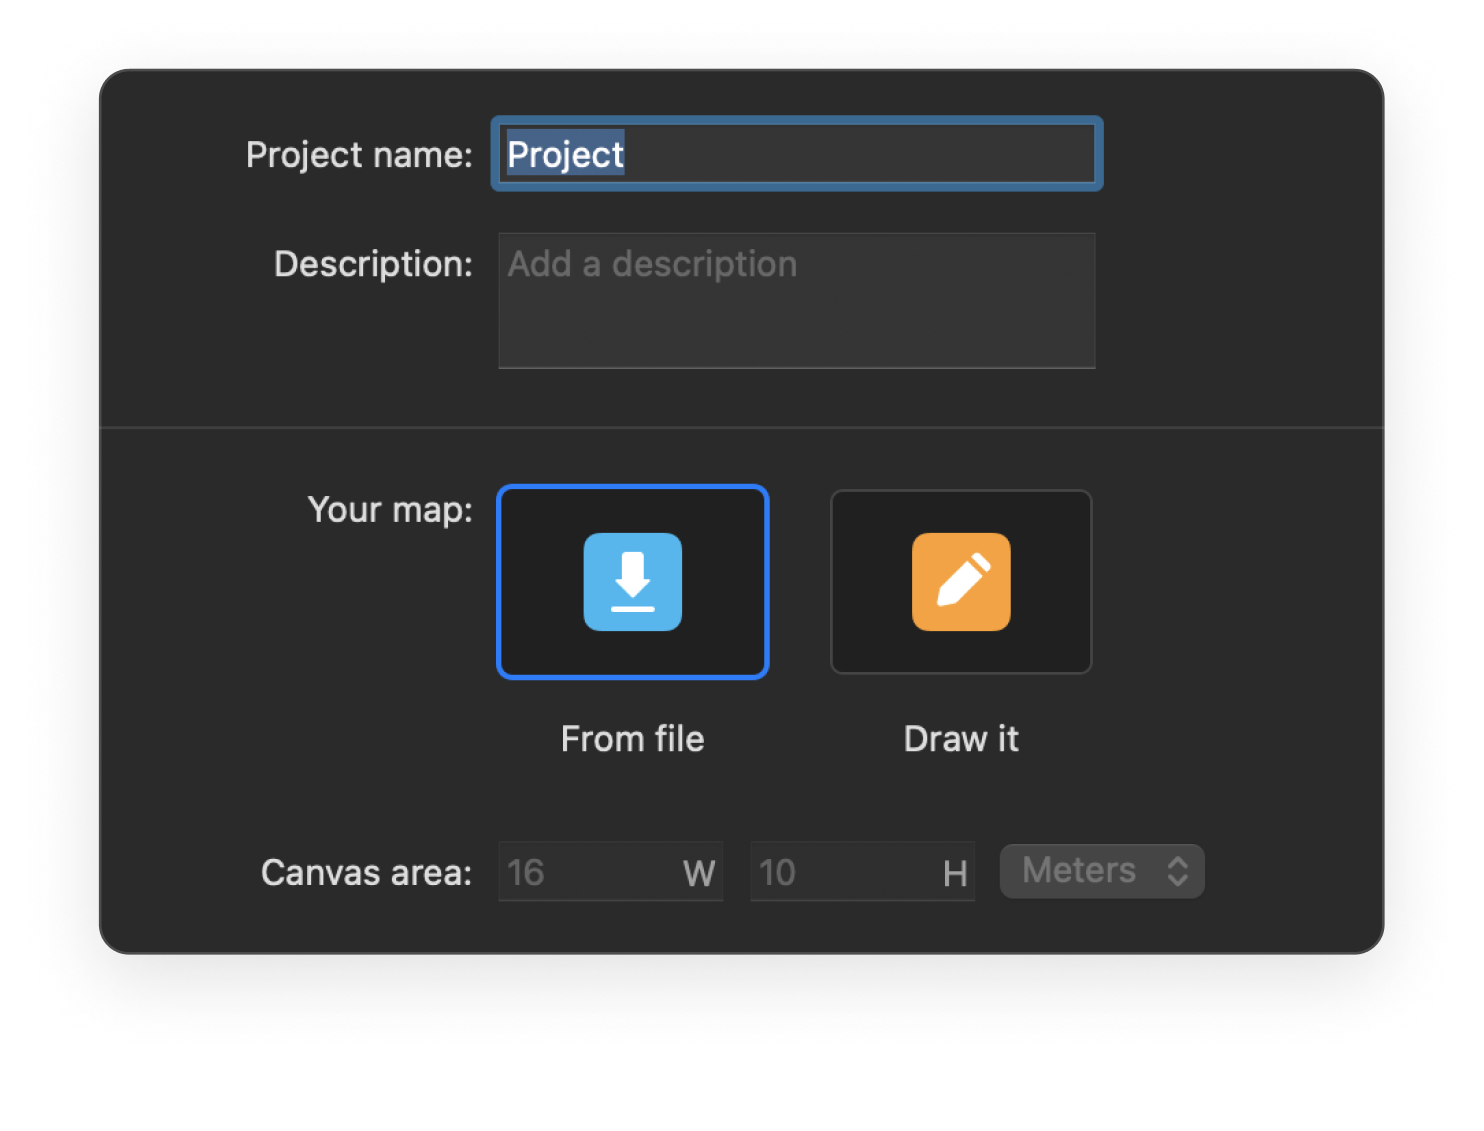
Name your Project and either upload an existing floor plan or draw one.
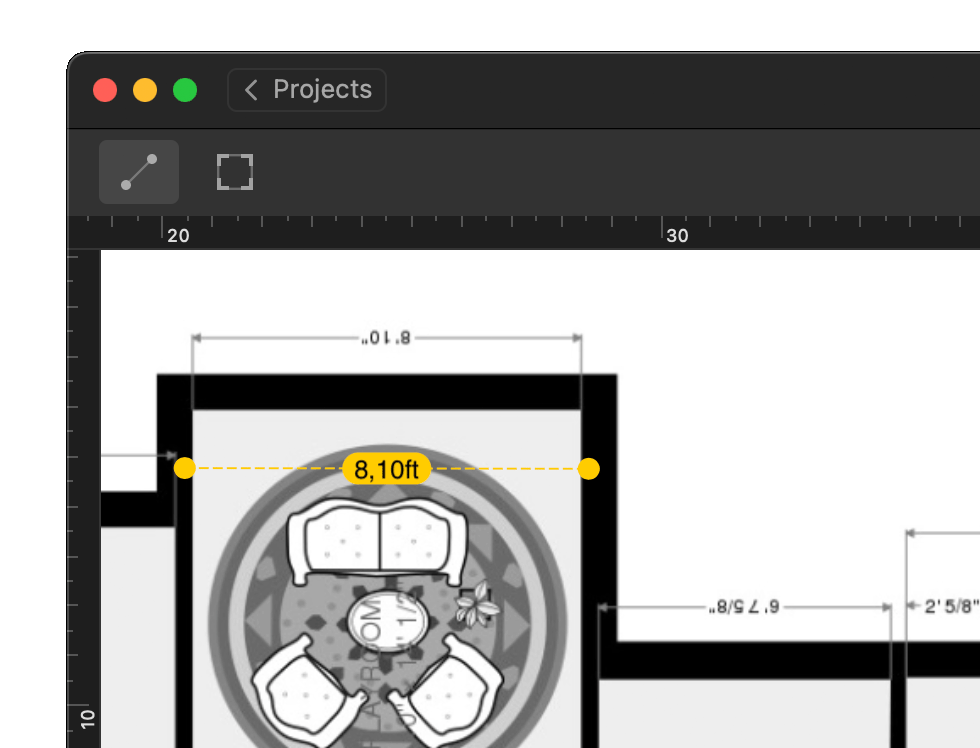
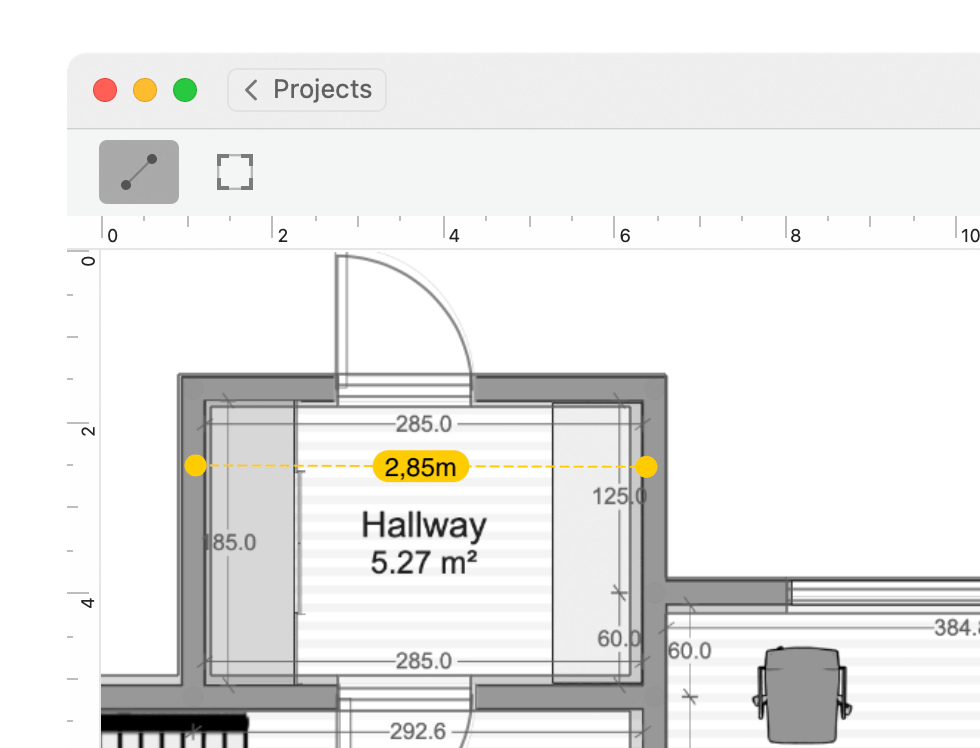
Scale your map so that NetSpot understands how large the surveyed area is.
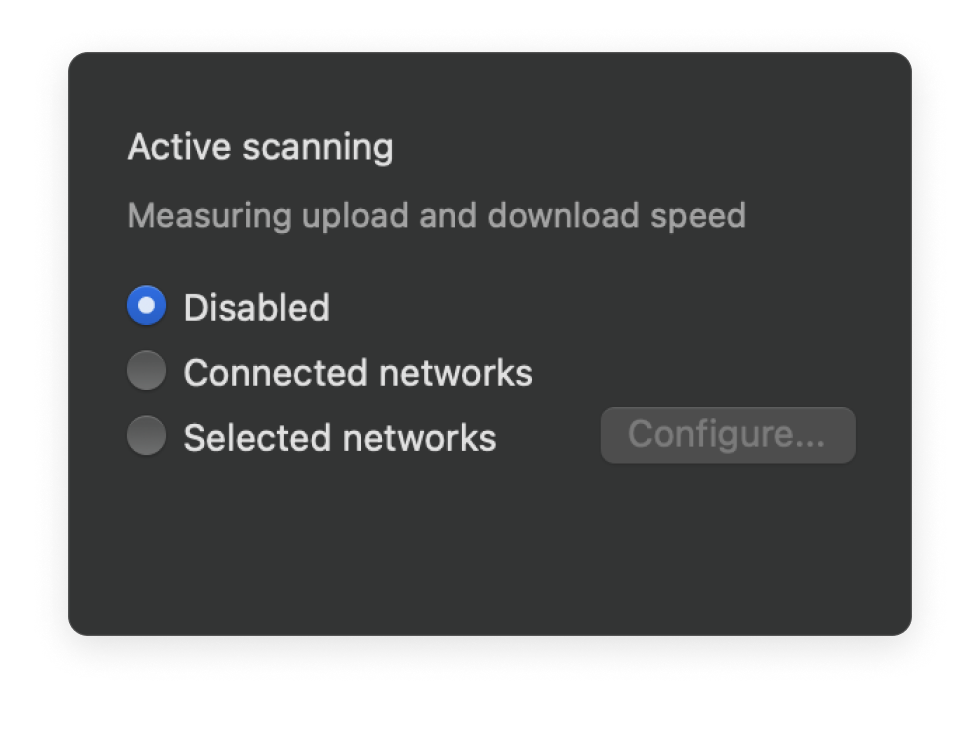
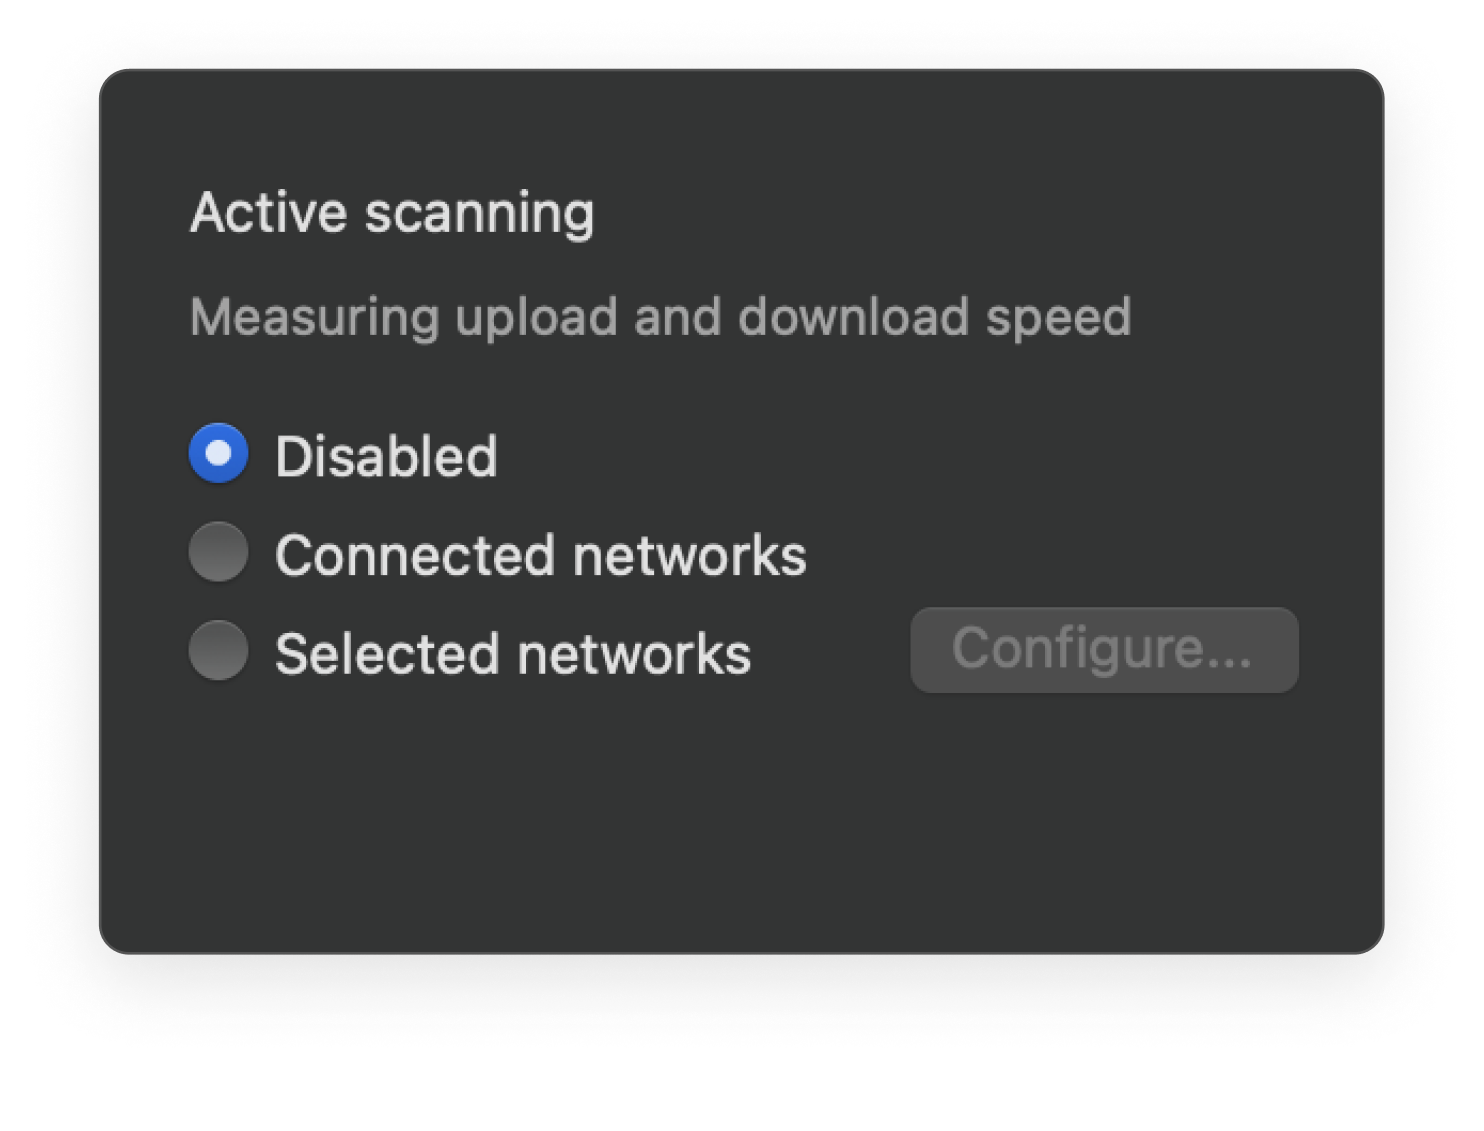
Use the Active Scan feature to measure your network's Internet connection speed for the most exhaustive survey report.
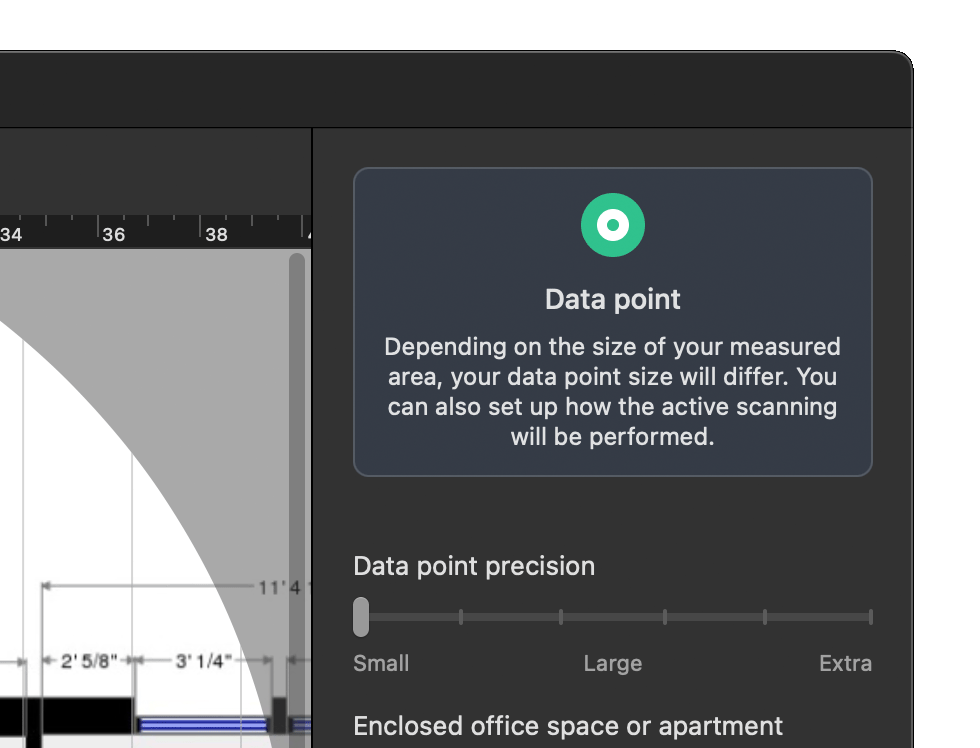
Determine the distance between sampling points during your survey for an accurate heatmap.
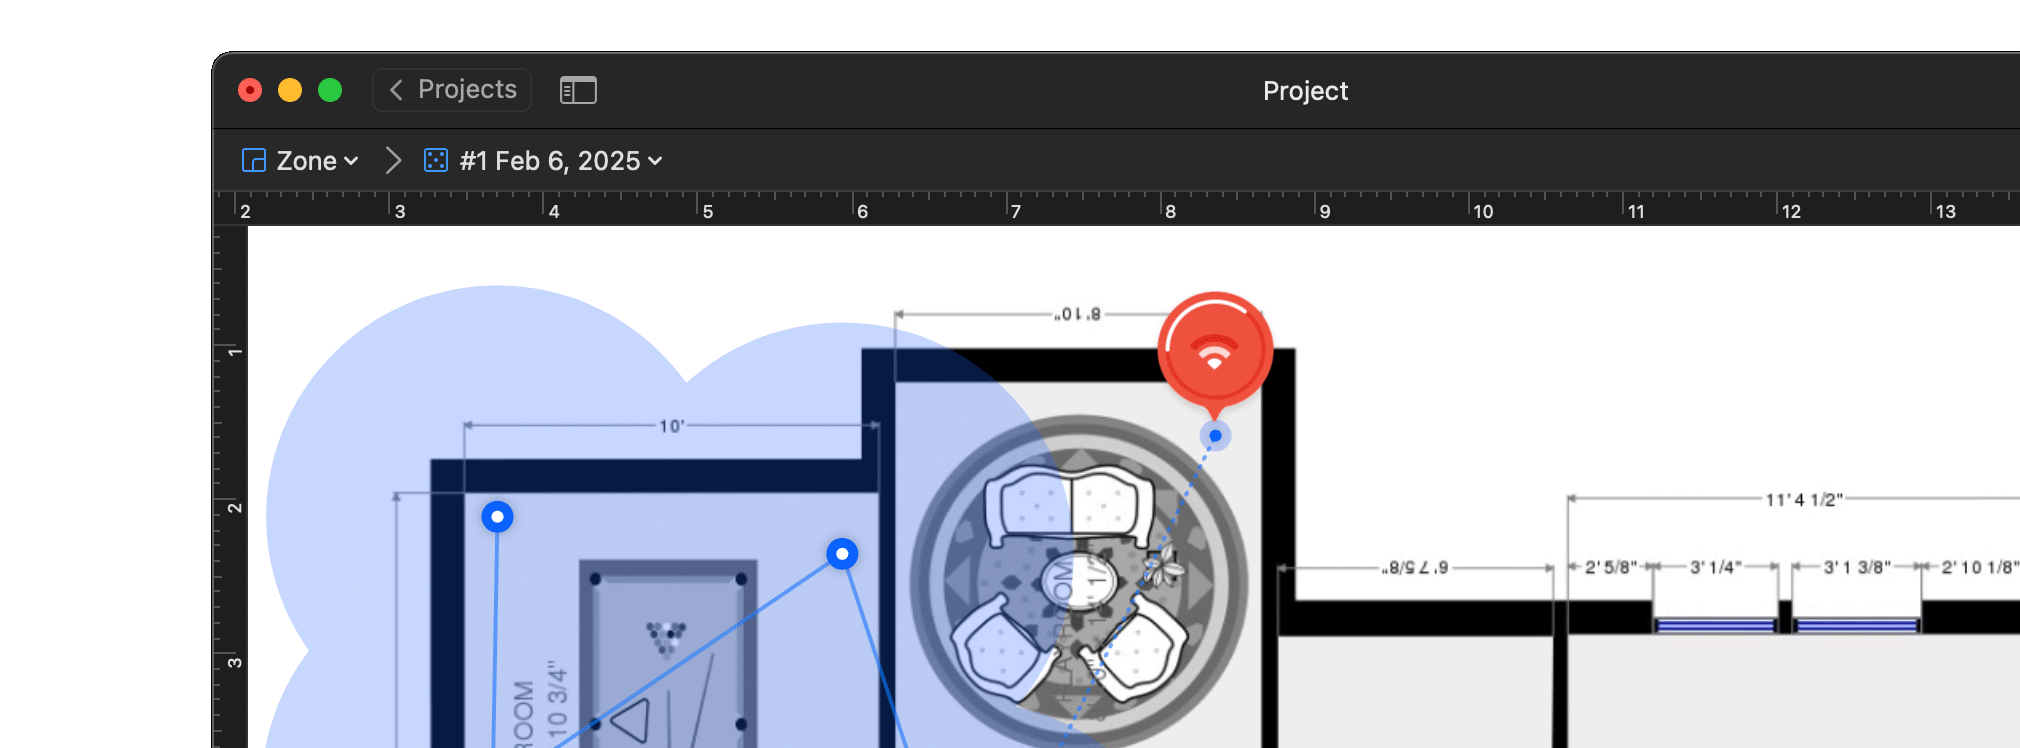
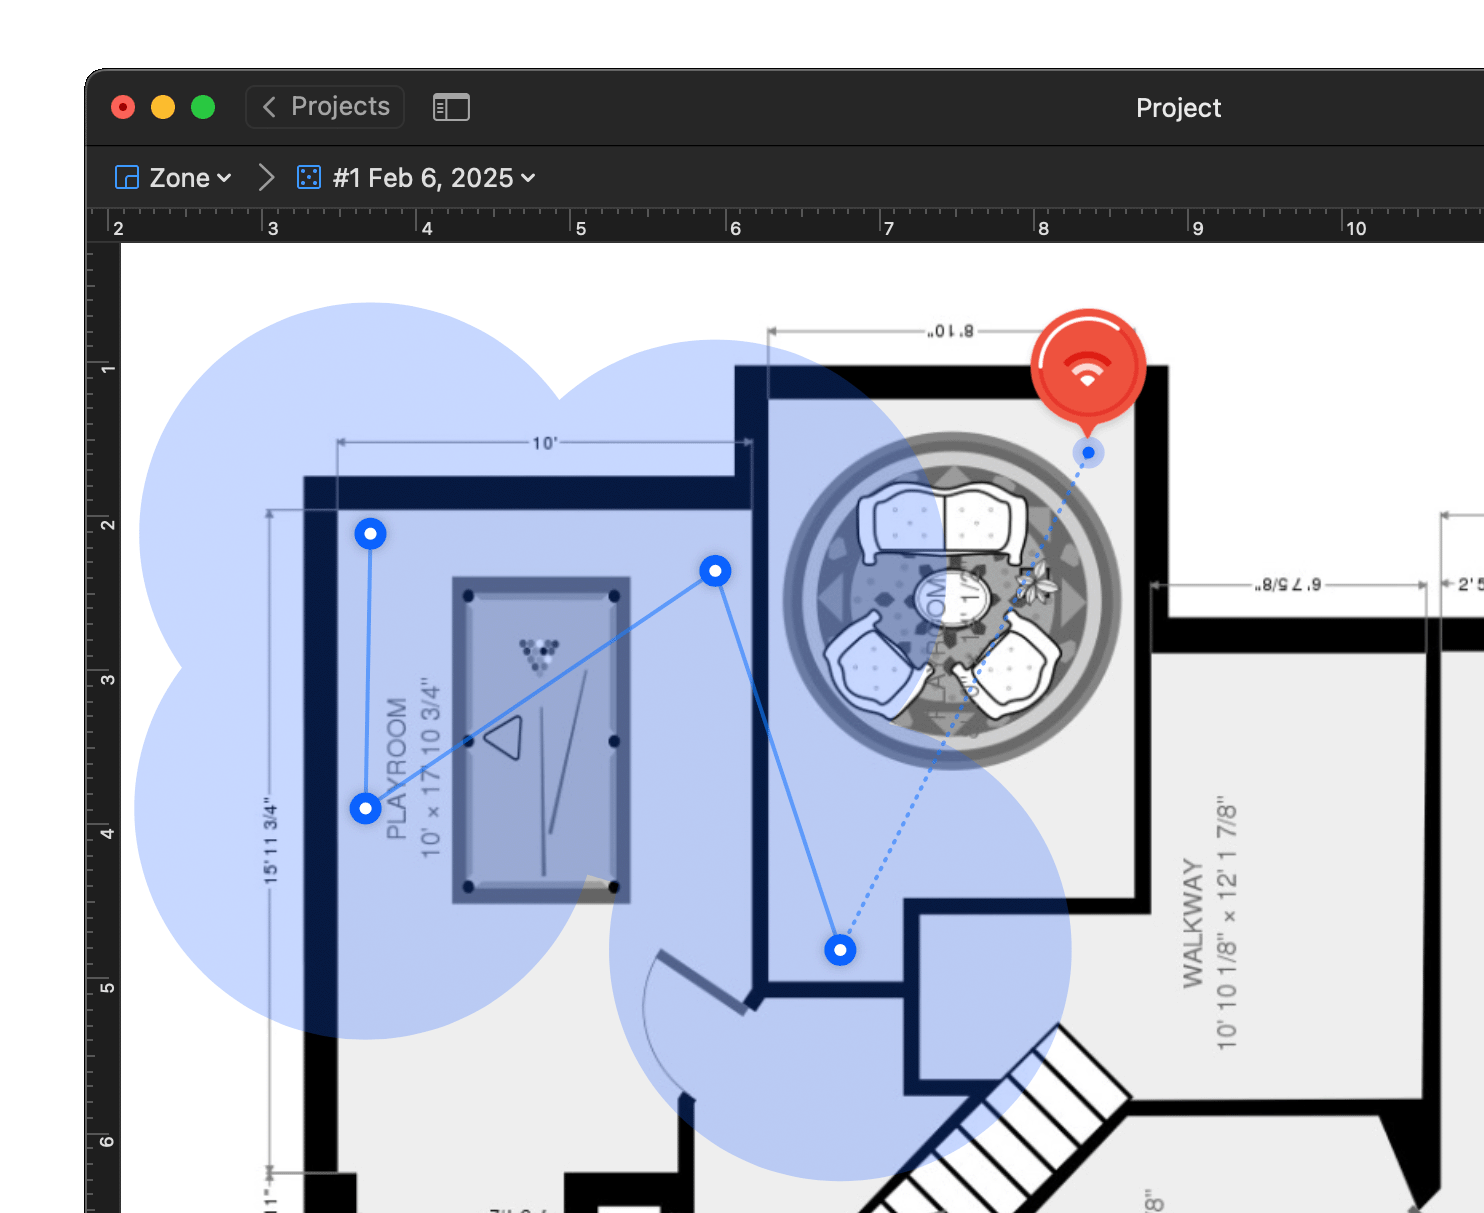
Move from one area to the next until the entire map is covered. Take as many measurements as you can to get more accurate data.
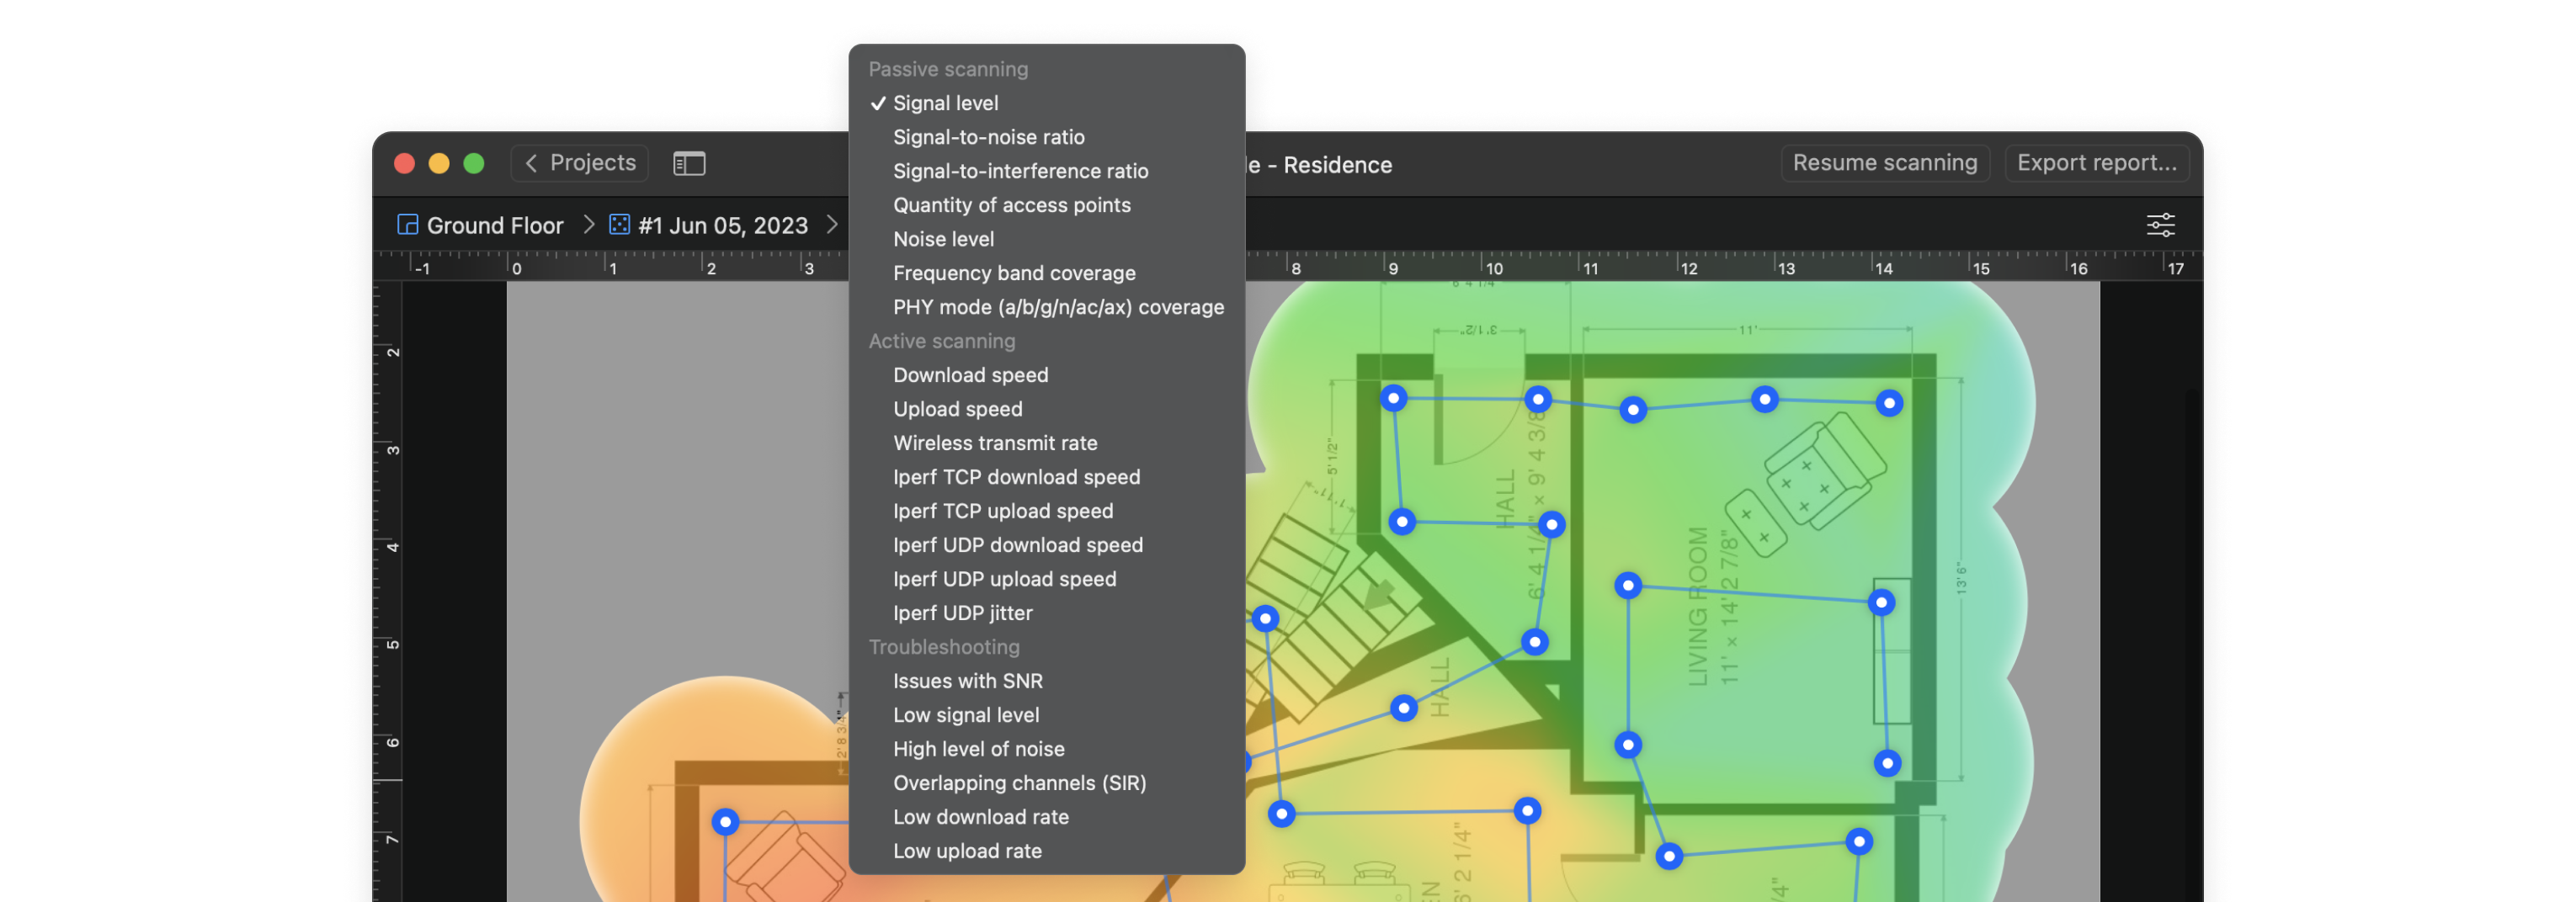
Interactive heatmaps with detailed information on all surveyed wireless networks in every point of the map. NetSpot offers more than 20 heatmap visualizations that help troubleshoot and manage any Wi-Fi setup. By helping analyze every access point, NetSpot can scale up from useful-to-everyone to incredibly detailed for the true wireless networking mavens.
Export your WiFi site survey reports into one of the convenient formats and share them with others. Export to PDF or CSV is available.
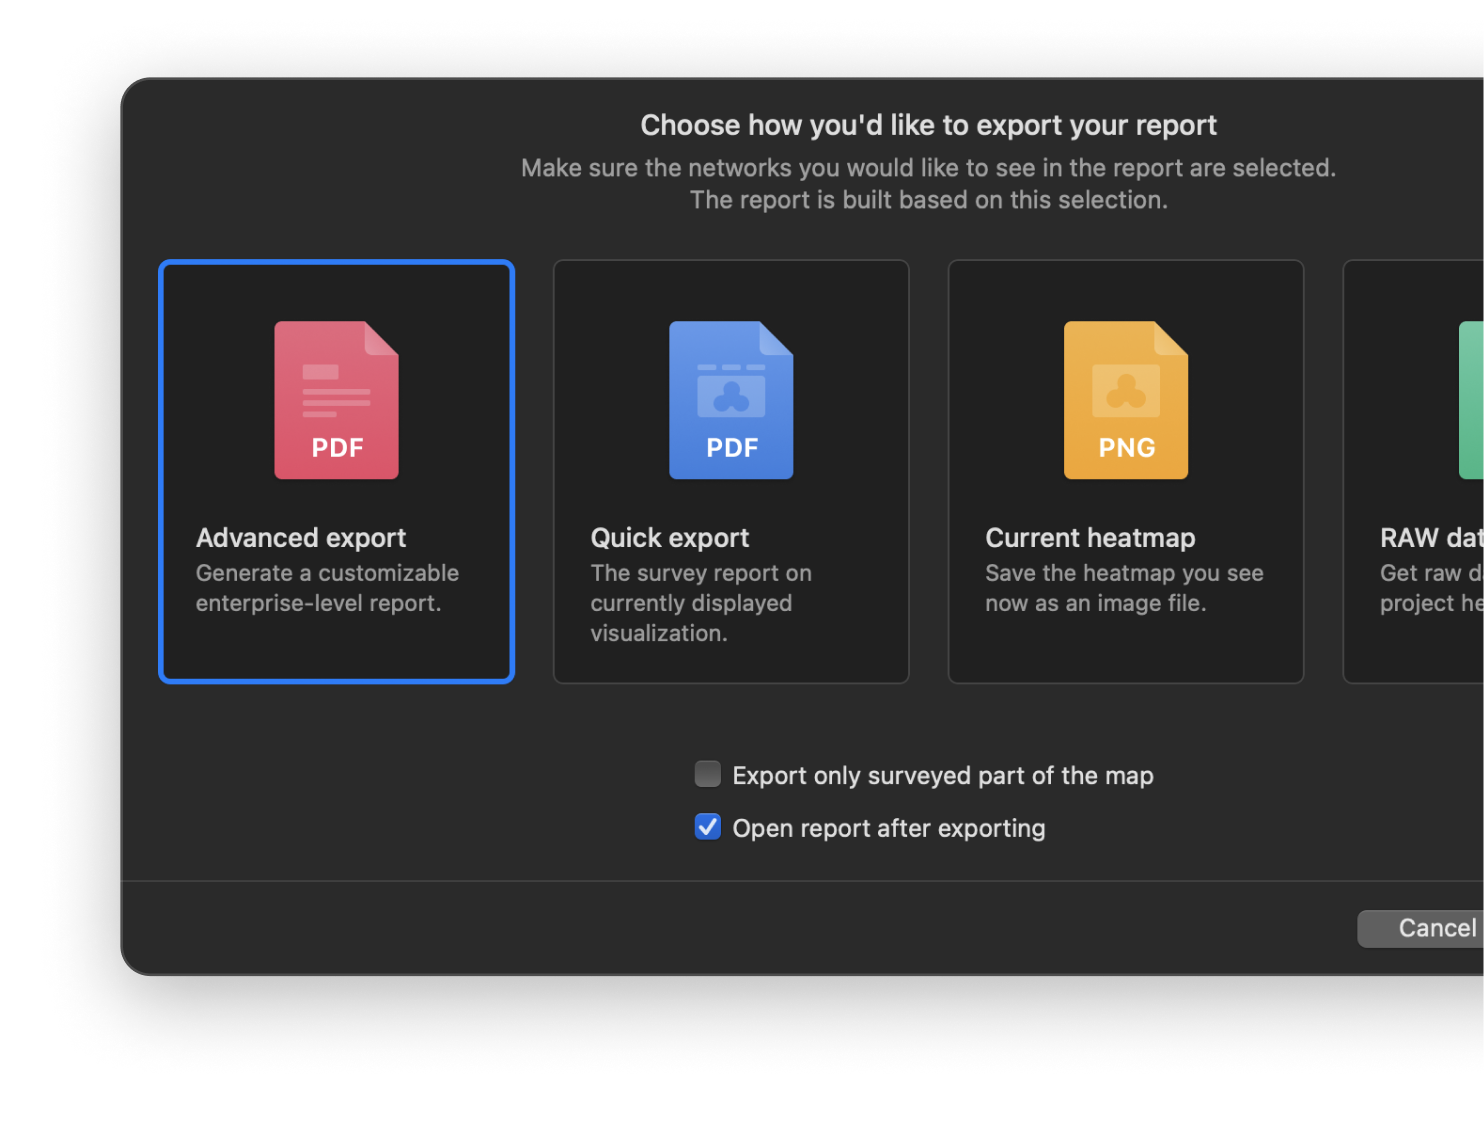
Locate the “dead zones”, determine sources of interference, and more.
Multiple types of visual heatmaps allow for easy spotting of the dead zones and tweaking the network setup to eliminate them.
Absolutely no equipment is needed except for your computer or laptop with NetSpot on board to estimate the number of access points the network will need for a smooth and even coverage.
Create predictive heatmaps to ensure optimal placement of your virtual routers. Simply drag your access points to new positions and watch the heatmap update instantly, allowing you to fine-tune your setup for the best performance.
Load the image of your surveyed space and scale the map — indicate the real distance between two known points.
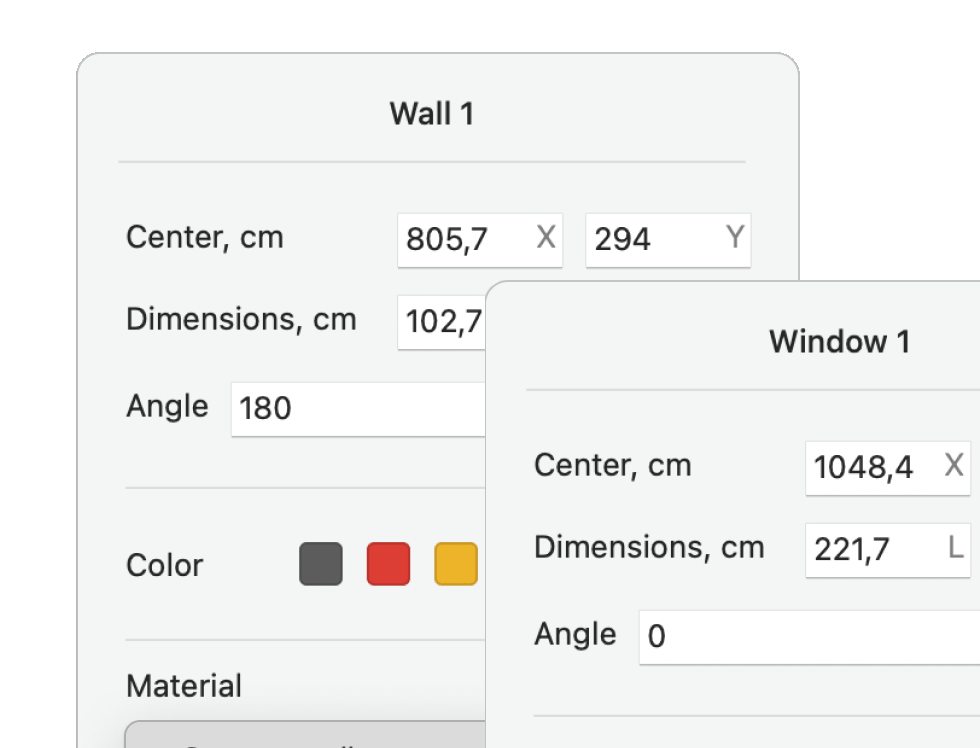
Add walls, windows, and doors of your space, and select building materials to simulate how they will impact your WiFi signal.
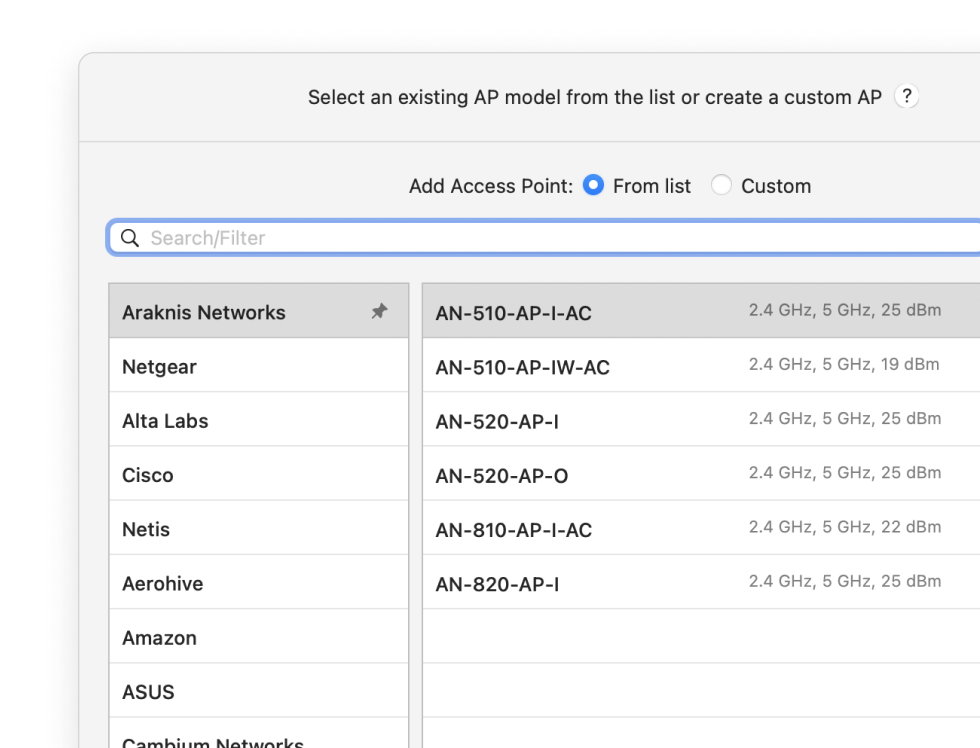
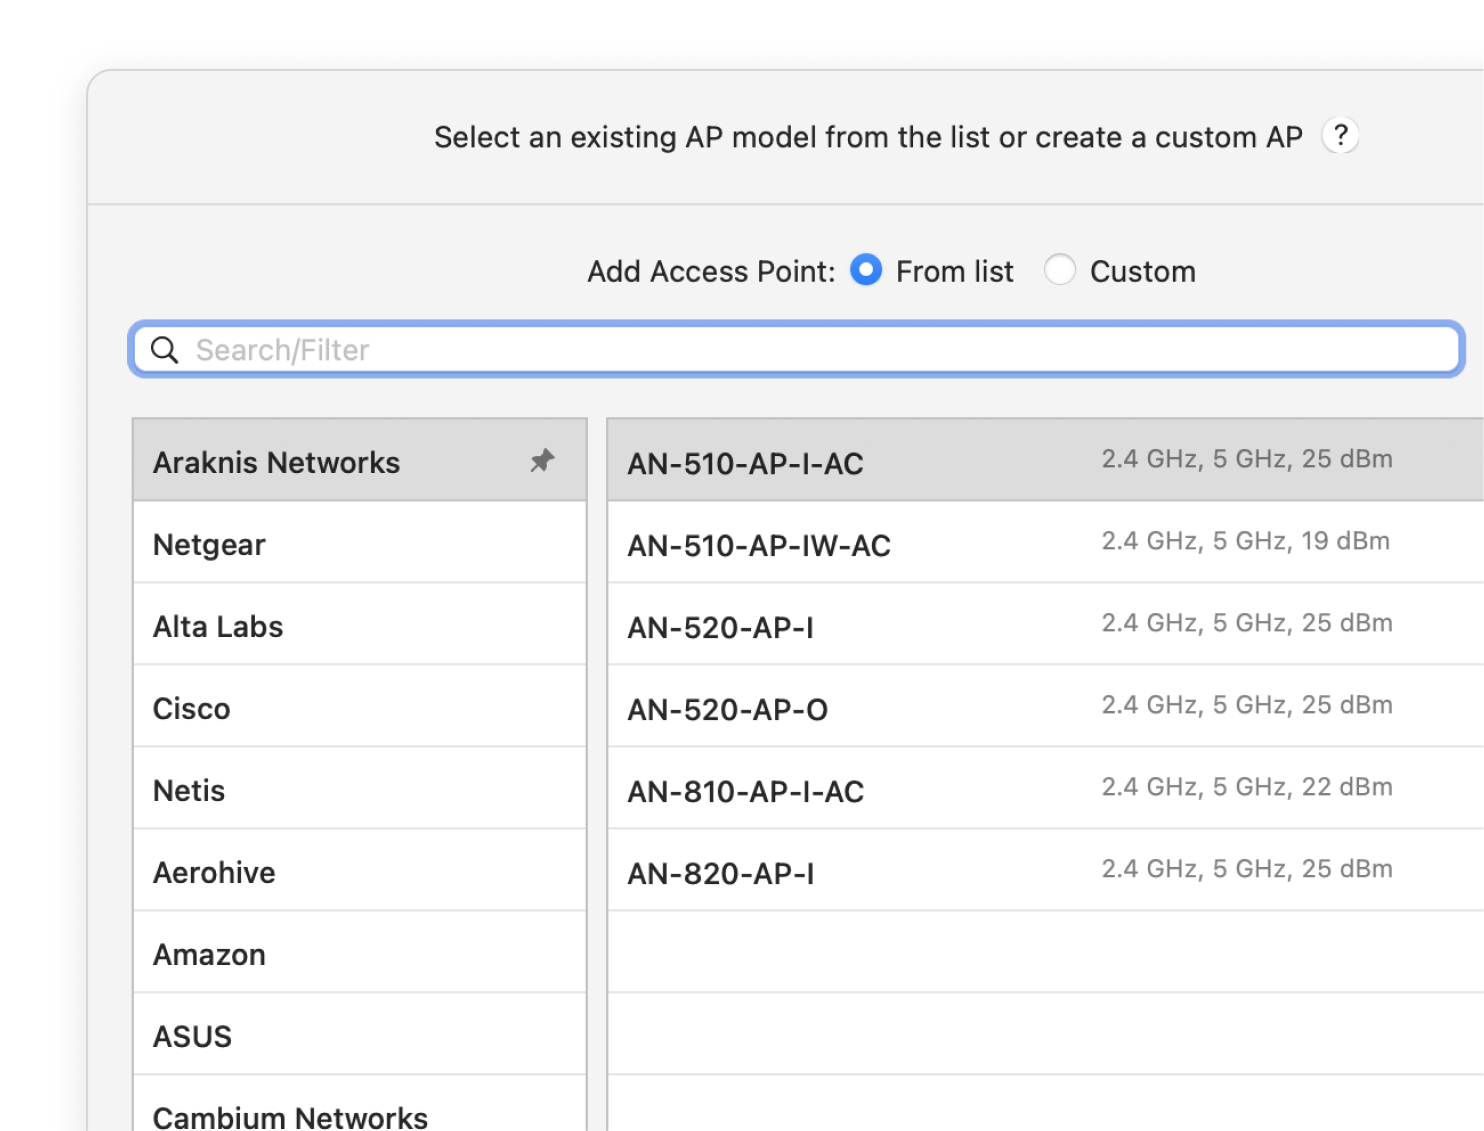
Select a AP model you are planning to utilize from an extensive list in the app.
Map out your space to create and analyze various visualizations for your future wireless coverage.
A WiFi network from scratch, well-built right away? That is easy with NetSpot! We have all the necessary tools ready for you!
A WiFi heatmap is a visual representation of wireless signal distribution, typically showing signal strength using a color-coded approach, with the color red representing areas with a strong signal and the color blue representing areas with a weak signal.
Because WiFi heatmaps can show wireless signal strength and other parameters across an entire area all at once, they make troubleshooting of various WiFi issues, such as connection drops, high latency, and data transfer speed fluctuations much easier than static measurements taken from a single place.
Besides troubleshooting WiFi issues, WiFi heatmaps also come in handy when setting up a wireless router because they make it easy to see which specific areas have a strong signal and which don’t, helping you determine a more suitable place for your router and revealing potential sources of signal interference, such as walls, furniture, large appliances, and all kinds of wireless devices.
More about Wi-Fi Heat maps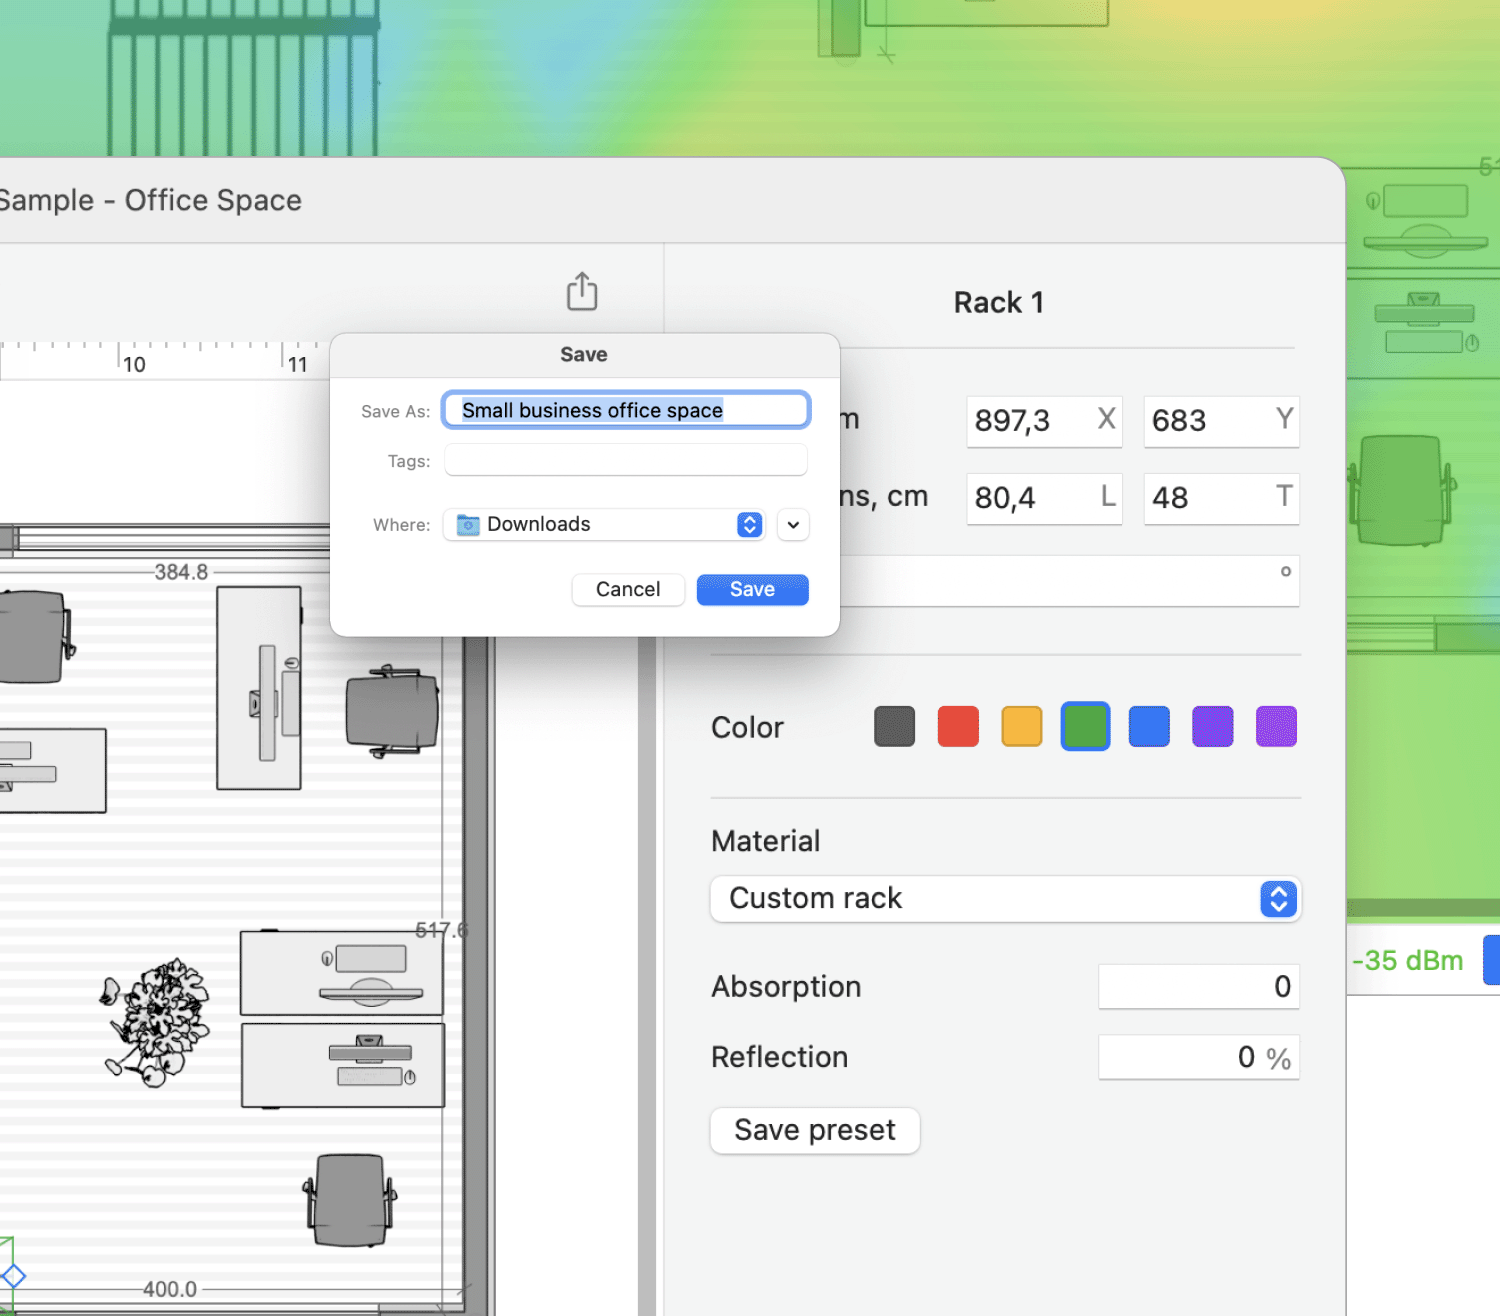
NetSpot is the ultimate solution for creating accurate WiFi heatmaps, helping you optimize coverage, reduce interference, and enhance network performance with ease.
In this section we'll do our best to answer your most frequent questions about making a perfect wireless network
To map your WiFi signal, you need to equip yourself with one of the best WiFi heatmapper apps and use it to methodically take measurements at different locations until you’ve surveyed the entire area that you want to cover by a WiFi signal. Your WiFi mapper will then automatically turn the measurements into a color-coded map.
You can check the range of your WiFi by creating a WiFi heatmap of your area. That way, you’ll be able to clearly see where the signal is the strongest and weakest. A WiFi heatmap can also reveal signal strength-degrading obstacles and sources of interference, making it far more comprehensive and informative than point-in-place measurements.
A WiFi heatmap is a highly useful tool for assessing and improving the performance of a wireless network, allowing you to:
If you're looking for an easy solution that doesn’t require extra hardware or training, NetSpot is a good choice. It works on both Mac and Windows and lets you create Wi-Fi heatmaps using your laptop’s built-in Wi-Fi adapter.
What do the pros use? Choosing the right software often depends on your specific environment and needs. To see how NetSpot compares to other tools and what IT professionals are saying, check out this Wi-Fi heatmapping tools that you use in real life forum thread.
Join the discussion! We’d love to hear about your experience.

If your equipment is already in place, I recommend using NetSpot on Windows PCs and Macs.

The visuals it generates are an absolutely invaluable tool if you want to geek out hard and get the most out of your Wi-Fi coverage.

NetSpot is top drawer. You won't find a better app for figuring out why your Wi-Fi isn't working the way you need it to. And it will help you plan for new networks and reconfigure your existing network.
Runs on a MacBook (macOS 11+) or any laptop (Windows 7/8/10/11) with a standard 802.11be/ax/ac/n/g/a/b wireless network adapter. Read more about the 802.11be support here.
Your projects are cross-platform and can be opened in NetSpot for macOS, Windows, and Android.