Please note: this visualization is only available to Home, PRO and Enterprise users. Currently, there is no possibility to properly measure noise levels on Windows computers and Android phones, this data can be collected on certain macOS computers only. If a project with SNR heatmap was created on a macOS computer, it can be opened and analyzed on a Windows computer or on an Android device.
The signal-to-noise ratio (SNR) compares the level of the Wi-FI signal to the level of background noise. Sources of noise can include microwave ovens, cordless phones, Bluetooth devices, wireless video cameras, wireless game controllers, fluorescent lights, and more. Note that “noise” does not include co-channel interference from other radio transmitters — that is shown in the signal-to-interference ratio.
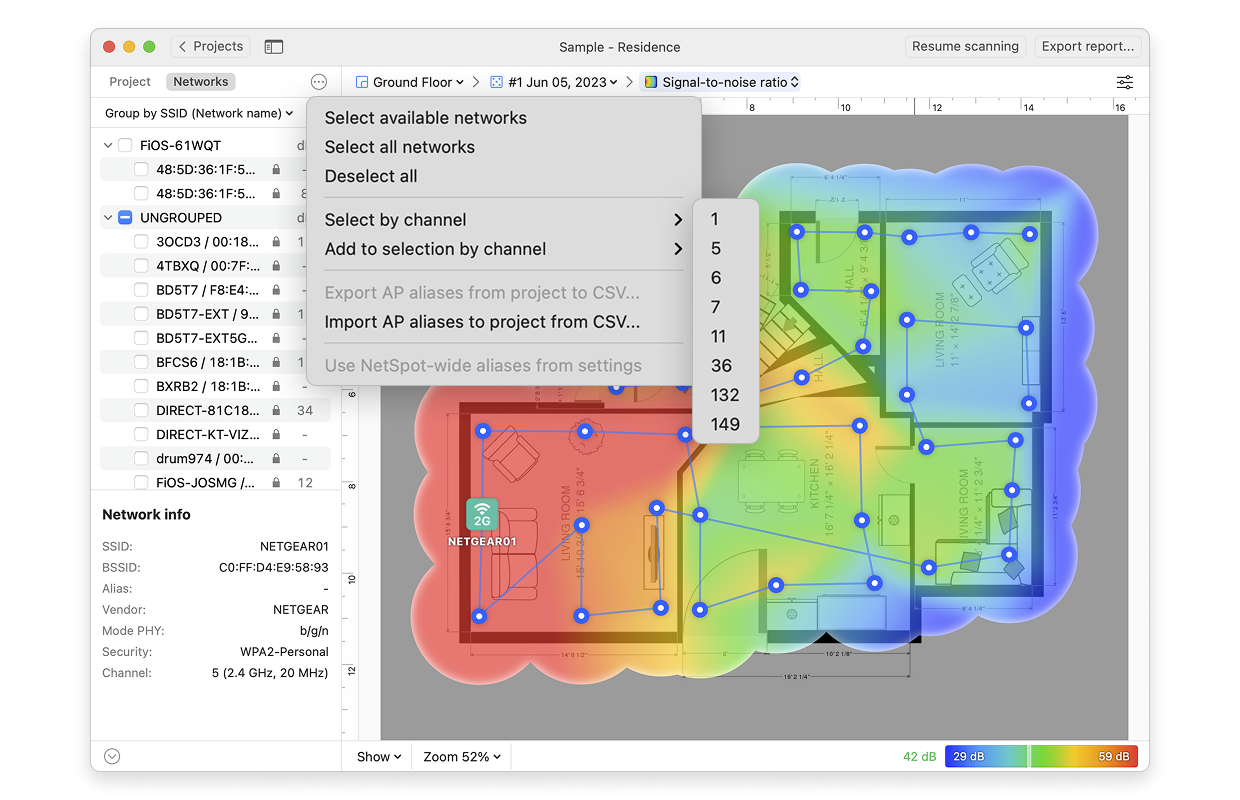
A ratio of 10-15dB is the accepted minimum to establish an unreliable connection; 16-24dB (decibels) is usually considered poor; 25-40dB is good and a ratio of 41dB or higher is considered excellent. If you hover over the measurement markers on the map and look at the AP names on the left, you can see the exact ratios for each location.
If your SNR levels are too low, see Troubleshooting SNR Issues for strategies to correct them. Users of NetSpot PRO, and Enterprise licenses have access to Automated Troubleshooting to help identify SNR issues.
There are several ways you can adjust this heatmap view:
- Wi-Fi Network: Each Wi-Fi network detected can be mapped individually. Simply check the box next to the network(s) you wish to view on the left-hand side of the NetSpot window.
- Wi-Fi Channel: Click (
 ) at the top of the left panel in NetSpot (above the networks list) to visualize networks broadcasting on certain channels.
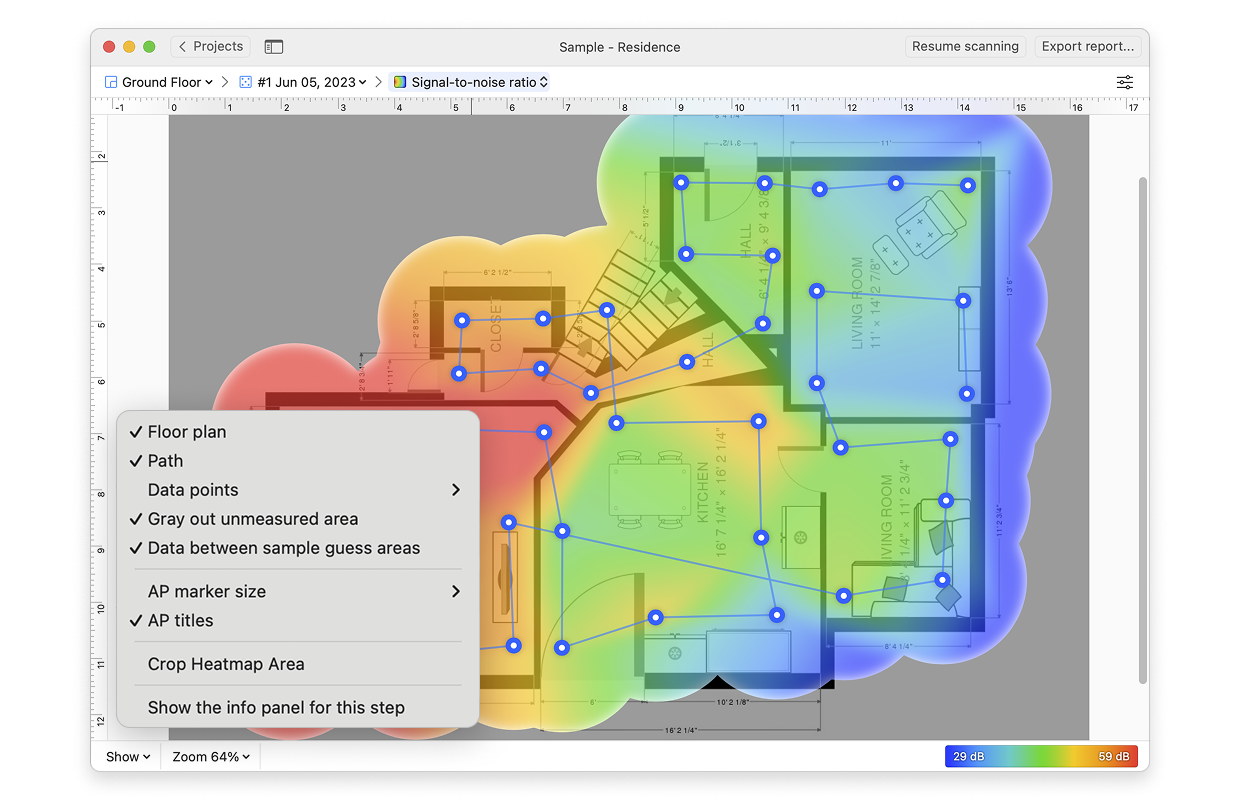
- View: By clicking on the Show menu in the bottom left corner of the canvas, you can choose whether to show your floor plan, path, sampling points, and AP titles on the heatmap, as well as several other adjustments.
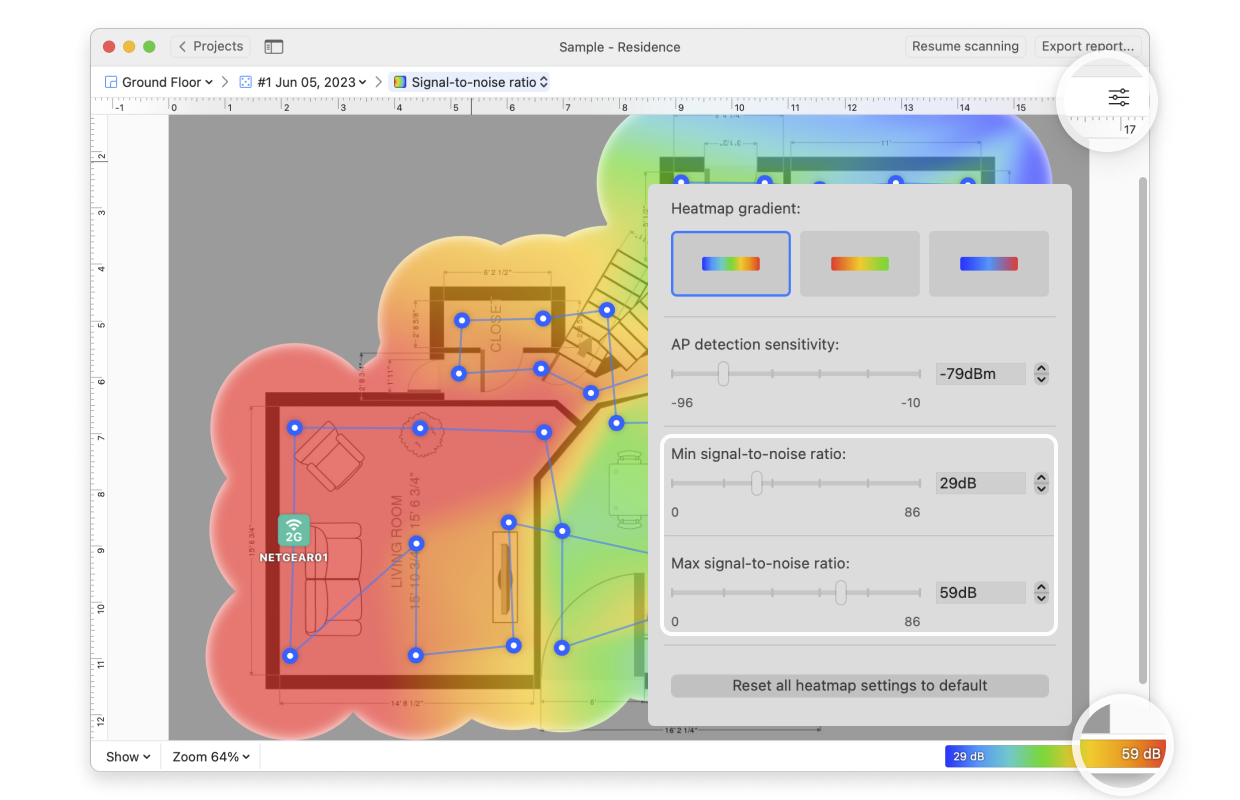
- AP Detection Proximity: By clicking the Heatmap Settings icon at the top right or by clicking on the gradient on the lower right, you can filter out weaker access points (APs) by adjusting the AP detection proximity slider. The default value is -50dBm.

- Min/Max signal-to-noise ratio: By clicking the Heatmap Settings icon in the upper right corner of the app window or by clicking on the gradient on the lower right, the color scheme of the SNR heatmap can be adjusted to a more convenient range. You can change the color combination by choosing from the three gradient options, and then the intensity can be changed by tweaking the visualized SNR. The default range is set to 0dB (minimum) and +86dB (maximum). You may get more helpful results if you set the minimum and maximum levels to a smaller range based on your target ratio.