NetSpot allows you to easily adjust how different values are represented by each color on the heatmaps. This can be useful if your heatmap doesn’t have a lot of color variation, and you want to make the subtle differences more evident. Or when you have a particular signal or noise level cut-off point and want to be able to highlight all areas that fall below that point.
NetSpot WiFi analyzer for macOS is available
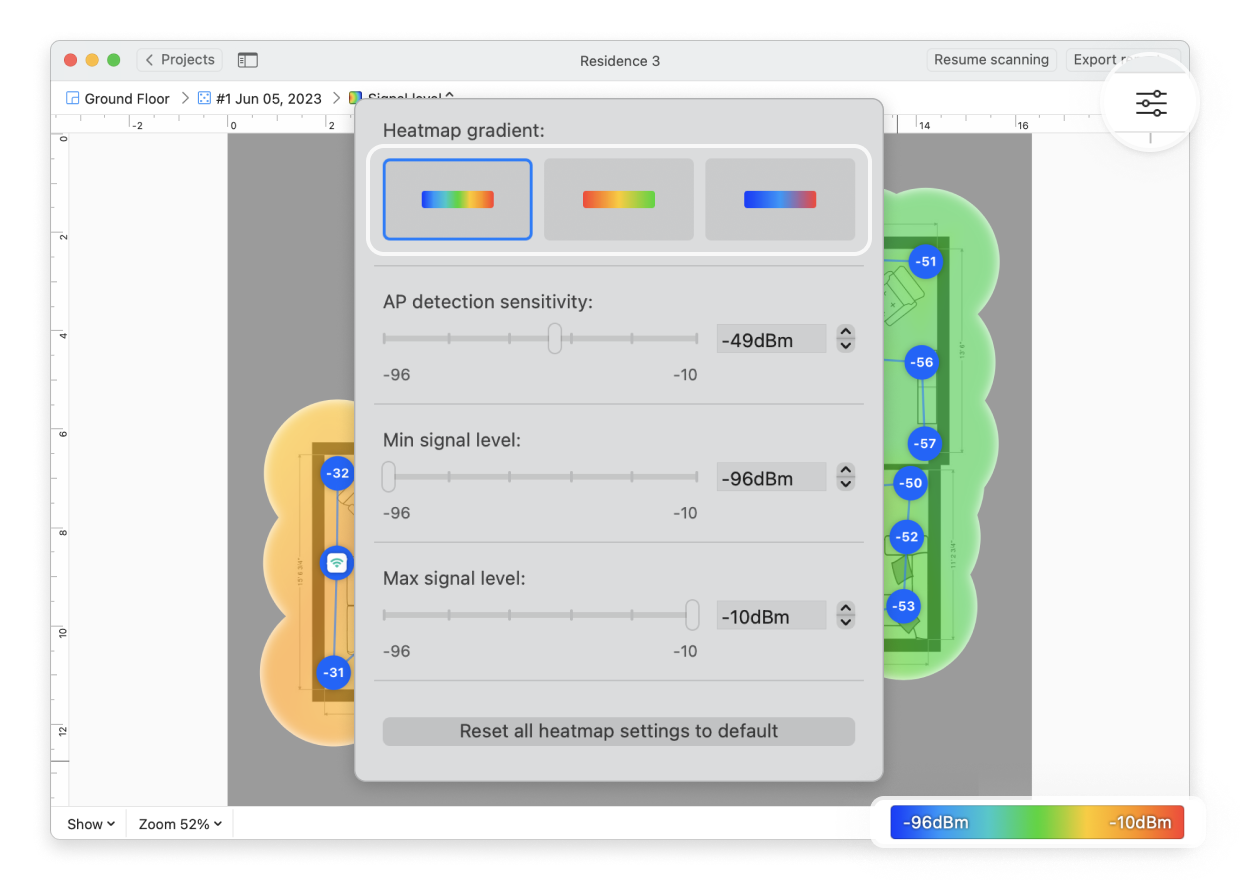
You can open these settings by either clicking the settings menu in the upper right corner of the app window or by clicking on the gradient on the lower right. You’ll need to adjust minimum and maximum settings for each type of heatmap individually.

Also, NetSpot offers three different heatmap gradient types that you can easily choose from depending on your preferred color scheme for signal strength representation. Open these settings by either clicking the settings menu in the upper right corner of the app window or by clicking on the gradient on the lower right, then refer to the Heatmap gradient section:
NetSpot Wi-Fi analyzer for Windows is released
updated: January 17, 2024 author: