Licensed versions of NetSpot offer several ways of customizing the look of your WiFi heatmaps. You can make adjustments through NetSpot Settings accessible from the Main menu. In this article we’ll talk specifically about Heatmap and
Additionally, you can make changes for each individual heatmap that you are currently working with by using the Heatmap Settings icon at the top right. The sliders in NetSpot are pretty sensitive, but if you feel like you need more precision, there is a spinbox next to each slider where you can select the exact values.
Available Heatmap Settings
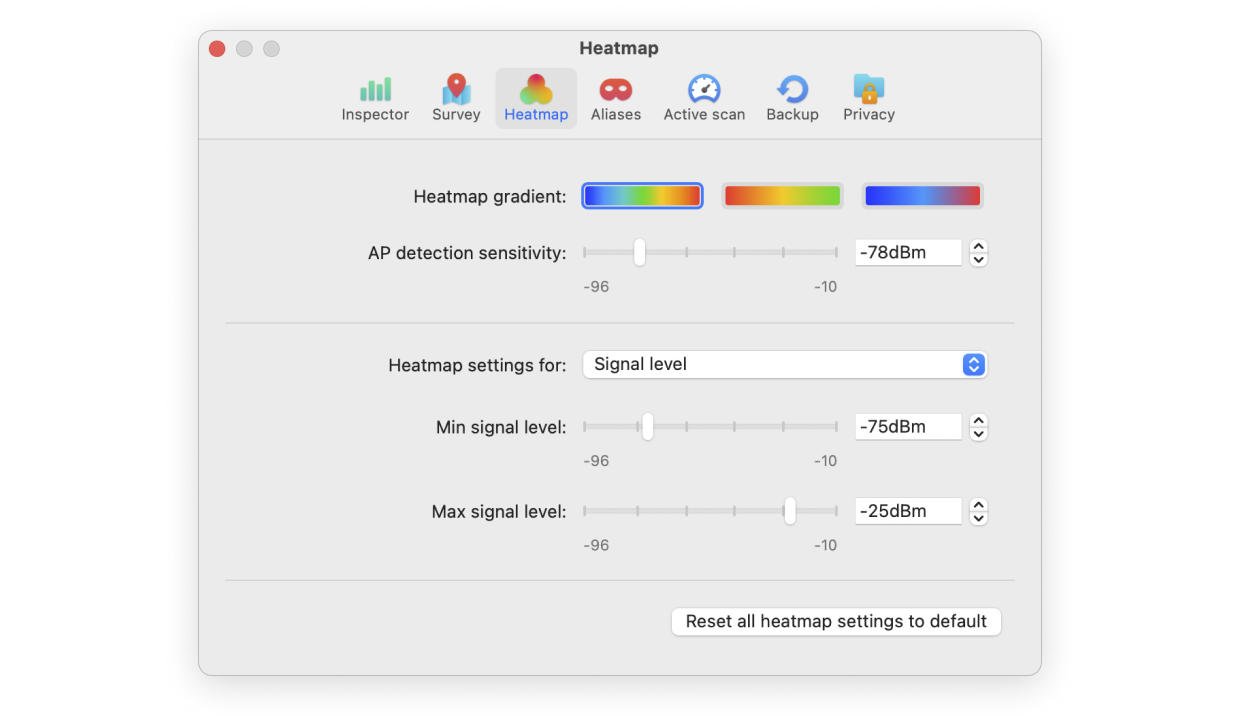
Find the heatmap settings in NetSpot > Settings… in the top menu bar, then select the Heatmap tab. You’ll find the following options there:
- Heatmap gradient: You have three choices for the color gradient. The first one covers the whole spectrum of the rainbow, with blue representing the most negative results and red representing the most positive ones. The second option has fewer colors (blue is removed) and reverses the spectrum so that red is negative and green is positive. The third has the fewest colors and simply ranges from blue (negative, cold) to red (positive, hot).
- AP detection sensitivity: This setting determines which of the detected access points will be shown on the heatmap. It is based on the Signal Level strength of a particular AP. Move the slider towards -96dBm to include weaker APs, and move it towards -10dBm to filter out the weak ones. The default is -50dBm. Use the spinbox to the right of the slider for precision.
- Individual Heatmap Settings: By clicking the drop-down menu under “Heatmap settings for:” you can select any visualization (including Passive scanning, Active scanning, and Troubleshooting) and adjust its settings. Please see the knowledgebase articles on the individual types of heatmaps to learn more about the settings for each one.
- To reset all heatmap settings to their default values use the button at the bottom of the Settings window.
The “Show” and “Zoom” menus
You’ll find slightly different options in Survey and Planning modes. Both Zoom and Show menus can be found in the bottom left corner of the canvas.
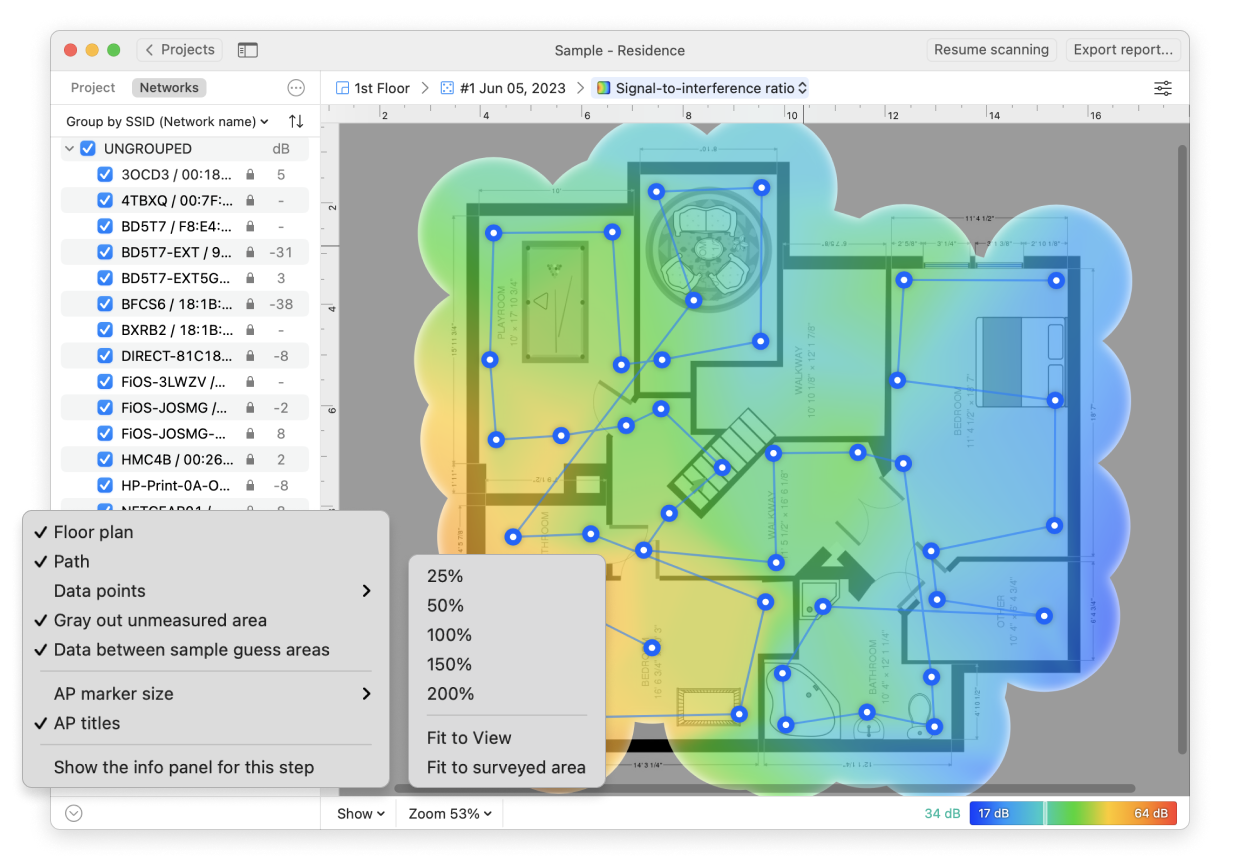
The Zoom and Show menus in Survey mode
The “Show” menu includes the following options:
- Floor plan (survey and planning)
Check and uncheck to respectively show or hide the floor plan in the generated heatmap.
- Path (survey)
Shows the path you’ve taken during measurements.
- Data points (survey)
Choose how to show data points or don’t show them at all.
- Gray out unmeasured areas (survey)
Helps to visually distinguish areas not involved in measurements, which is especially useful for certain types of heatmaps.
- Data between sample guess areas (survey)
Allows you to fill the areas omitted during measurements with data calculated automatically based on your actual gathered data.
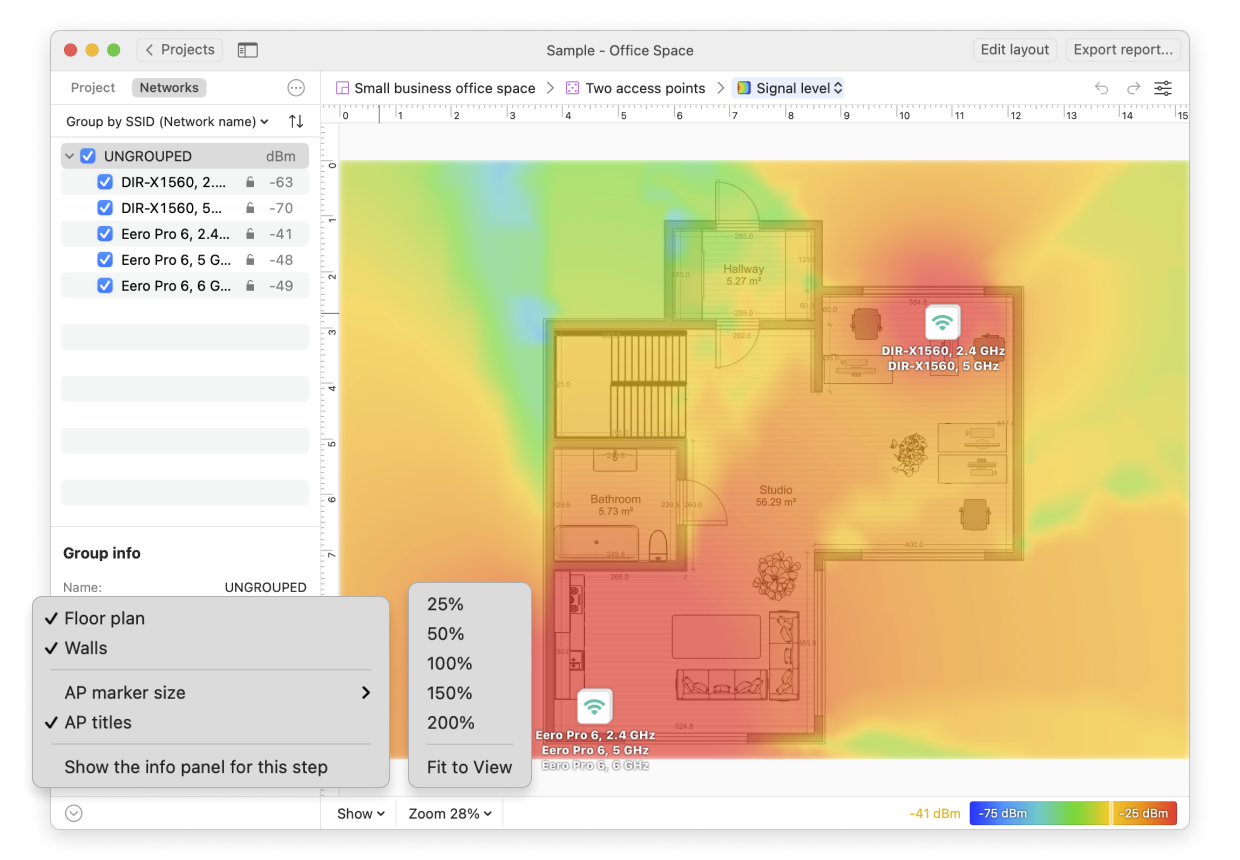
The Zoom and Show menus in Planning mode
- Walls (planning)
Check and uncheck to respectively show or hide the building elements in the generated heatmap.
- AP Marker size (survey and planning)
Select from three options of AP marker size: small, medium, or large.
- AP titles (survey and planning)
Show or hide the AP brand and model titles under their markers.
- Crop Heatmap (survey and planning)
Heatmaps can be cropped to bring focus to a certain area.
- Show the info panel for this step (survey and planning)
You can tick this option in order to read the hints NetSpot offers for the currently active heatmap type.
The “Zoom” menu is supplemental to your zooming in and out with your mouse or trackpad.