Basing your WiFi site analysis on a visual representation of various network parameters is extremely effective and surely makes the process faster. Use the vast set of visualizations offered by NetSpot for a thorough wireless network survey that will give you all the necessary tools to improve your WiFi coverage tremendously.
Passive scanning
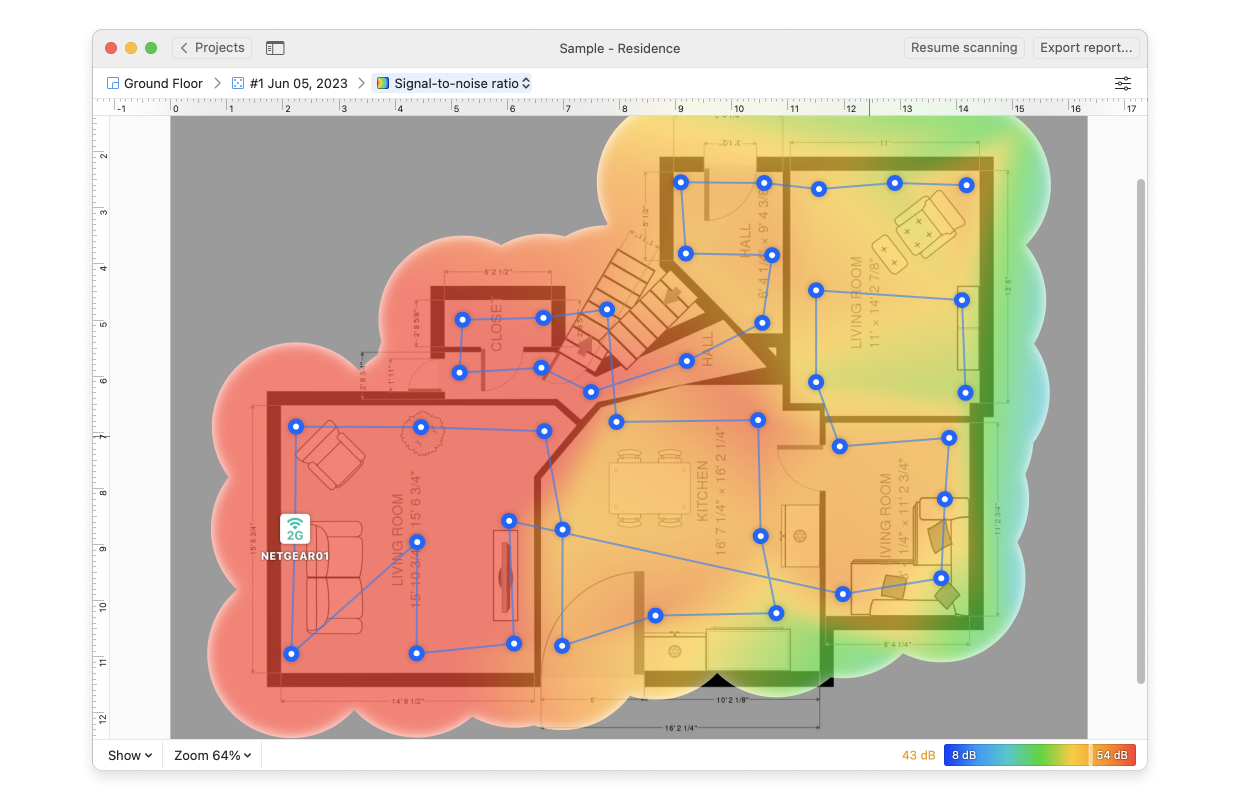
Signal-to-noise ratio
Compare the level of WiFi signal to the level of background noise. A ratio of 10-15dB is seen as unreliable and a ratio of 16-24dB – as poor. Read what ratio to aim for here.
| Available on: macOS | License: Home, Pro, Enterprise |
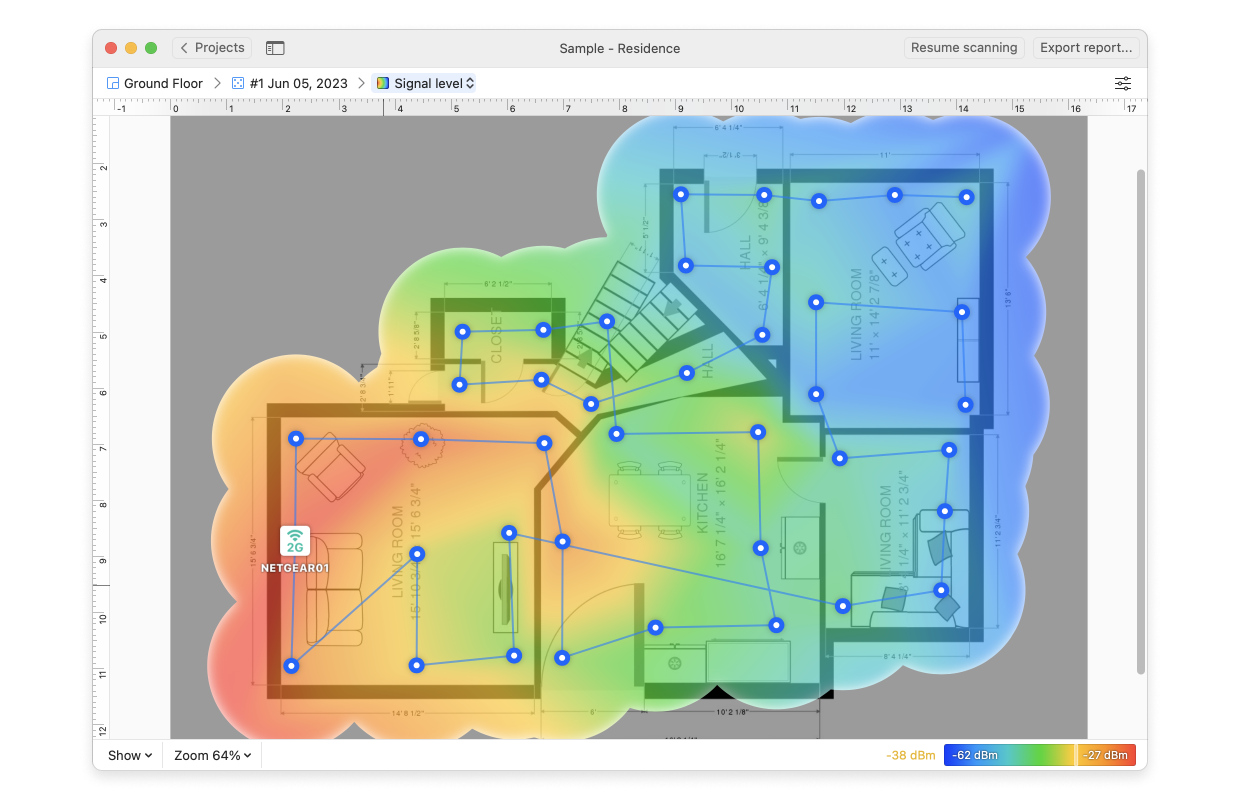
Signal level
See the current strength of your WiFi signal. Use its data in combination with other parameters like interference level. More details here.
| Available on: macOS, Windows | License: Home, Pro, Enterprise |
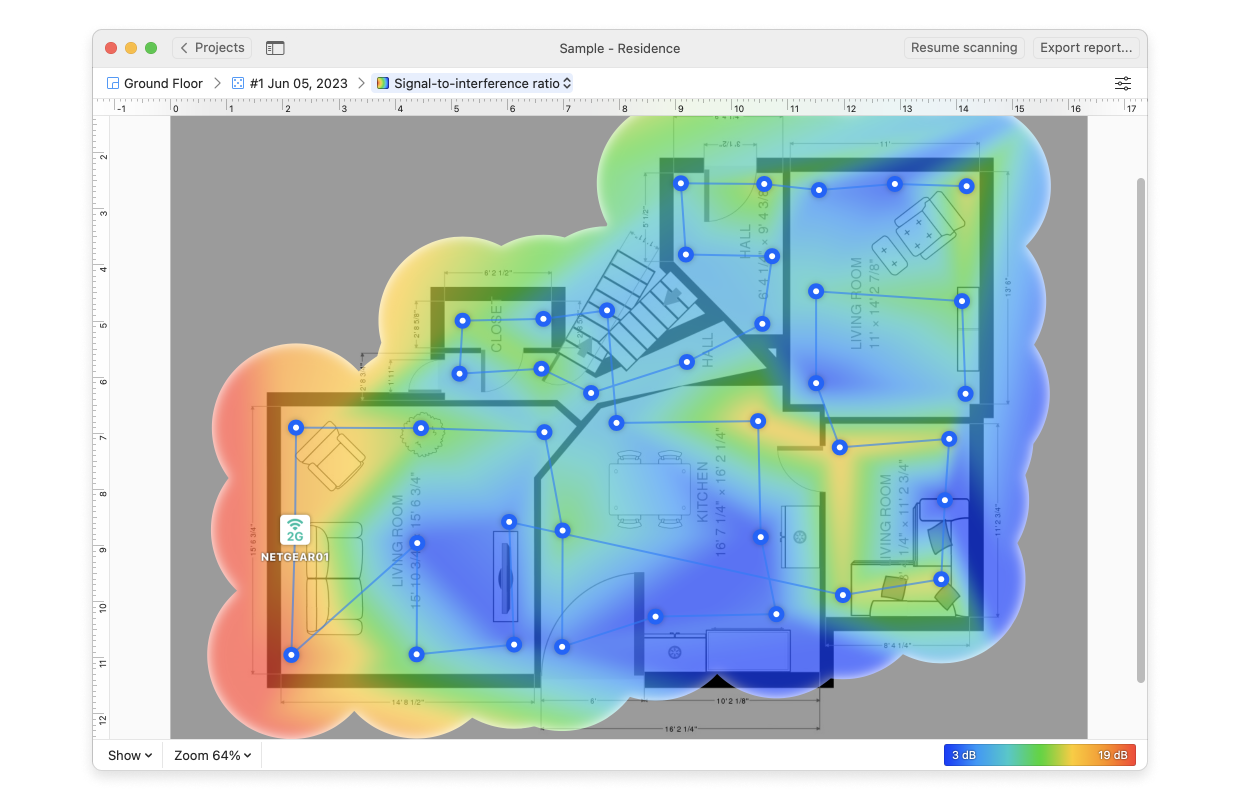
Signal-to-interference ratio
This value is similar to the signal-to-noise ratio, but here the interference is the co-channel one from other radio transmitters. Get more info here.
| Available on: macOS, Windows | License: Home, Pro, Enterprise |
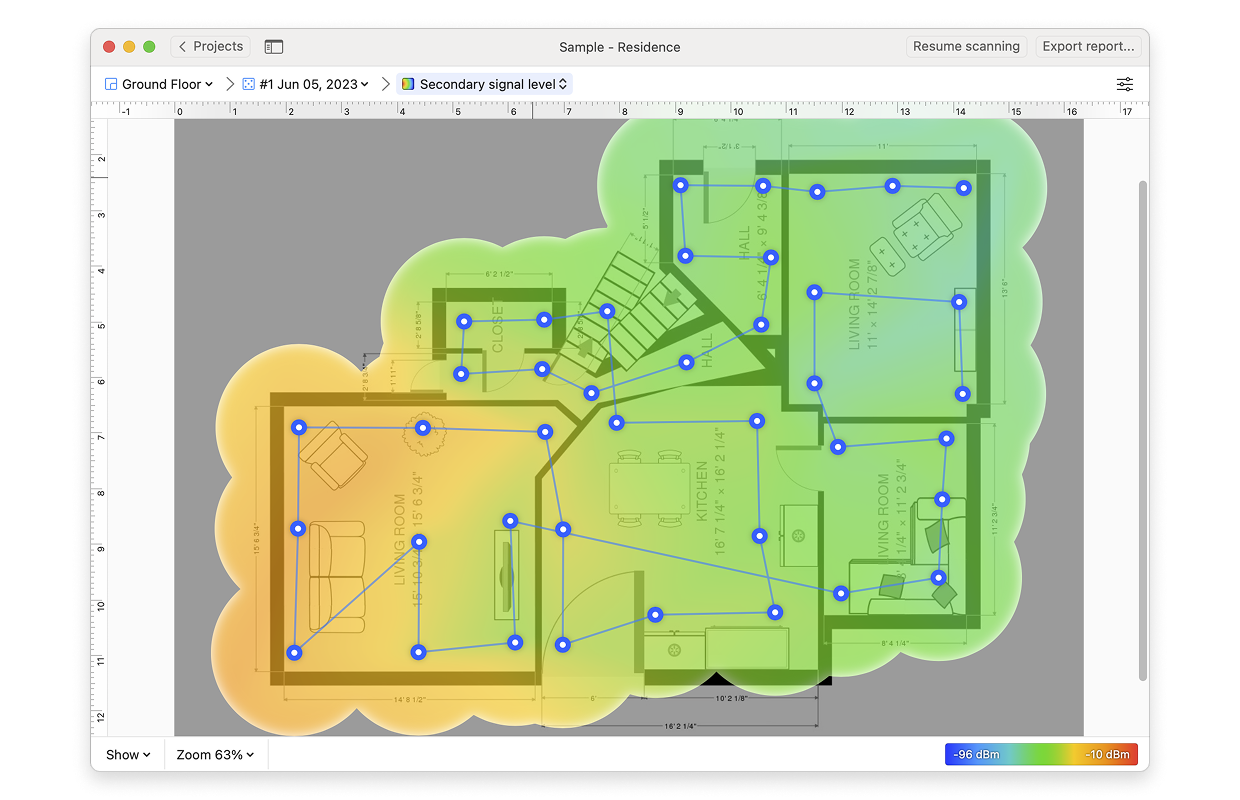
Secondary Signal Level
Shows the strength of your secondary WiFi network coverage. This heatmap can offer you an insight on how the secondary signal covers your space, and whether any adjustments are needed for the poorly connected areas. More details here.
| Available on: macOS, Windows | License: Pro, Enterprise |
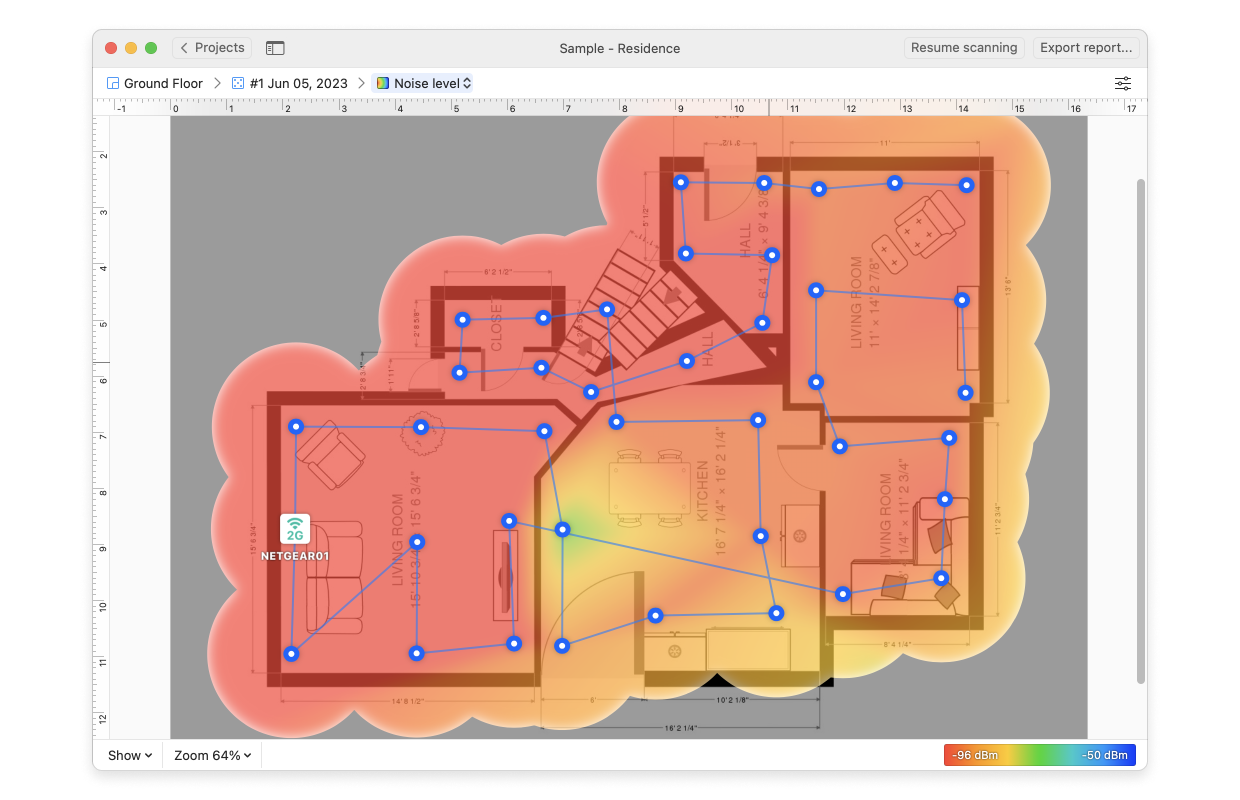
Noise level
This value represents the outside interference detected at each measurement point. Some examples of noise sources are microwave ovens, Bluetooth devices, wireless video cameras, wireless game controllers, fluorescent lights, etc. You can read more here.
| Available on: macOS | License: Pro, Enterprise |
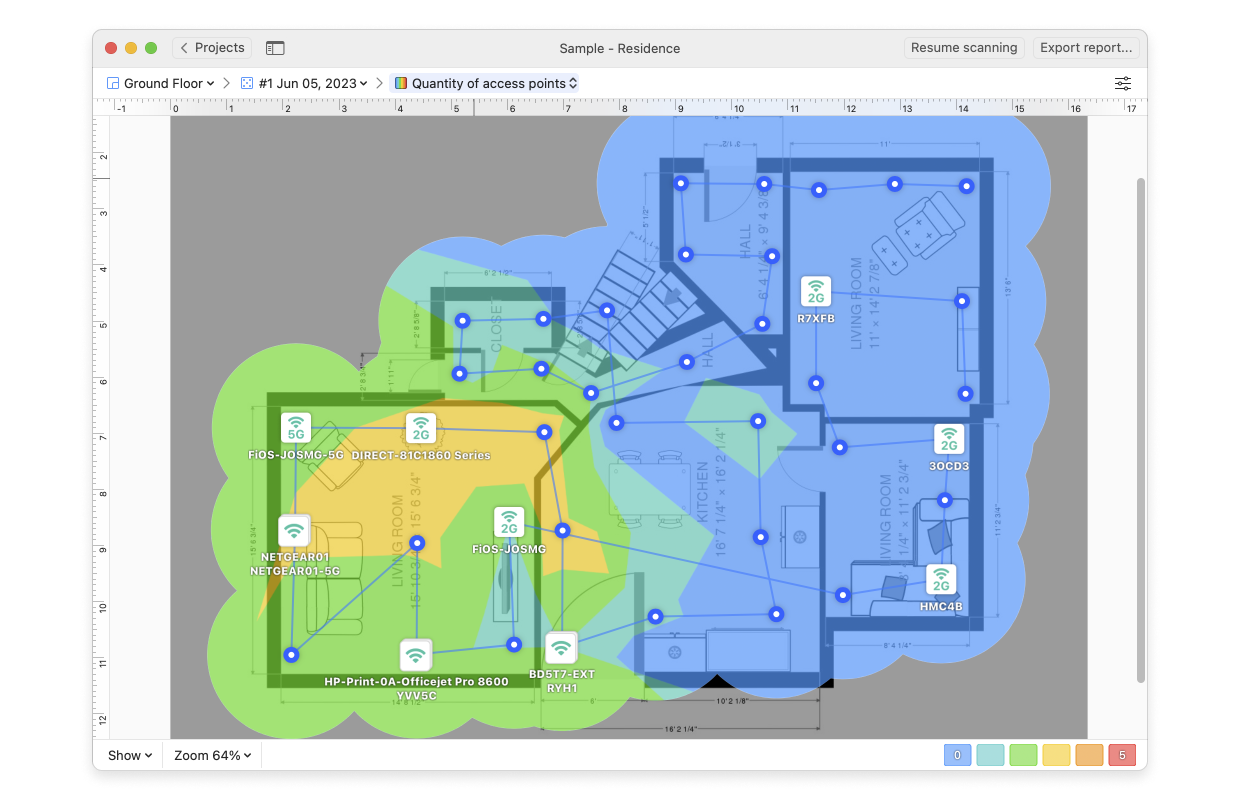
Quantity of access points
See how many access points are presently detected on your wireless network as well as the exact signal for each of them. Find more info about this visualization here.
| Available on: macOS, Windows | License: Pro, Enterprise |
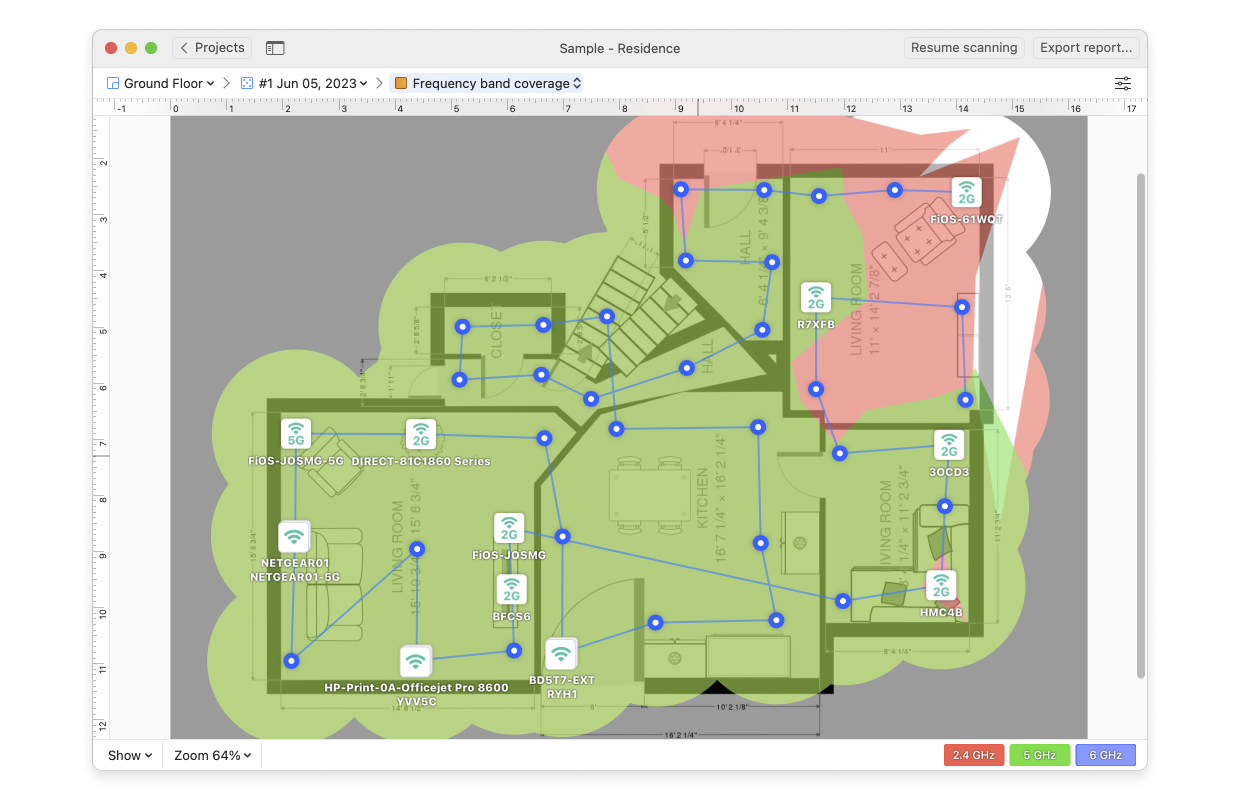
Frequency band coverage
See how the 2.4GHz and 5GHz frequency bands are distributed throughout your space and where the signal might be missing altogether. Follow this link for more details.
| Available on: macOS, Windows | License: Pro, Enterprise |
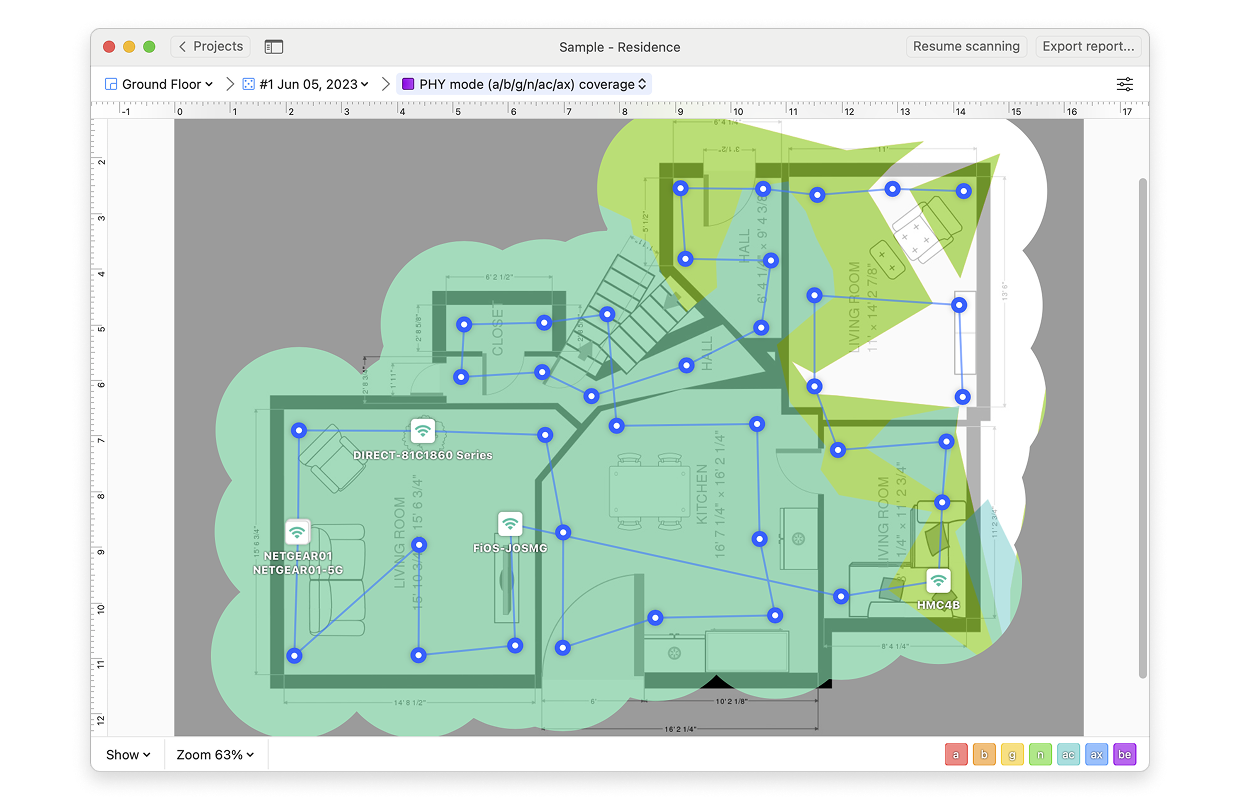
PHY mode coverage
Displays in colors the 802.11 WiFi protocols (a/b/g/n/ac/ax/be) modes that are used in your wireless space. Read more.
| Available on: macOS, Windows | License: Pro, Enterprise |
Active scanning
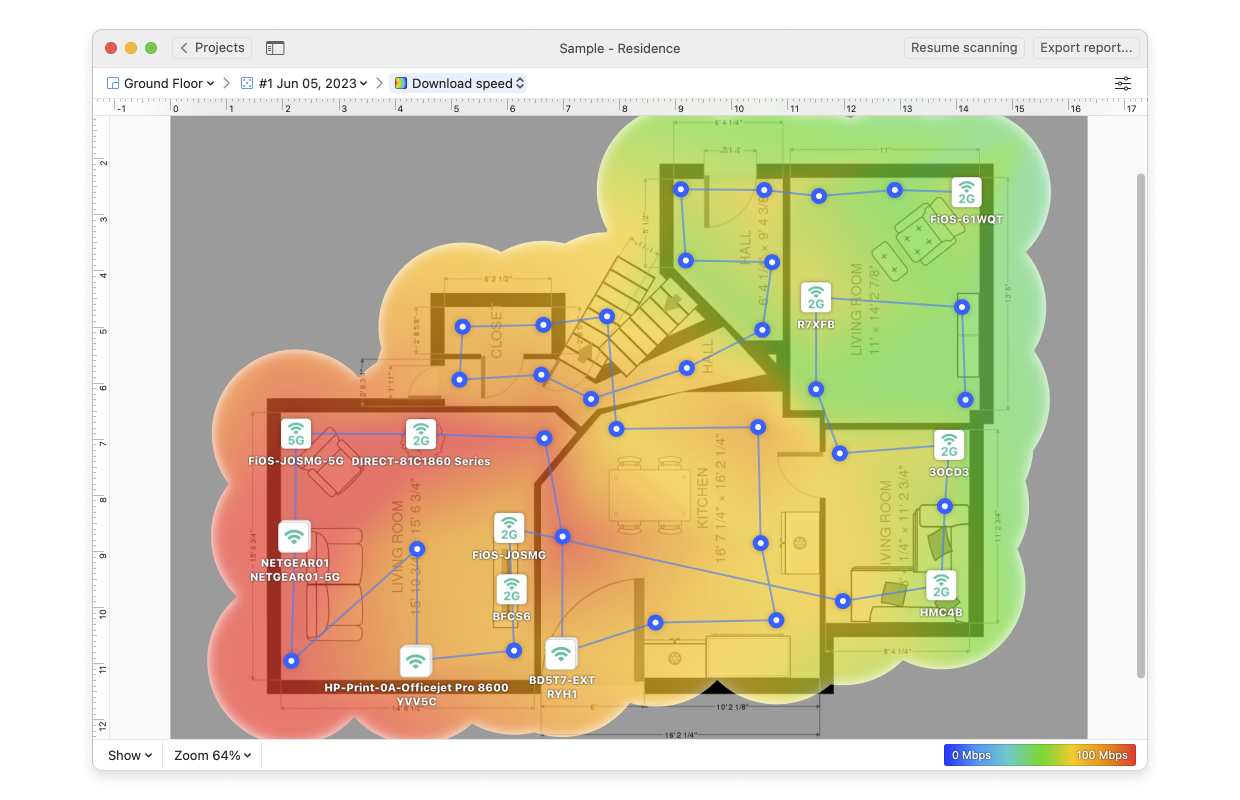
Download speed
The download speed shows how fast data from the Internet can be downloaded to a user’s computer. Follow this link to find out more.
| Available on: macOS, Windows | License: Pro, Enterprise |
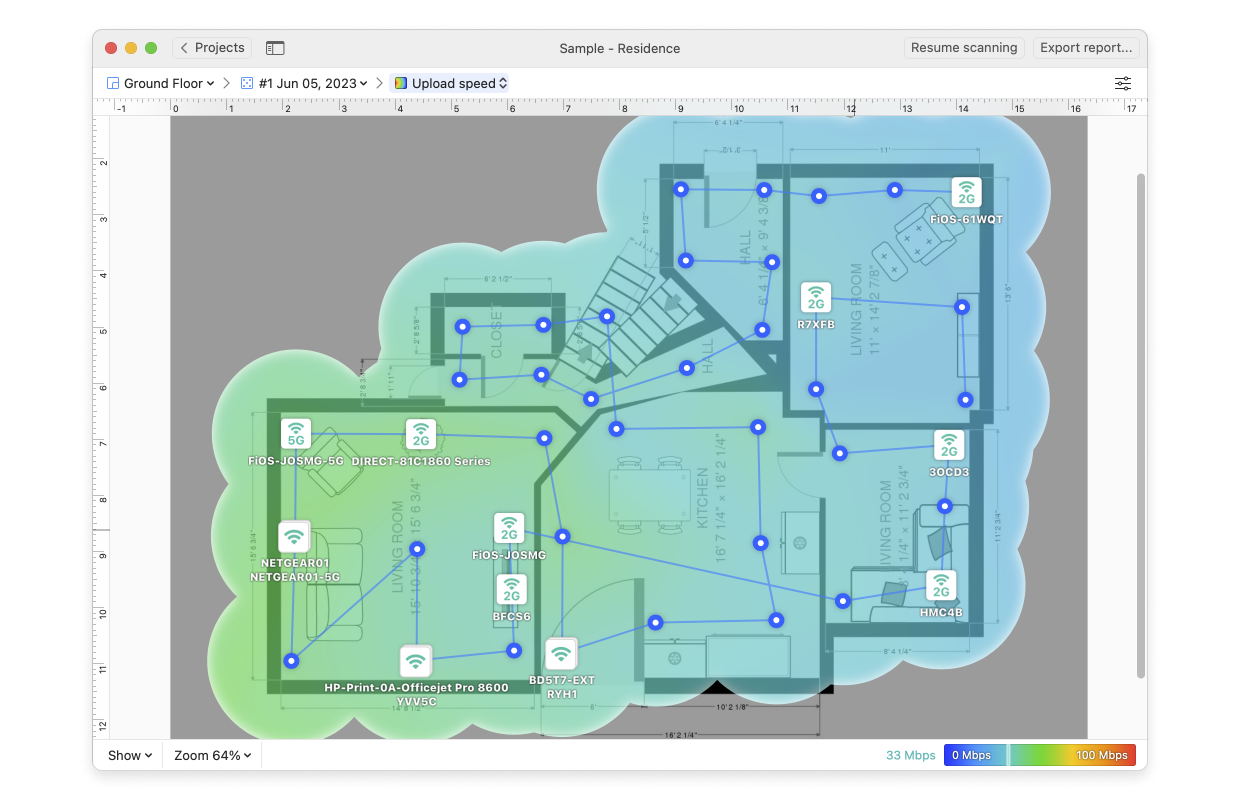
Upload speed
The upload speed shows how fast data can be uploaded from a user’s computer to the Internet. Here you can read how NetSpot measures this value.
| Available on: macOS, Windows | License: Pro, Enterprise |
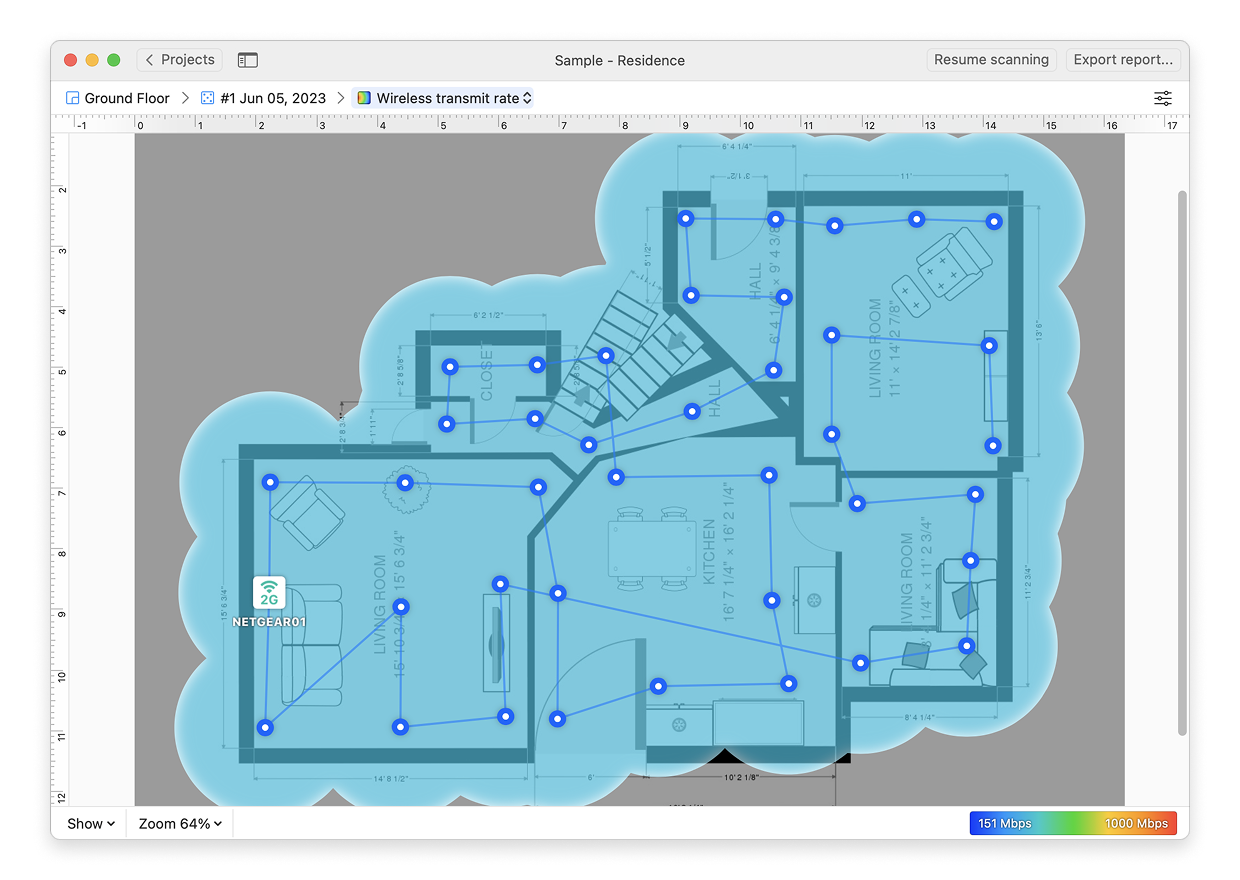
Wireless transmit rate
This visualization displays at what speed the data is transmitted from an access point to a wireless device connected to the network. The details about this type of heatmaps can be found here.
| Available on: macOS, Windows | License: Pro, Enterprise |
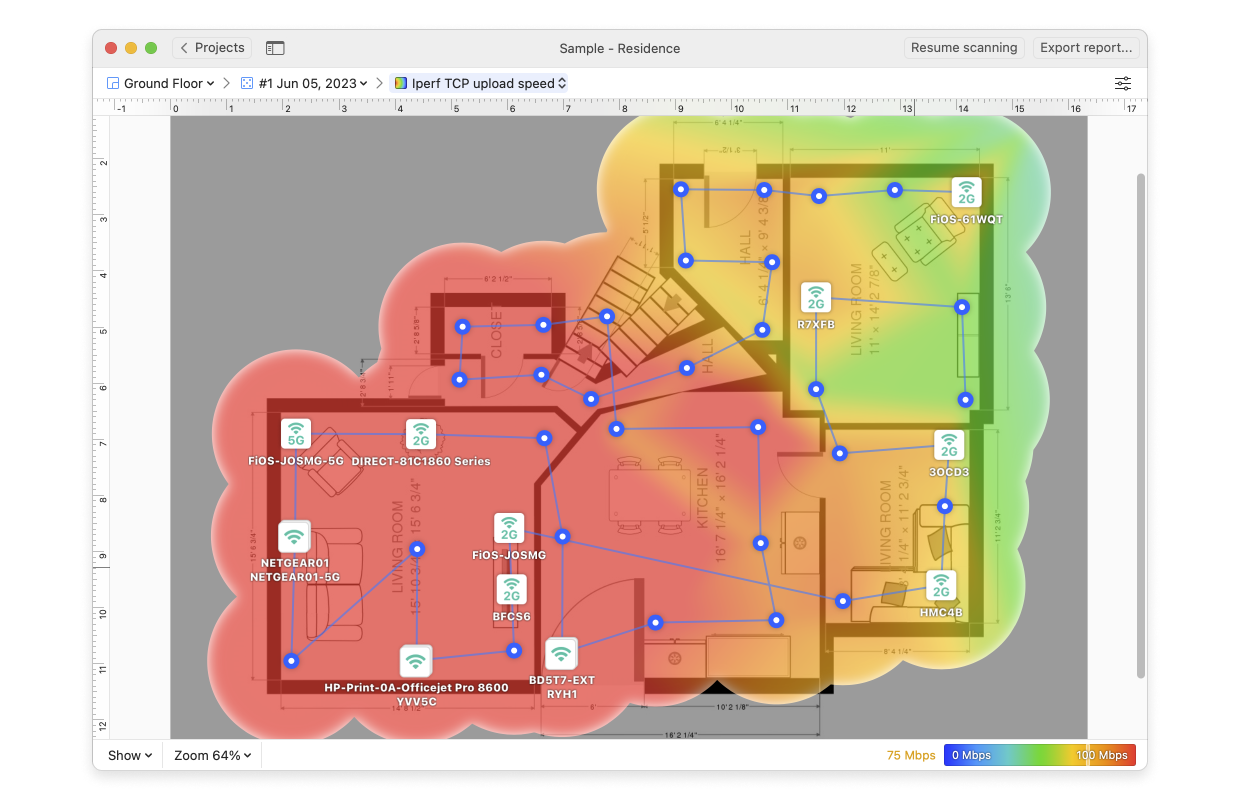
Iperf3 upload
This type of analysis helps you measure and then generate visualizations for upload speed via HTTP, TCP, or UDP. Learn how to set it up in the Active Scanning preferences.
| Available on: macOS | License: Pro, Enterprise |
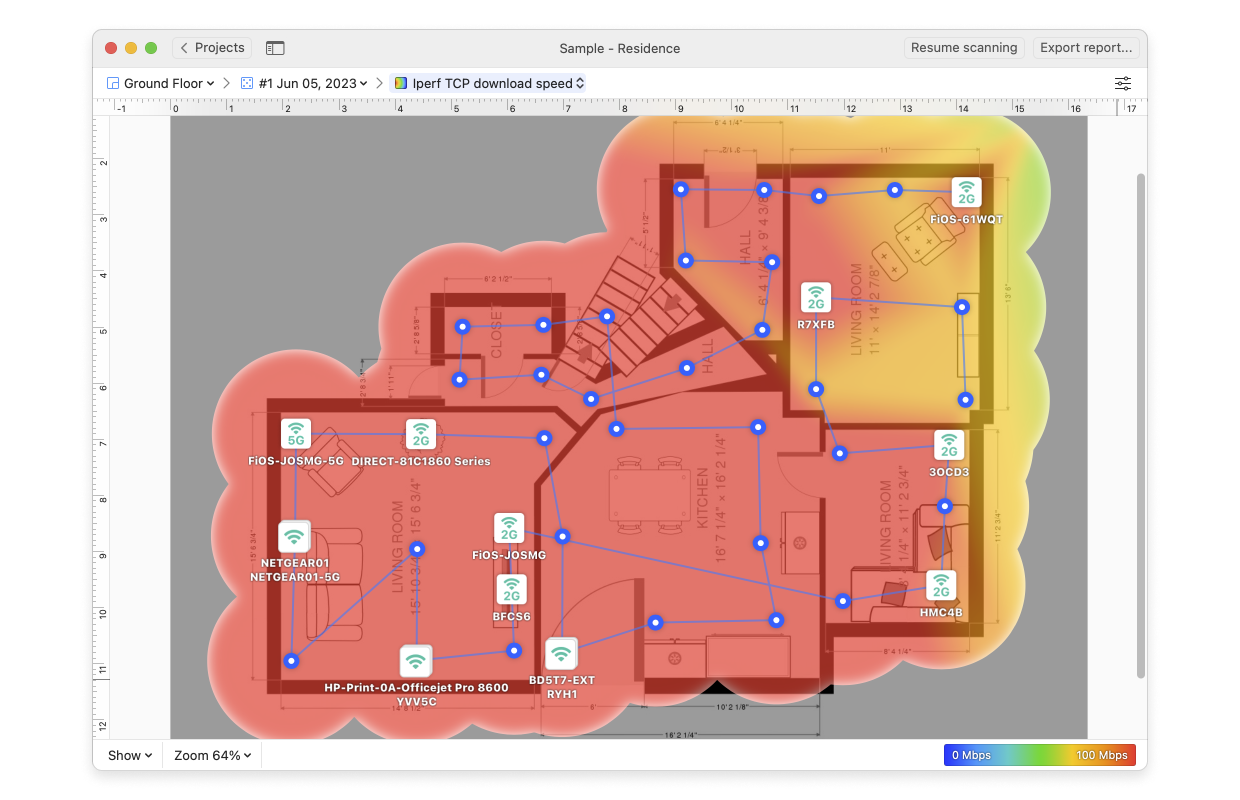
Iperf3 download
Measure and visualize the download speed values via HTTP, TCP, or UDP. Learn how to perform the Active Scan via these protocols.
| Available on: macOS | License: Pro, Enterprise |
Troubleshooting
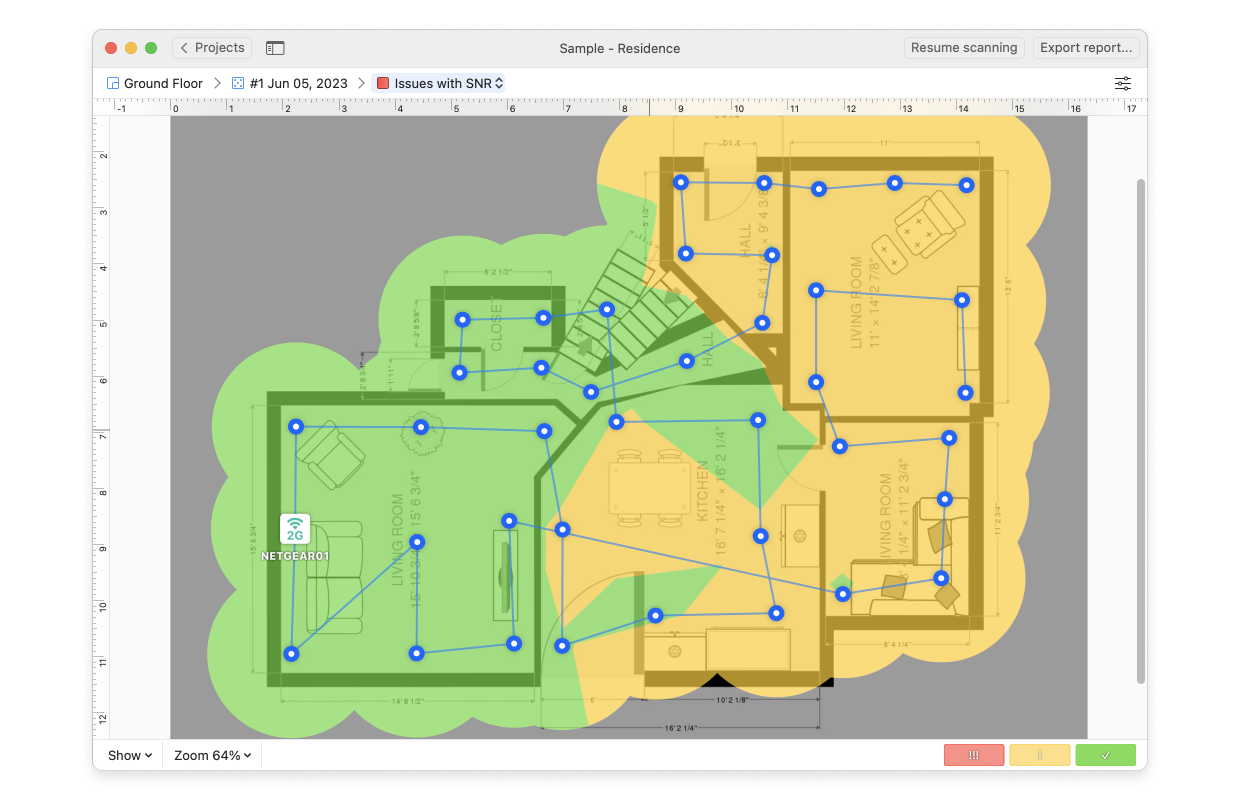
Issues with SNR
This visualization compares the level of WiFi signal to the one of background noise. The article here will explain how to use this visualization and determine whether your problem lies with the signal strength or the noise level.
| Available on: macOS | License: Pro, Enterprise |
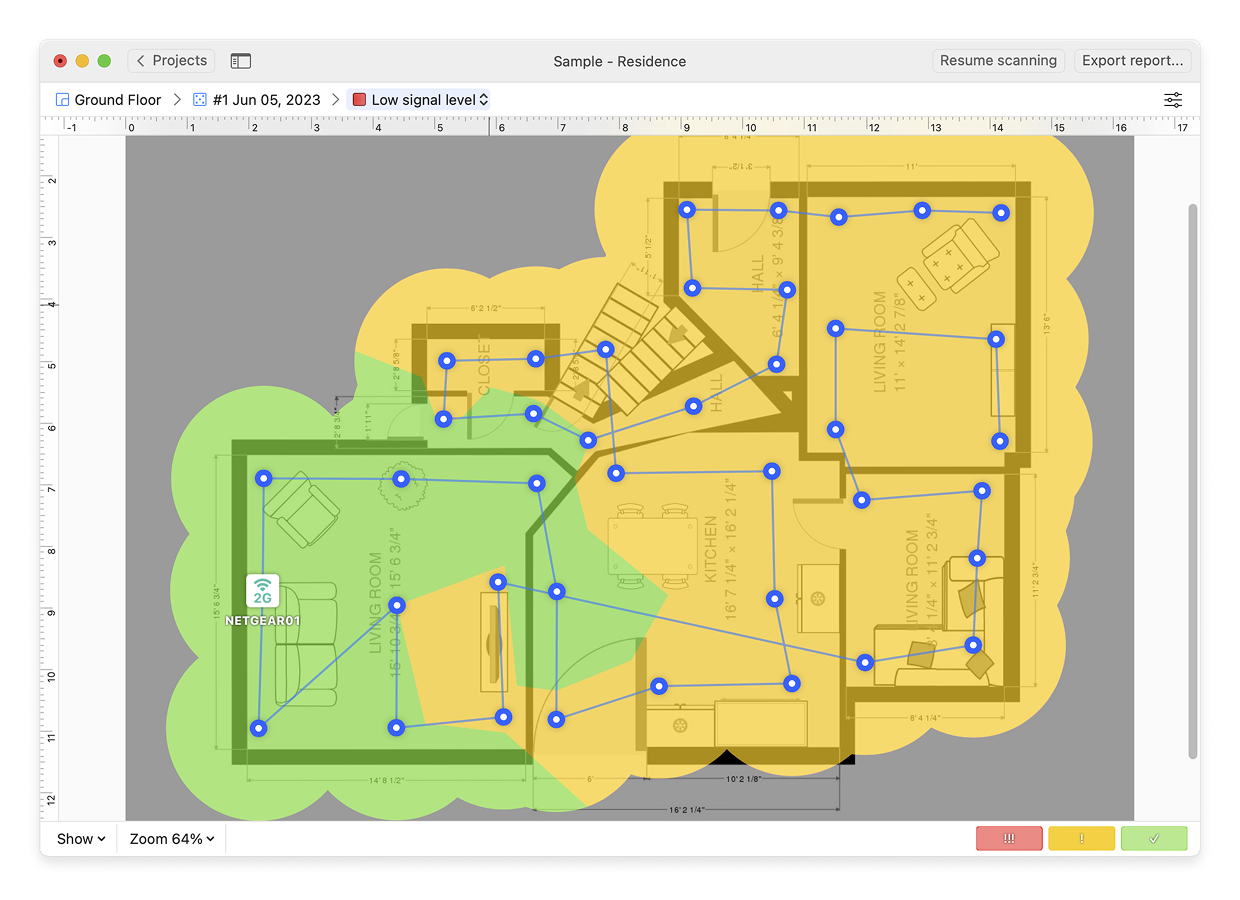
Signal level (low/high)
The signal level represents the strength of your WiFi and with its visualization, you’ll easily see the weaker areas that need troubleshooting and can decide on the steps to be performed toward improvement. Here you can read about troubleshooting the low signal level.
| Available on: macOS, Windows | License: Pro, Enterprise |
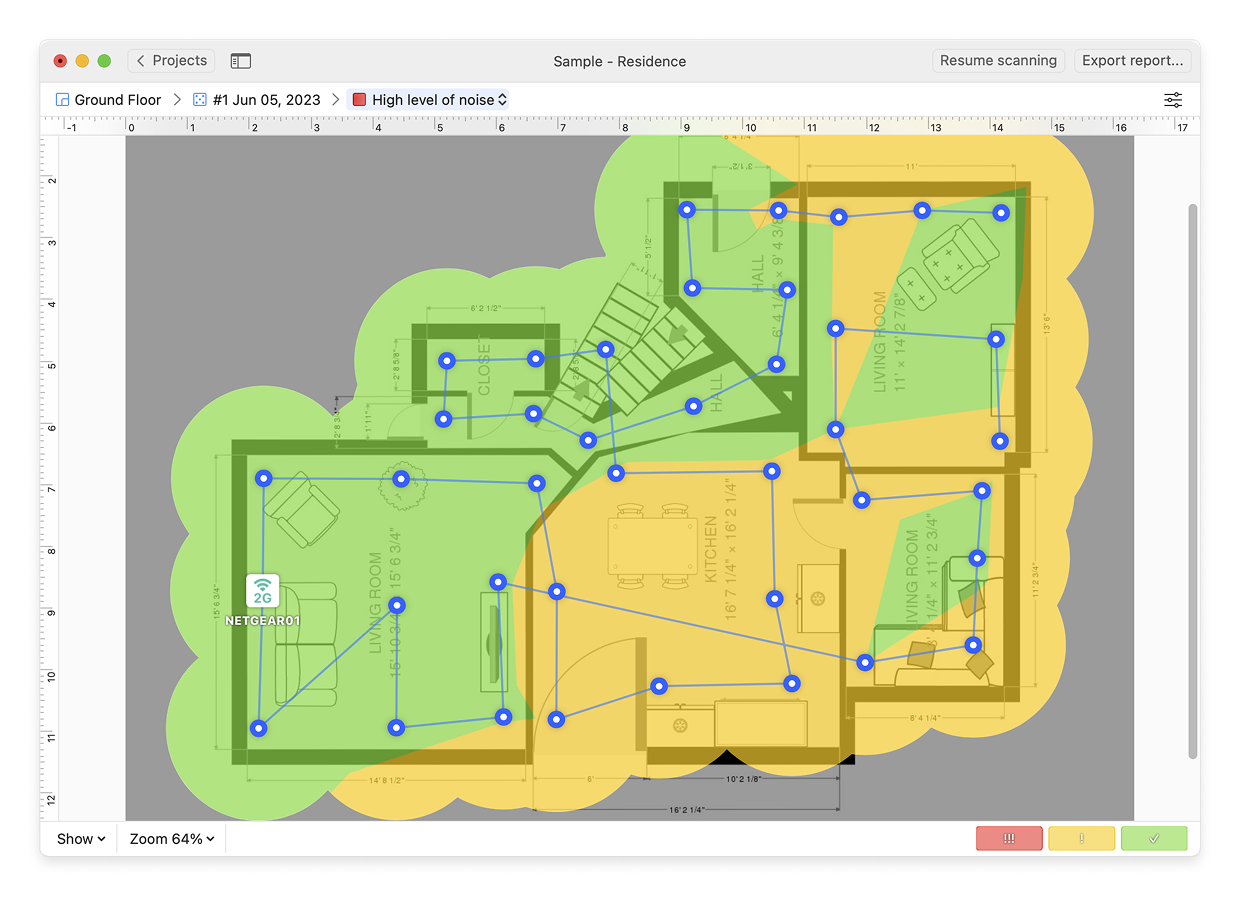
High level of noise
The noise level greatly affects your signal level, so comparing the two values will give you an understanding of where the signal level can be improved by the way of eliminating noise sources. In this article, you can read how to see which access points are affected by the noise and what to do next.
| Available on: macOS | License: Pro, Enterprise |
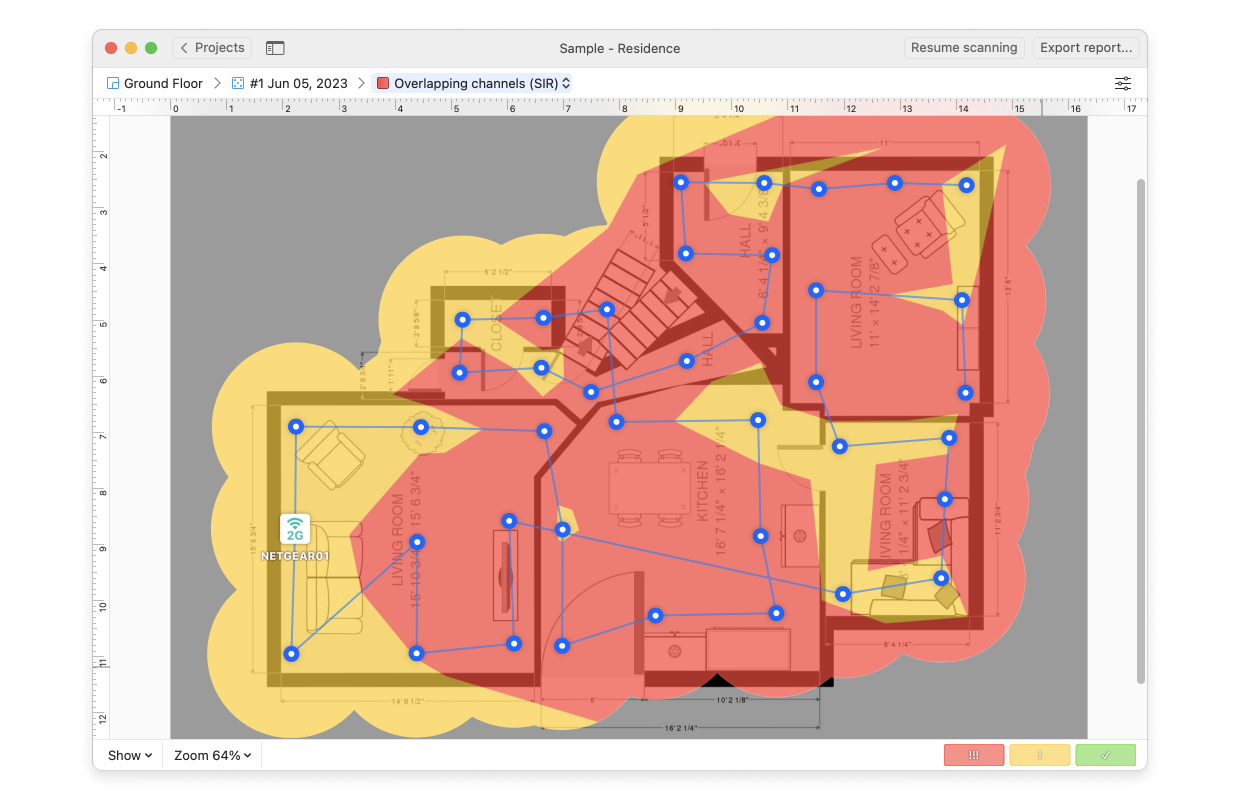
Overlapping channels
When a channel overlap occurs the signal strength can be affected negatively and the download and upload speeds may drop. This type of visualization can help you clearly see where the issue lies and help you decide what steps to take to fix it. More about troubleshooting here.
| Available on: macOS, Windows | License: Pro, Enterprise |
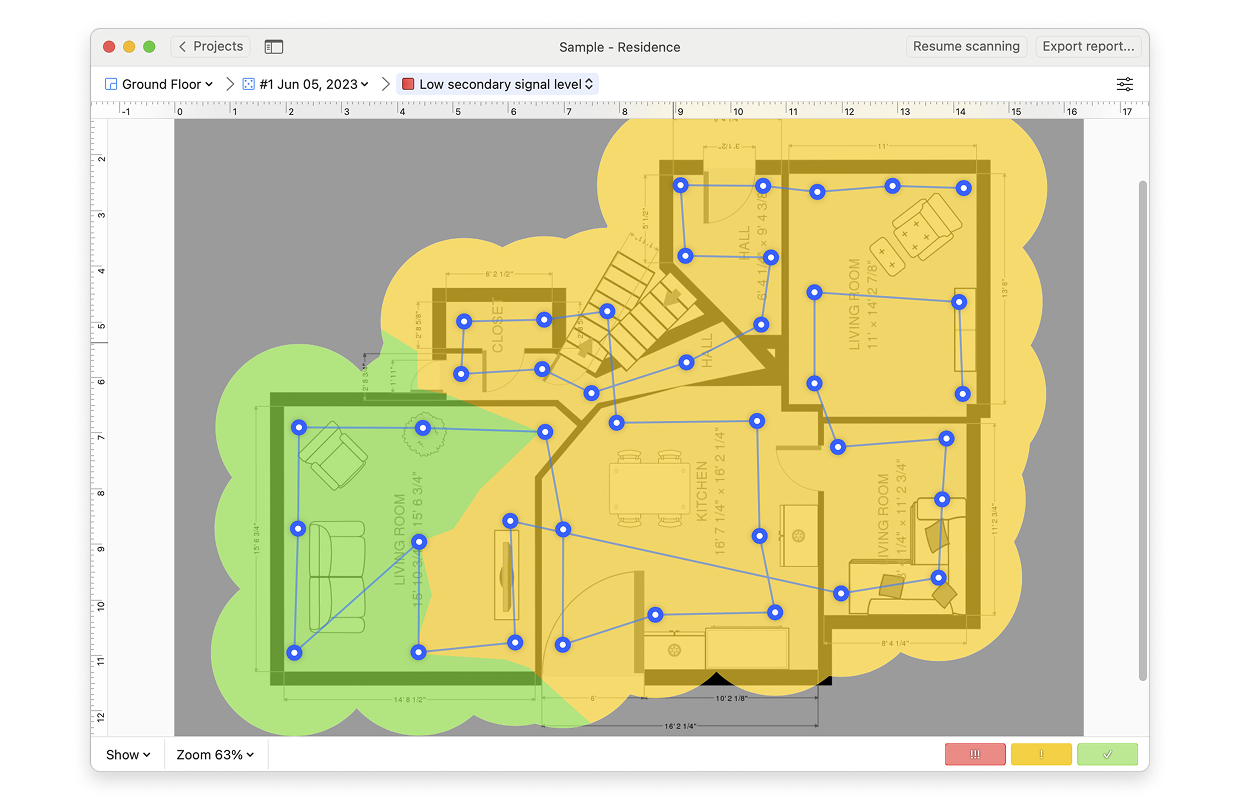
Low Secondary Signal level
This heatmap is designed to help you decide whether any adjustments are necessary for your secondary wireless coverage. This is a three color heatmap of vibrant colors representing different signal level values. Here you can read about troubleshooting the low secondary signal level.
| Available on: macOS, Windows | License: Pro, Enterprise |
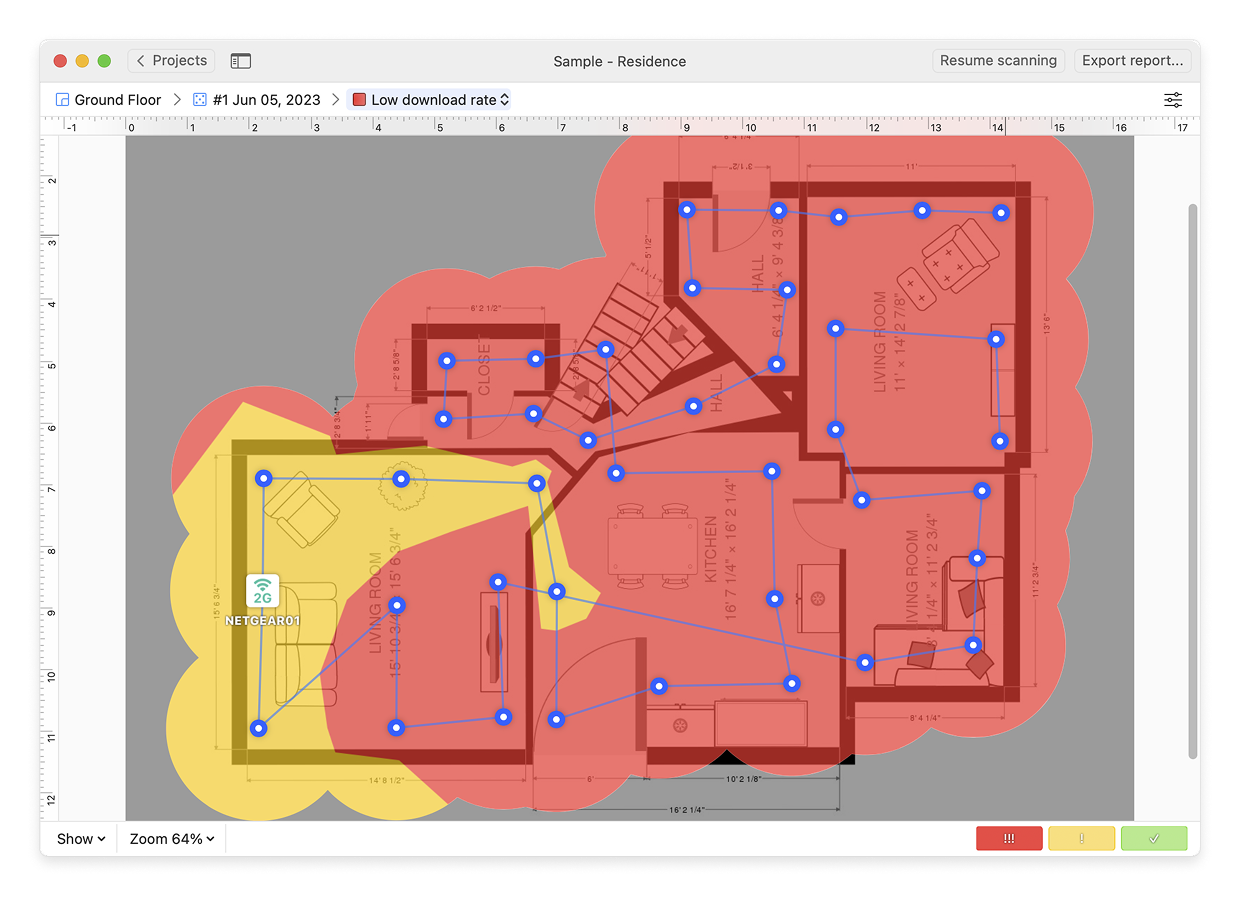
Low download rate
Use this visualization to see which areas of your coverage are suffering a lower download speed and follow easy steps to narrow down which access points are affected by this issue. Read more here.
| Available on: macOS, Windows | License: Pro, Enterprise |
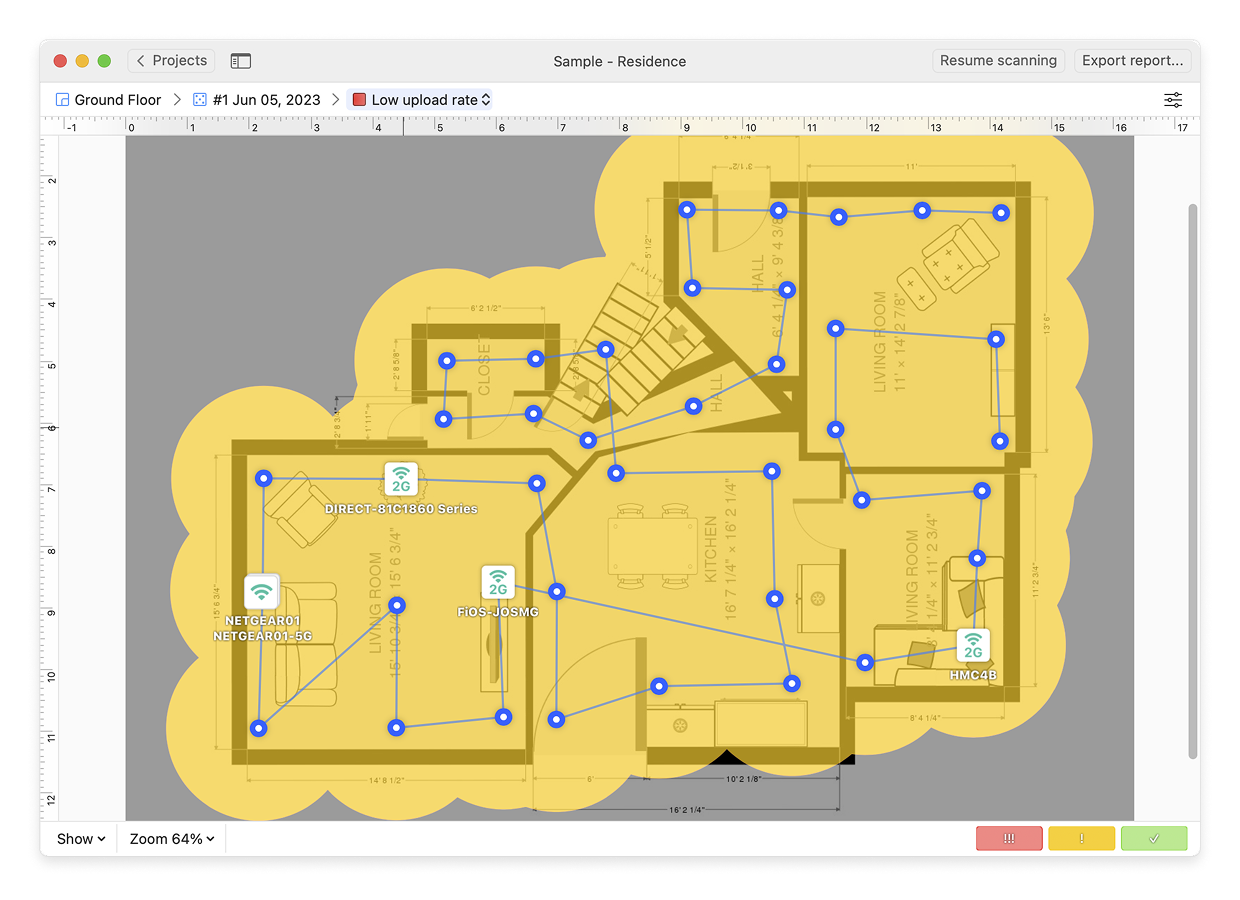
Low upload rate
This visualization will let you easily see whether your network has areas of low upload speed and where exactly the situation needs to be remedied. Read more here.
| Available on: macOS, Windows | License: Pro, Enterprise |
Thanks to a variety of visualizations available in NetSpot, troubleshooting any possible issue with your WiFi coverage is as easy as pie. Let the results you see in the color-coded heatmaps complement each other to achieve the best result.