The Noise level is the amount of outside interference detected at each measurement point. Noise negatively affects your Wi-Fi signal. Sources of noise can include microwave ovens, cordless phones, Bluetooth devices, wireless video cameras, wireless game controllers, fluorescent lights, and more.
Your noise level is best understood in comparison to your signal strength (see What is the signal-to-noise ratio?). Other Wi-Fi networks are not counted as noise — they are counted as interference (see the Signal-to-Interference Ratio). If you hover over the measurement markers on the map and look at the AP names on the left, you can see the exact noise levels for each location.
The Noise Level visualization is available only in the Pro and Enterprise versions of NetSpot. At this time, it is not possible to properly measure noise levels on Windows computers, only some macOS computers allow collecting this data for all available networks. If a project with the noise level heatmap was created on a macOS computer, it will be supported in NetSpot for Windows.
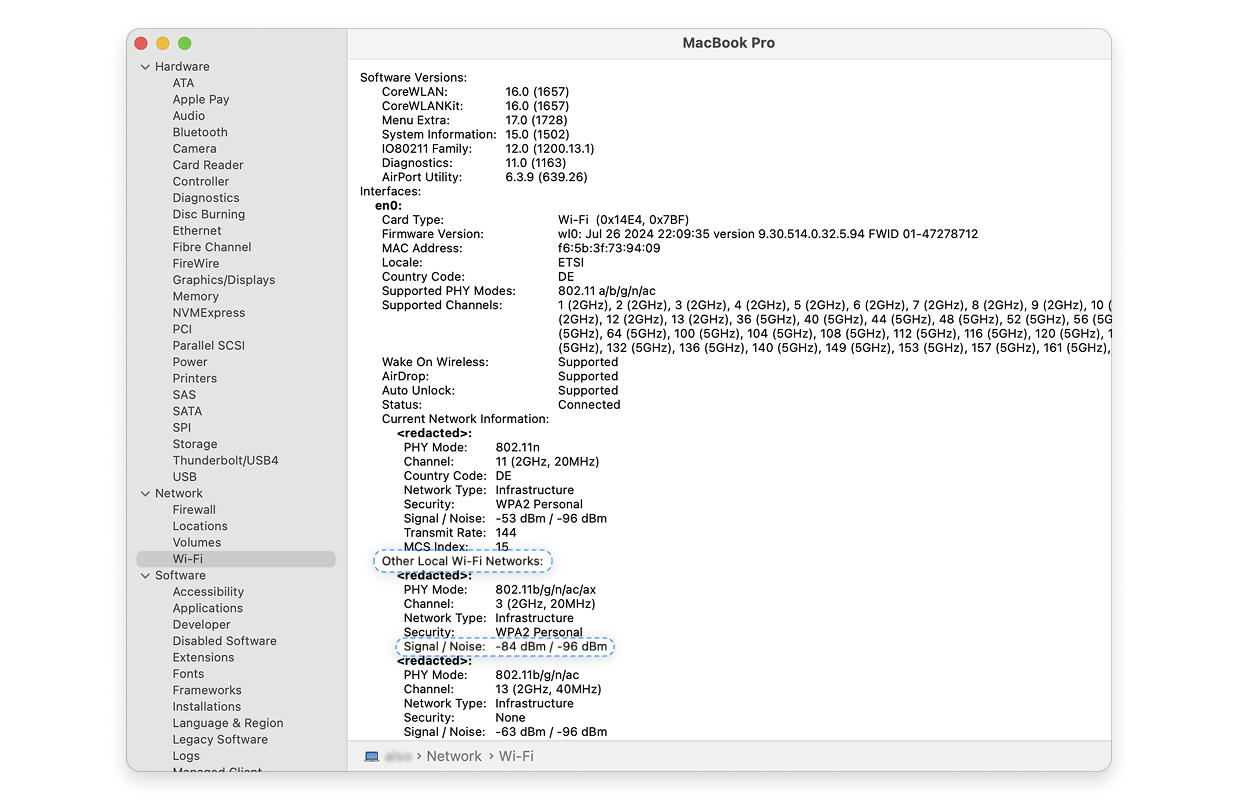
If you are unsure whether your Mac supports noise data collection for all networks, go to System Settings → General → About → System Report → WiFi scroll down to Other Local Wi-Fi Networks look at the Signal / Noise values. If they differ, then you will be able to properly collect noise data on your Mac in order to generate the heatmaps involving the noise levels in your network.
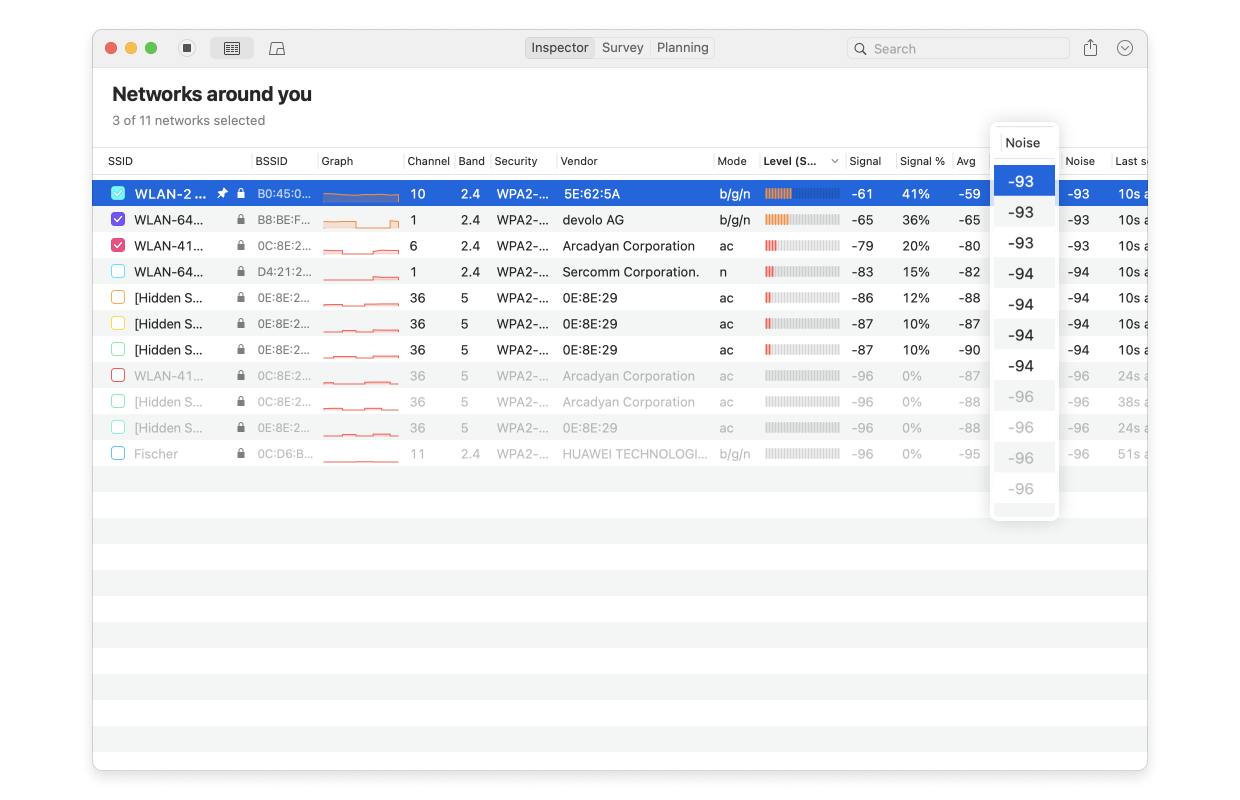
You can also use the Noise column in Inspector mode to see whether NetSpot is able to pick up the noise levels.
If your noise levels are too high, see Troubleshooting High Noise Level for strategies to correct this issue. NetSpot PRO and Enterprise users also have access to Automated Troubleshooting, to help identify and fix noise issues.
There are several ways you can adjust this heatmap view:
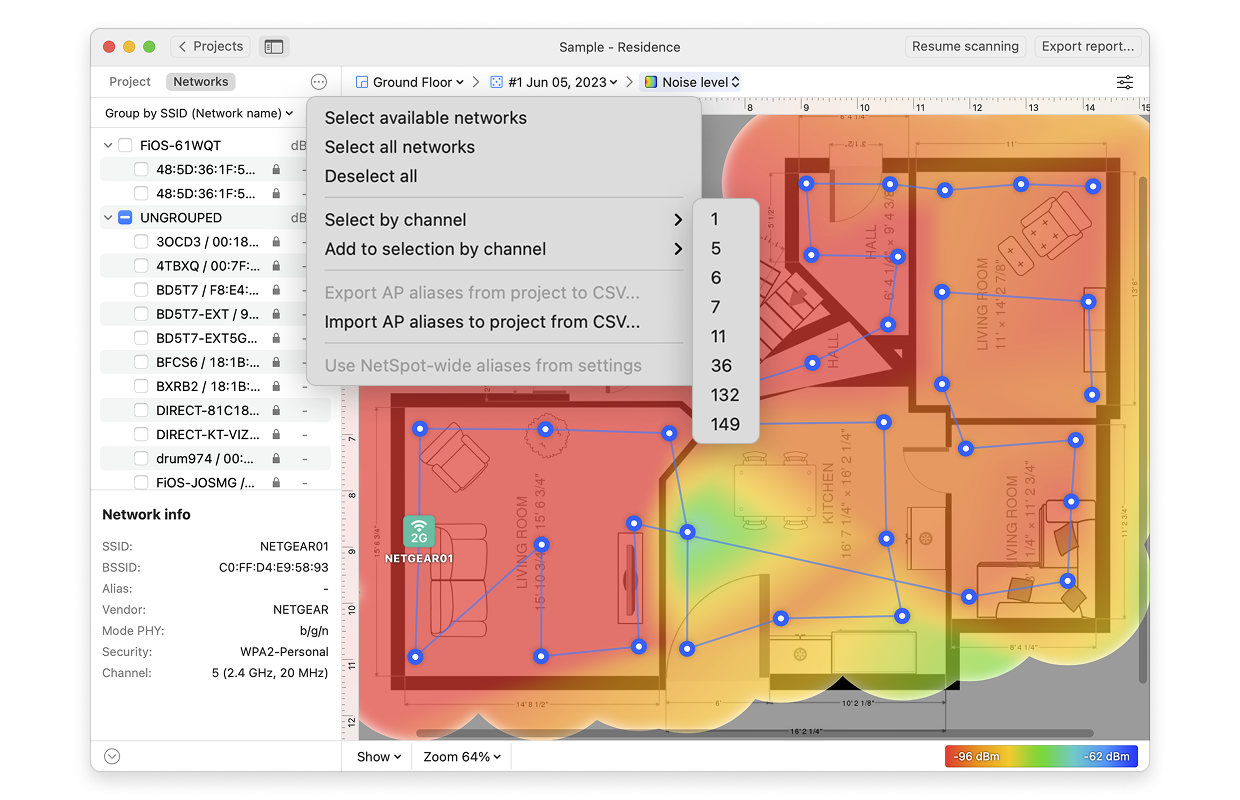
- Wi-Fi Network: Each Wi-Fi network detected can be mapped individually. Simply check the box next to the network(s) you wish to view on the left-hand side of the NetSpot window.
- Wi-Fi Channel: Click (
 ) at the top of the left panel in NetSpot (above the networks list) to visualize networks broadcasting on certain channels.
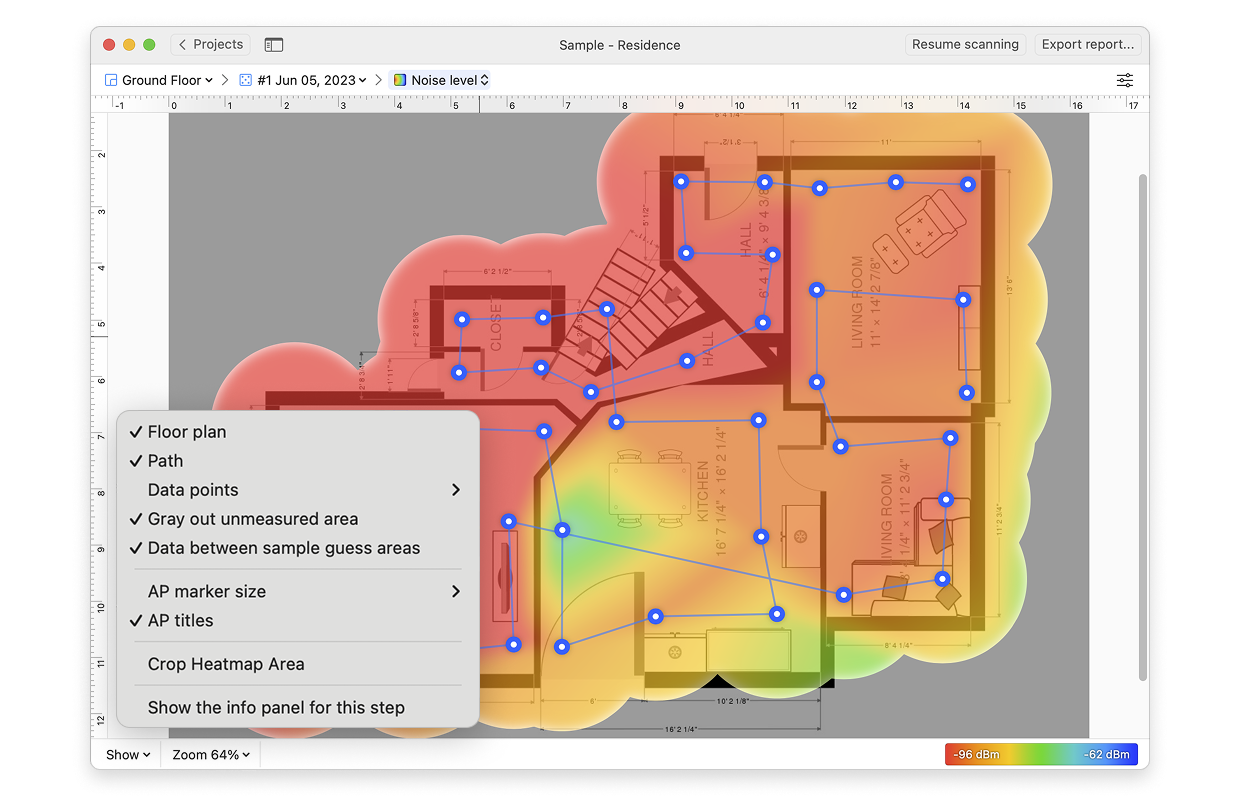
- View: By clicking on the Show menu in the bottom left corner of the canvas, you can choose whether to show your floor plan, path, sampling points, and AP titles on the heatmap, as well as several other adjustments.
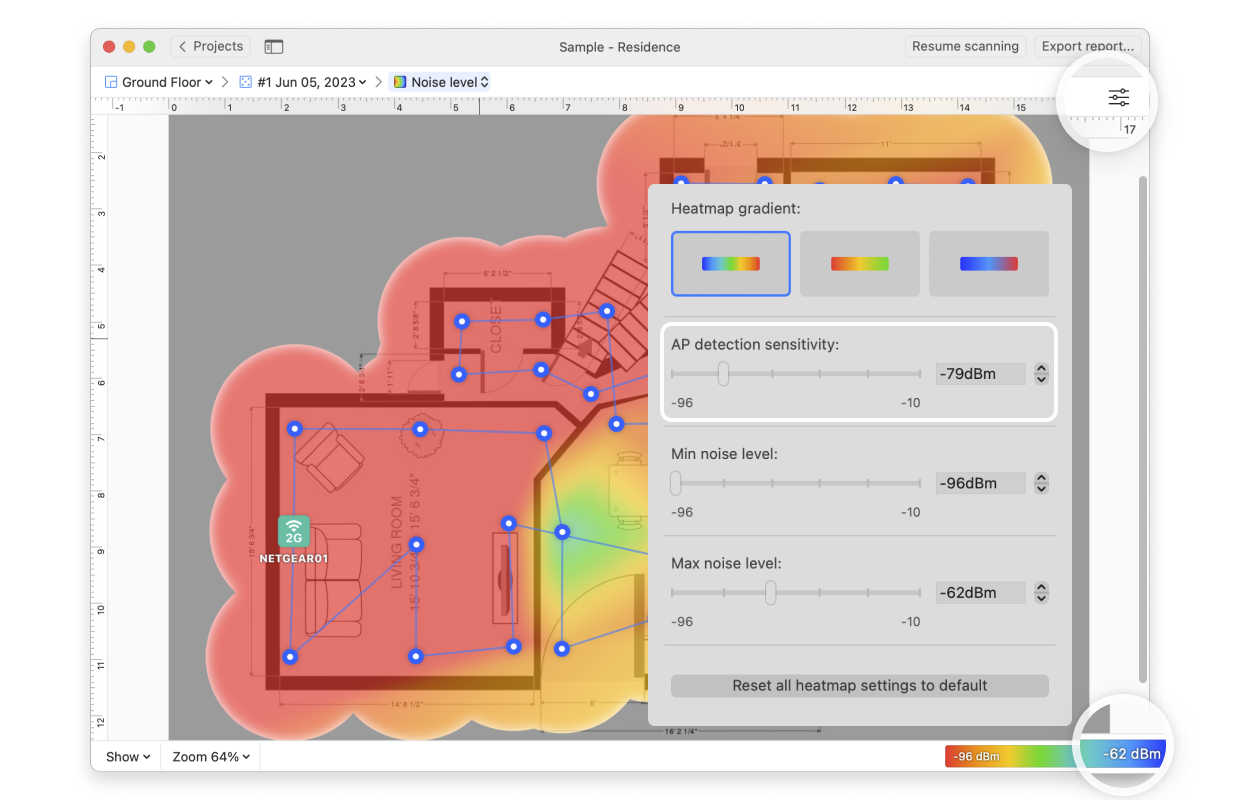
- AP Detection Proximity: By clicking the Heatmap Settings icon at the top right or by clicking on the gradient on the lower right, you can filter out weaker access points (APs) by adjusting the AP detection proximity slider. The default value is -50dBm.
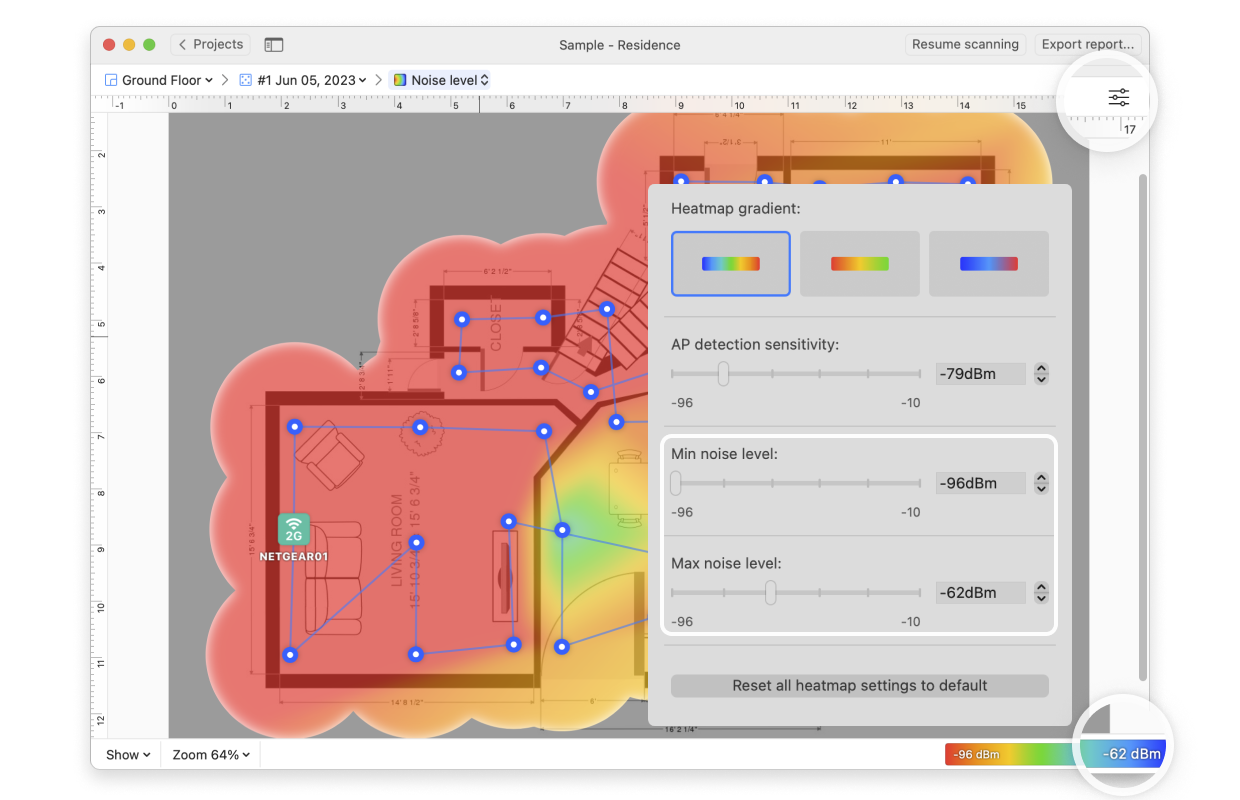
- Min/Max Noise Level: By clicking the Heatmap Settings icon in the upper right corner of the app window or by clicking on the gradient on the lower right, the color scheme of the noise level heatmap can be adjusted to a more convenient range. You can change the color combination by choosing from the three gradient options, and then the intensity can be changed by tweaking the visualized noise levels. The default range is set to -96dBm (minimum) and -10dBm (maximum).