When you don’t need to perform a full wireless site survey, but rather require a quick overview of the surrounding WiFi networks and want to spot any possible localized issues with coverage, Inspector Mode is the perfect analysis tool for the WiFi networks in vicinity.
💡 Use Cases:
- Spot the areas of weak signal, reduce Wi-Fi interference, monitor and improve network performance
- Identify a less congested channel (where possible)
- Determine signal drops
- Ensure your network uses up-to-date encryption
- Monitor hidden networks to account for the interference they can create
Using Inspector Mode
- Open NetSpot and switch to the Inspector mode by clicking the corresponding option at the top of the app window.
- You’ll see that the NetSpot’s WiFi Inspector actually has two modes: “Networks Around You” and “Signal Level and Noise Graphs”, between which you can switch using two buttons on the left side of the toolbar. By default the “Networks Around You” is active and when you choose Inspector Mode you can expect the collected data to start showing up.
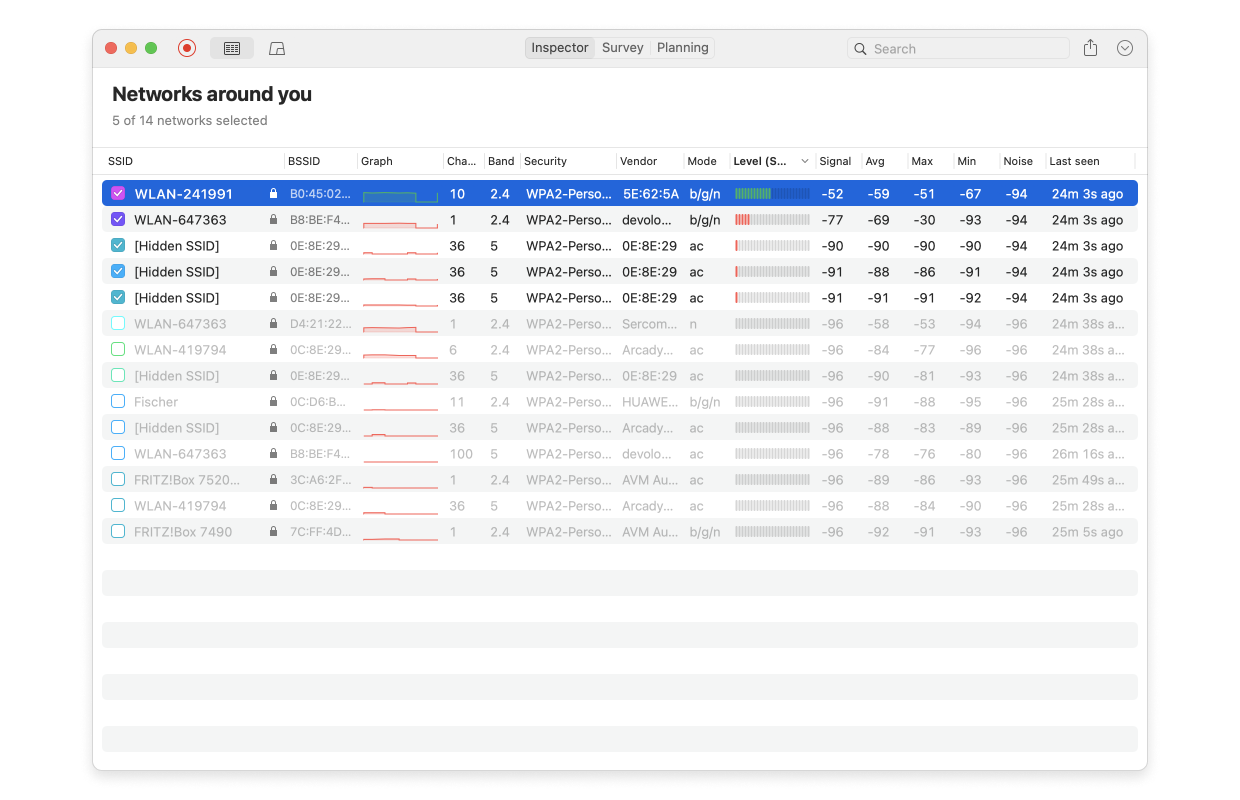
Networks Around You
“Networks Around You” shows all nearby networks (including the hidden ones) and their parameters. It’s more of an informational mode at this moment.
The key parameters that you see in the list of surrounding networks include (the full list of parameters shown in Inspector Mode can be found at the end of this post):
- Network names (SSID)
- Network identifiers (BSSID) – basically the MAC address for Ethernet devices
- Signal strength – displayed as an indicator (Level) with a numeric Signal value next to it
- Frequency
- Channel width
The other parameters may seem secondary, but offer some useful insight. For instance, the Vendor field helps you quickly identify your access point if you have devices from different manufacturers using the same SSID, and can’t remember the specific BSSID.
Looking at this list, you can assess the number of networks around you with strong signals and see how crowded the 2.4GHz, 5GHz, and 6GHz bands are.
Note: The 6GHz band is displayed in the app on MacBooks or Windows laptops with compatible adapters and if this band is allowed for use in your country.
Consulting the Inspector Mode data gives you a head start on setting up your access points properly. For example, if you live in an apartment and see a large number of networks in the 2.4GHz band, you can try hunting for less occupied channels and tweaking your setup in this range. But in reality it would be better to shift your focus to the less crowded 5GHz or 6GHz bands, if possible.
You can also check if your access point’s parameters align with your expectations. For instance, if you have an access point that supports the 802.11ax standard and 160MHz channel width, but the list shows only 80MHz for your device, it’s a clear hint that something in your access point setup needs attention.
Inspector Mode allows you to sort networks ⬆️⬇️ by various parameters just by clicking 🖱 the column headers.
Useful Tips:
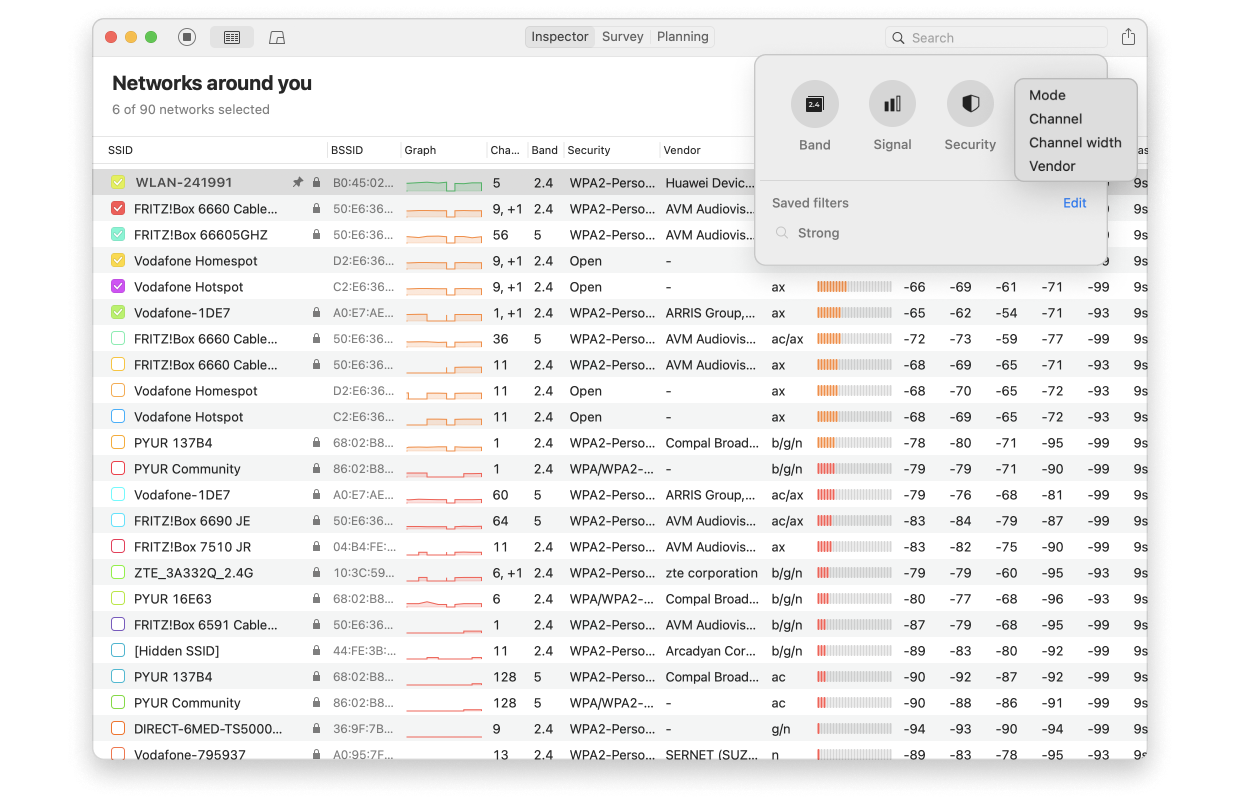
Hover over the SSID of any network to and pin 📌 it to the top of the list.
A Search/Filter 🔍 field in the top-right corner of the app window allows you to filter only the networks you are currently interested in. Filters can be saved as presets for future use.
[The lesser-known, but very useful] extra features
- You can right-click on a network’s row to open a context menu, allowing you to copy 📄 technical information to the clipboard and/or select networks ✔️ according to certain parameters.
- Right-clicking on the table header brings up a context menu that lets you customize the table columns 📊 to display exactly what you need. Not all columns with collected data are shown by default.
- Double-clicking on any network [in this mode/list] will open a window with a detailed table and historic scan records. Diving deeper can be especially useful if you have a single access point 🛜 and are moving around your space to evaluate its signal strength in various areas of interest.
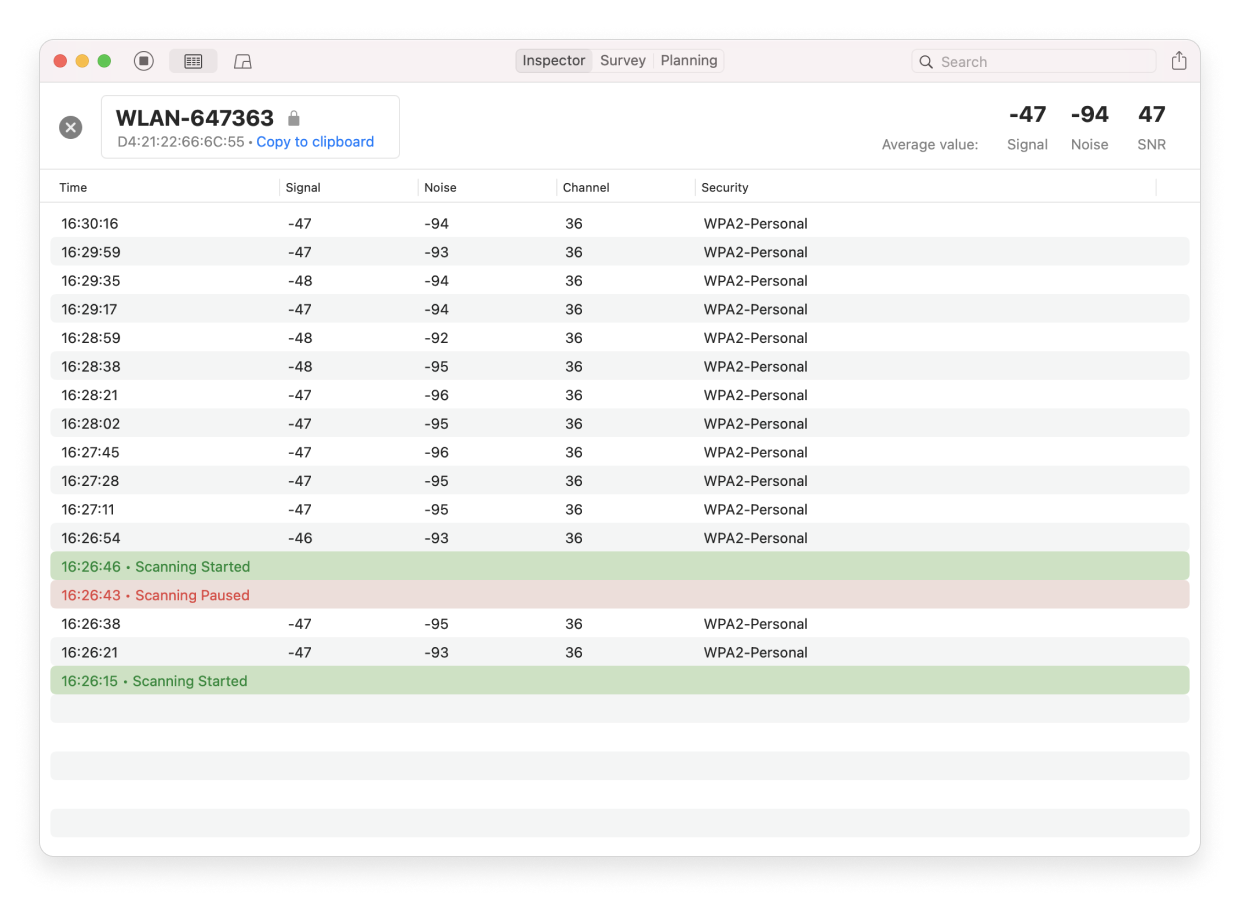
Diving deeper into a specific network real-time data
During the scanning for data you have several options:
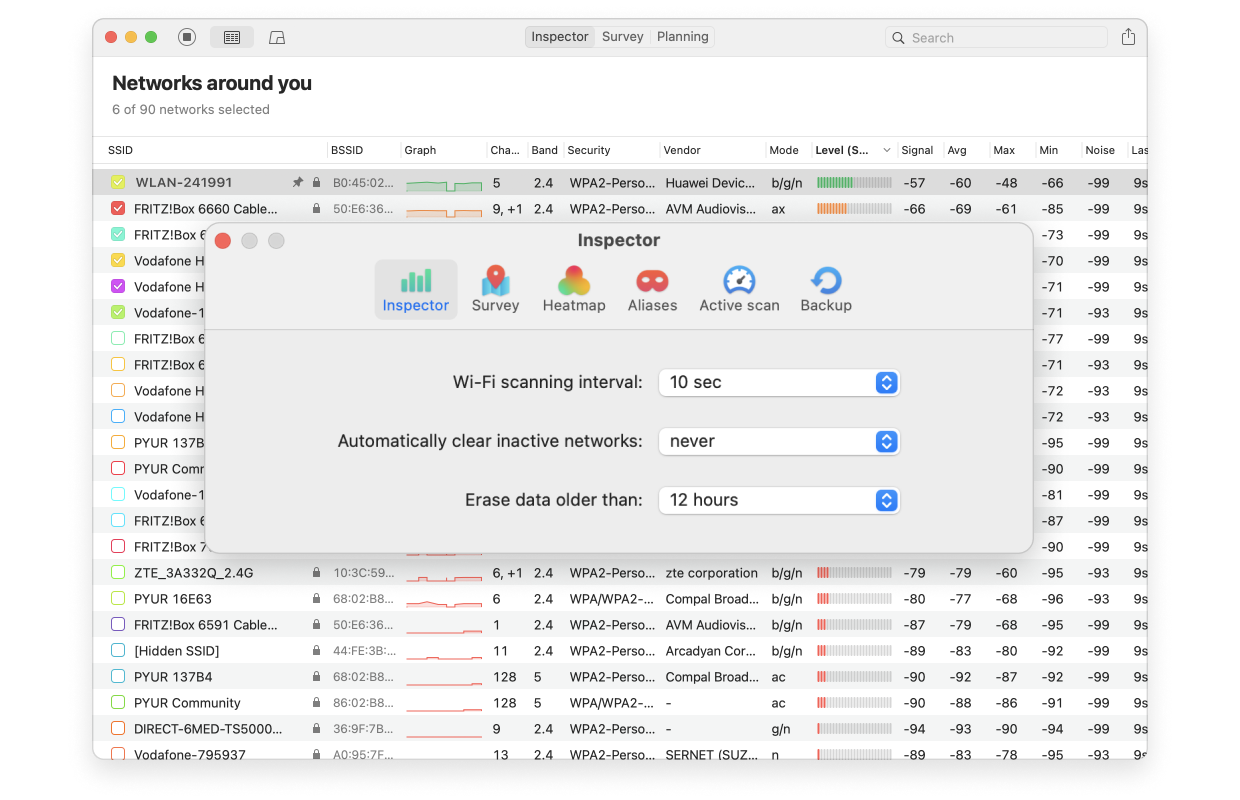
- To stop the data refresh, click Stop
 on the upper-left. The button will change its appearance and color to red. Click it to continue data collection from all discovered networks.
 - To adjust the data refresh interval (10, 30 or 60 seconds), use the NetSpot menu > Settings… > Inspector > WiFi scanning interval.
- To automatically clear inactive networks, go to NetSpot menu > Settings… > Inspector > Automatically clear inactive networks. By default this option is set to Never. You can set the inactive networks to be cleared automatically after 1, 5, 10, 30 or 60 minutes. This is only to remove inactive networks — active networks data will continue to be refreshed.
- To clear all the collected data, go to go to NetSpot menu > Settings… > Inspector > Erase data older than. By default this option is set to 12 hours, you can also set it to 24 hours, or to Never if you’d like to retain all the data that’s been collected.
- NetSpot Home, PRO and Enterprise allow exporting the collected data to a .csv file for further analysis, sharing with other apps or clients, or record-keeping. Click the Export button at the top right of the app window. Each network’s data is exported in a separate CSV file with its historical values by time for further processing.
To sum it up, “Networks Around You” mode…
- Provides vital information that helps set up your access points better.
- Helps you understand if your device is within a strong coverage area.
- Ensures you are aware of the security protocol currently in use, so you can select the proper security protocol to keep your network safe.
- Helps you choose a less congested channel to improve Wi-Fi performance.
- A periodic scanning table helps you pinpoint coverage gaps while moving around your space.
Signal Level and Noise Graphs/Charts
Graphs or Charts (the SECOND MODE of WiFi Inspector, signal level over time and channel representation) is a set of live visuals designed to help you fine-tune your access points and/or troubleshoot Wi-Fi issues. You can switch to this mode using the “Signal level and noise graphs” button in the top-left corner of the app window.
All networks you have selected in the Networks Around You mode will be shown in the Details view, matching their assigned color. By checking and unchecking the boxes, you can change what is shown in graphs. Clicking on a colored line on any of the graphs will automatically select the corresponding network in the main Inspector tab.
You’ll find 4 main feature groups here:
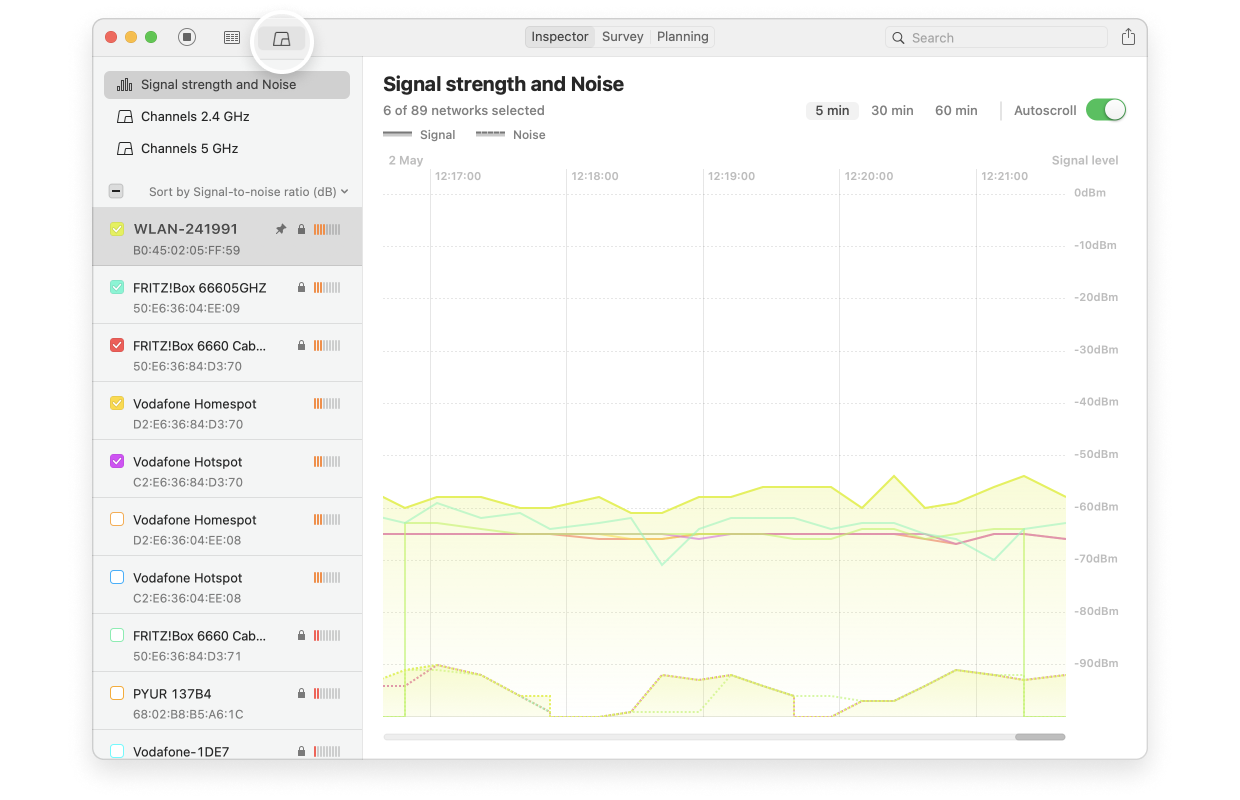
- Signal strength and Noise: This feature set provides an easy-to-read visual representation of the signal levels and consistency across different networks. The signal and noise levels are shown in real-time as a graph. Any network that you highlight in the main Inspector window will be highlighted on the graph as well.
If you let NetSpot run for an extended period of time (e.g., a few hours), the graph can reveal sudden drops in signal strength or complete signal loss. Such behavior might indicate hardware issues, misconfigurations, or other conflicts and problems that need attention.
Use the horizontal scroll at the bottom of the window to move backwards in time. Hold down the Shift key to scroll with your touchpad or mouse wheel. If the “Autoscroll” box at the top right is checked, the graph will move automatically showing the most recent data on the right. - Channels 2.4 GHz, Channels 5GHz, and Channels 6GHz: These are handy trapezoid-style graphs that visualize channel overlap in your area. They help you identify free channels for your access points or choose the least congested ones.
The selected networks broadcasting at 2.4 GHz are shown, as well as the range of channels that they cover. By default, the “Show average value for inactive networks” option at the top right is enabled. This way any currently inactive networks will be shown at their average known values. If you uncheck the box, inactive networks will not be shown at all. Inactive networks are represented by dotted lines, while the active ones — by solid.
The general recommendation is to configure your access points to use the least crowded frequency band in your area, typically 5GHz or 6GHz ✅. While these bands have shorter range and are more affected by obstacles (which might require you to invest in additional access points or extenders), this also works to your advantage by minimizing interference from neighboring networks, again, depending on how populated your wireless surrounding is. As a result, this helps you build a more isolated and reliable Wi-Fi setup.
Note: a) your access points might not allow manual channel adjustments, and b) neighboring “smart” access points can automatically change channels based on the environment, or their owners might tweak settings manually, effectively undoing your efforts, therefore periodical checks are encouraged.
To sum it up, the Graph mode…
- Can be great for troubleshooting intermittent issues; you can see if the signal drops at certain times or locations.
- Visually confirms if multiple networks use the same or adjacent channels, causing congestion and reduced speed.
- Shows all bands (2.4, 5, and 6 GHz) if supported by your hardware, helping you make an informed channel selection.
The following information is available for each detected network:
- SSID — the network name. If you see the padlock icon next to it, that means this network is password-protected
- BSSID — BSSID – MAC address
- Alias — the AP alias, double-click to add one
- Graph — the visual representation of the signal level
- Signal — the signal level RSSI in dBm. The closer it is to zero, the stronger the signal is
- Signal % — 100% being the best
- Channel — 1, 6, 11, etc. NetSpot also lists additional channels, it’s important to know it, as it actually influences the interference parameters. If you see a channel listed as X,+1, the channel is expanded towards a larger number, if it’s something like X,-1, it’s been reduced
- Frequency — the channel base frequency
- Channel width — 20, 40, 80 or 160 MHz
- Band — 2.4 GHz, 5 GHz, 6 GHz (the latter available for those adapters that support it)
- Security — WEP, WPA, WPA2, WPA3, etc.
- Vendor — manufacturer information for Access Points
- Type — network type: can be either “managed” (a regular wireless network with a router) or “ad-hoc”
- Mode — 802.11 a/b/g/n/ac/ax/be
- Level SNR — your Signal-to-Noise Ratio level on macOS, with higher numbers being better
- SNR — the actual signal-to-noise ratio in dB
- Avg — average signal level over the duration of the scan
- Max — maximum signal level registered during the scan
- Min — minimum signal level registered during the scan
- Noise — numbers closer to zero are worse
- Noise % — 100% being the worst
- Last seen — when the network was last detected since you started scanning
Why NetSpot?
- Easy to use and doesn’t require extra hardware
- Works on both Mac and Windows. NetSpot for Android is also a fairly powerful app
- Three great simple yet powerful modes: Inspector, Survey, Planning
- Inspector mode is completely free and doesn’t require a Home, Pro or Enterprise license
Note: Modern access points and Wi-Fi infrastructure often don’t require manual configuration. Mesh networks and smart access points are frequently used, where interaction is handled automatically by algorithms built in by manufacturers. These APs can adjust their power levels based on neighboring points, switch to power-saving mode when there are no active connections, and automatically change channels to optimize performance. However, many access points still allow manual control, and WiFi Inspector is the part of NetSpot that helps you navigate it with ease.