For intermittent interference and reports.
Software: Windows.
Hardware: Wi-Spy Lucid (2.4, 5, and 6 GHz); older Wi-Spy DBx (2.4 and 5 GHz).
Looking for the best WiFi spectrum analyzer app? Explore 6 real RF spectrum analysis tools, compare their features and compatible hardware, and find out which one can help you track down hidden Wi-Fi interference.
Most people have come across a Wi-Fi analyzer app. NetSpot, Wi-Fi Analyzer, and inSSIDer, for example, can show the networks around you, the channels they're using, and how strong their signals are. That's often enough to spot a poor channel choice or weak coverage.
But what if the signal looks perfectly healthy and the connection still keeps dropping? That's where a WiFi RF spectrum analyzer comes in. It looks at radio energy, not just the Wi-Fi networks your adapter can identify.
Both types of tools help troubleshoot wireless problems; they simply look at different parts of the problem. And there's one important catch with spectrum analysis: the app usually needs dedicated RF hardware to do its job.
These tools come in different forms, from free viewers paired with USB analyzers to professional handheld testers. Below, we'll look at seven options and where each one makes the most sense.
A regular Wi-Fi analyzer reads information from Wi-Fi access points. It can tell you which SSIDs are nearby, where their channels sit, and what signal levels your device sees. A spectrum analyzer works a level below that. Its receiver samples radio-frequency energy across a selected band, including transmissions that aren't Wi-Fi at all.
Think about a 2.4 GHz network that becomes unreliable whenever someone uses a wireless video device or switches on an older microwave. An ordinary network scan might show no new access points and no obvious change in signal strength. A spectrum capture may show bursts of energy where the Wi-Fi network is trying to communicate.
That doesn't mean the graph will magically name the culprit. It shows a pattern worth investigating. You still need to check when the interference appears, where it's strongest, and whether turning off or moving the suspected device actually improves the connection.
Most built-in WiFi adapters are designed to receive and decode WiFi traffic. They aren't general-purpose wideband RF measurement instruments, and normal app access doesn't turn them into one. To inspect raw spectrum activity, software such as Chanalyzer uses a compatible RF receiver — often a USB device like Wi-Spy Lucid. Other systems have spectrum hardware built into a larger measurement unit, such as Ekahau Sidekick 2, or use a dedicated adapter, such as NetAlly NXT-2000.
The distinction matters when shopping. A free app might still require hundreds of dollars' worth of hardware. And a Wi-Fi packet-capture adapter isn't automatically a spectrum analyzer: it can record Wi-Fi frames without measuring unrelated radio energy.
If you've never used an RF spectrum analyzer before, the screen might catch you off guard. Instead of a familiar list of Wi-Fi networks, you could see moving lines, colorful patterns, bar charts, or even a plain table of numbers. It depends on the software and the view you've selected.
Here's what those different displays actually show.
Live Spectrum Trace. This is probably the easiest one to recognize. A line moves across the screen, with frequency along the bottom and RF power (usually in dBm) on the side. Peaks rise and fall as radio activity changes. Some analyzers also show average and maximum readings, so you can see both what's happening now and what was picked up earlier.
Source: NetAlly User Guide :
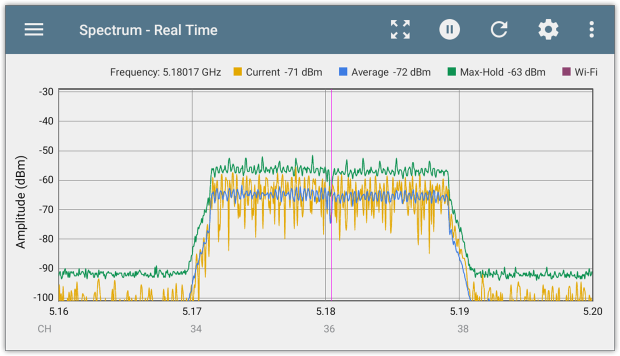
What it shows: Where RF energy is present and how strong it is.
Density / Persistence View. At first glance, this looks similar to a live spectrum graph, only much more colorful. Instead of showing just the latest measurement, it combines multiple readings. The colors indicate how often a signal appears at a particular frequency and power level. That makes it easier to tell constant interference from occasional bursts.
Source: NetAlly User Guide :
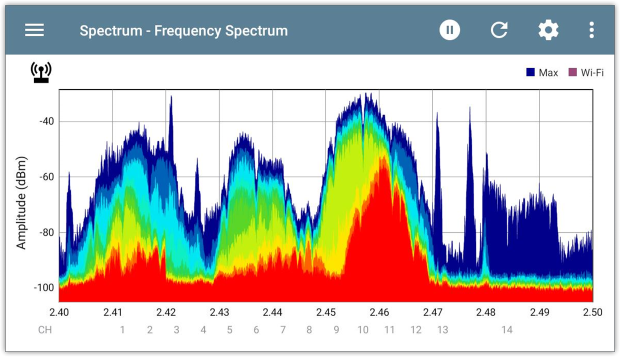
What it shows: How frequently RF activity appears at different frequencies and signal levels.
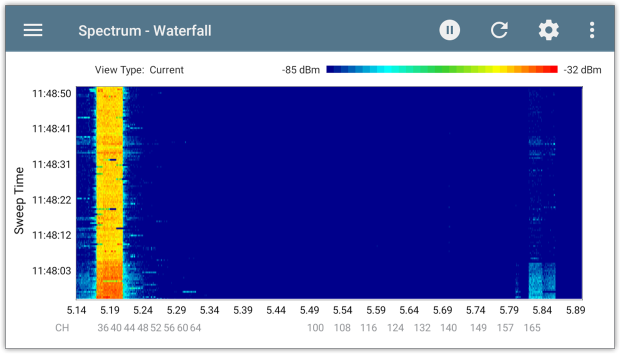
Waterfall / Spectrogram. Here's where things start looking a little less familiar. A waterfall uses colored bands and patches to show how radio activity changes over time. Each new measurement adds another strip to the display. Short bursts, repeating interference, and signals that come and go become much easier to spot.
Source: Ubiquiti airView Guide :
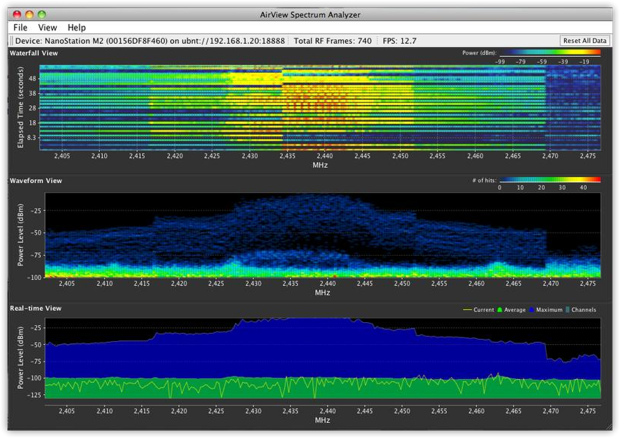
What it shows: When RF activity occurs, how long it lasts, and which frequencies are affected.
Channel Utilization and Other Summary Charts. Not everything comes as a complicated RF graph. Some analyzers use simple bars and percentages to show how busy particular channels are. Others plot these values over time, so you can see when activity increases or drops. The exact calculation depends on the software.
Source: Cisco Spectrum Charts Guide :
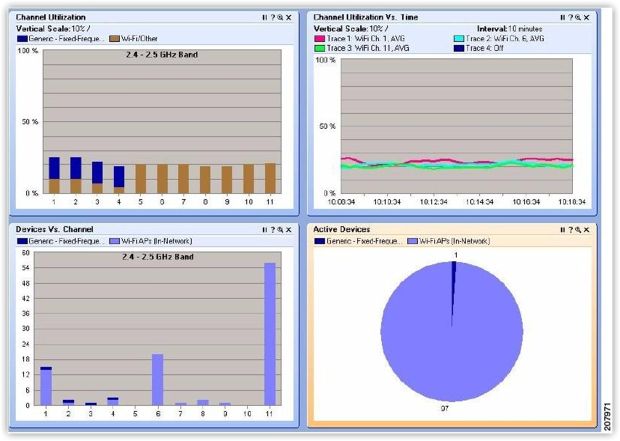
One thing to keep in mind: RF utilization based on detected radio energy isn't necessarily the same as Wi-Fi channel utilization measured from network traffic. Check how the analyzer calculates its percentages.
What it shows: Channel activity, interference levels, or how those measurements change over time.
Numerical Tables. Yes, sometimes the results are just numbers. Rather than making you interpret a graph, the software lists measurements such as channel number, utilization percentage, average power, maximum power, and noise floor. This is especially handy when comparing channels or preparing a report.
Source: Chanalyzer 6 screenshot :
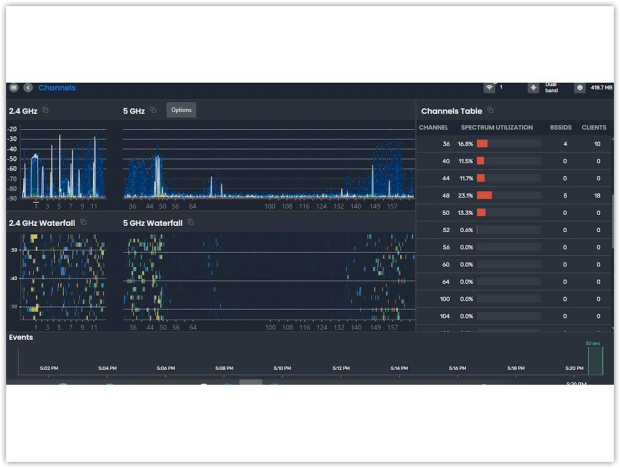
What it shows: Specific measurements and statistics for individual channels or frequencies.
3D Spectrum / Waterfall View. Some more advanced RF tools take things a step further with 3D displays. Instead of a flat graph, you get a landscape of peaks and valleys representing RF activity across frequencies and time. It can make patterns easier to visualize, although a regular 2D graph is often more practical for reading exact measurements.
Source: Aaronia official website :
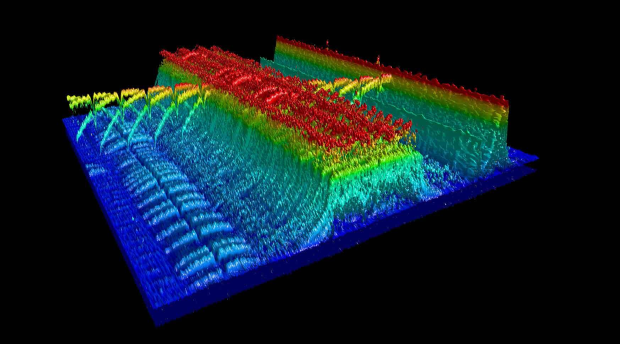
What it shows: How the spectrum changes over time, with signal strength represented as a three-dimensional surface.
You won't necessarily find all these views in one app. Most Wi-Fi-focused spectrum analyzers concentrate on a few core displays, while more specialized RF tools offer additional ways to explore the data. And whatever the view, remember that a suspicious pattern isn't the same as a confirmed source of interference.
There are quite a few capable WiFi spectrum analyzer apps out there, but they aren't all designed for the same job. Some are great for tracking down interference that comes and goes. Others are more convenient for checking RF activity as you walk around a building, while some are built specifically for site surveys, detailed reports, or everyday field troubleshooting.
And since each app works with specific hardware, choosing the software is only half the decision. Let's take a closer look at the available options, what they're best suited for, and the equipment you'll need to use them.

For intermittent interference and reports.
Software: Windows.
Hardware: Wi-Spy Lucid (2.4, 5, and 6 GHz); older Wi-Spy DBx (2.4 and 5 GHz).
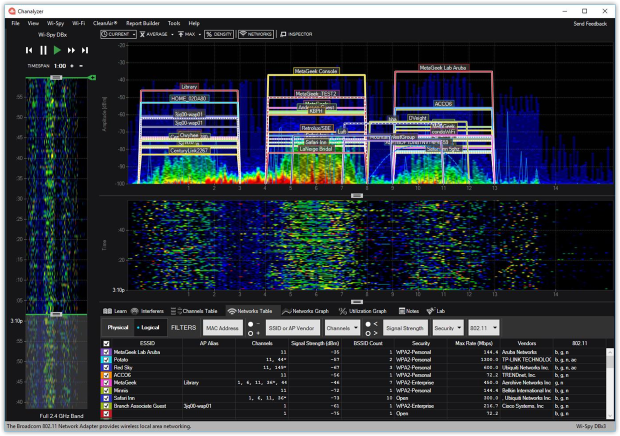
Chanalyzer is a good fit when someone reports, “It breaks a few times a day, but never when IT is watching.” You can record a spectrum session, play it back, inspect the density and waterfall views, and compare the RF activity with nearby Wi-Fi networks. Its interference signatures can suggest what to investigate; a directional Device Finder antenna helps when it's time to walk around and locate a source.

For portable checks with a two-piece RF setup.
Software: iPhone and iPad.
Hardware: WLAN Pi Go plus Wi-Spy Lucid.
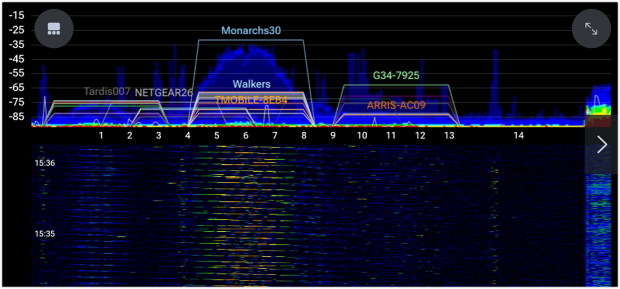
ChanLite takes a fairly serious RF setup and gives it a mobile interface. Instead of carrying a laptop, you can walk around with an iPhone or iPad and inspect the spectrum while you're near the equipment or problem area. The app is free, which is appealing if you already own the accessories.
For checking spectrum alongside network performance.
Software: iPhone and iPad.
Hardware: Ekahau Sidekick 2; an applicable Ekahau subscription is required.
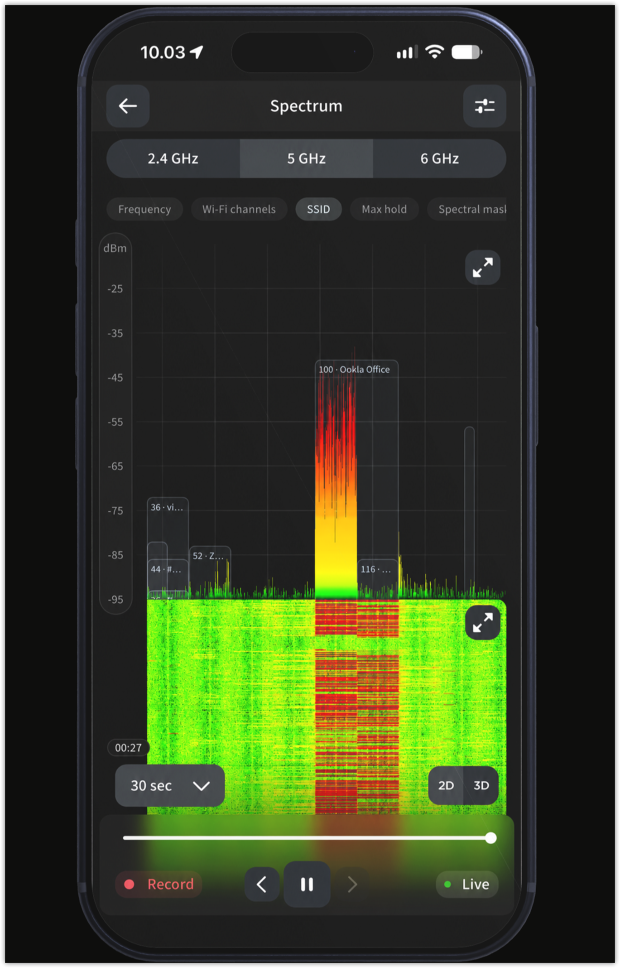
Ekahau Analyzer is aimed at people who need to validate a working Wi-Fi network, not just stare at RF peaks. With Sidekick 2 attached, it can show spectrum activity across 2.4, 5, and 6 GHz, including a waterfall view. It also brings Wi-Fi health information and speed testing into the same troubleshooting workflow.
Here's where that becomes useful: a user complains that a video call stutters, or a speed test suddenly collapses. You can look at what happened to channel activity around the same time. It's a stronger starting point than judging the network by signal strength alone, though a simultaneous spike still doesn't prove cause and effect.
For matching spectrum activity to the floor plan.
Software: Windows and macOS.
Hardware: Wi-Spy Lucid; legacy Wi-Spy DBx and WiPry Clarity are also supported.
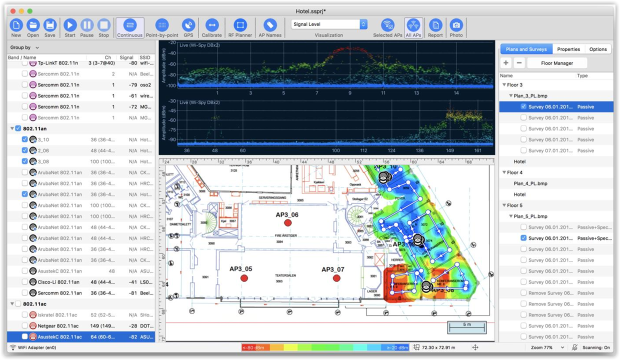
Some issues are frustratingly local. A few desks lose connectivity, while the office next door is fine. TamoGraph makes spectrum analysis part of a site survey, collecting RF readings as you move through the building. Later, you can return to a point on the floor plan and inspect the spectrum data captured there.

For on-site measurements and team review.
Software: iPhone, iPad, and supported Macs.
RF hardware for true spectrum: Oscium Nomad plus Wi-Spy Lucid (or another compatible RF sensor); Hamina Onsite subscription required.
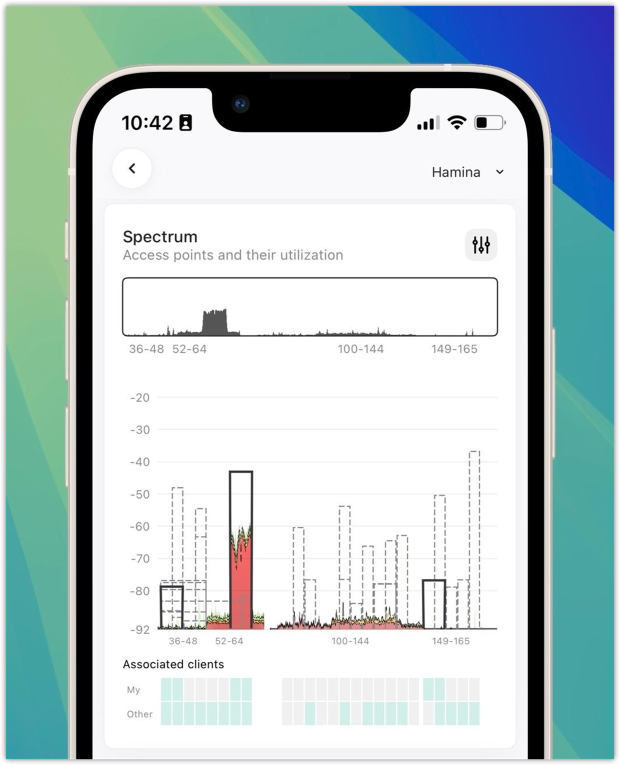
Hamina is interesting for the work that happens after a survey. You collect measurements on site, add photos or notes, and then examine results and interactive reports through its broader planning and cloud workflow. With the right hardware, Onsite can also display raw RF energy rather than only Wi-Fi channel-utilization data.

For a dedicated handheld tester.
Software: Spectrum app on AirCheck G3 Pro.
RF hardware: NetAlly NXT-2000 portable spectrum analyzer.
If your day involves moving between wiring closets, classrooms, and client sites, a dedicated tester can be easier than balancing a computer and USB accessories. NetAlly's Spectrum app runs directly on the AirCheck G3 Pro. Attach an NXT-2000 and you get RF analysis across 2.4, 5, and 6 GHz.
Do you always need a dedicated spectrum analyzer? Not necessarily. If the problem is weak coverage, poor access-point placement, or channel congestion caused by nearby Wi-Fi networks, a regular Wi-Fi analyzer may give you enough information to fix it. NetSpot, for example, can help map wireless coverage, signal-to-noise ratio, and interference-related issues.
On some Macs, its Noise Level heatmap can also show where elevated reported noise levels appear, provided the Mac supplies the necessary noise readings. That is not the same as capturing raw RF spectrum, but when a normal scan looks fine and the Wi-Fi still struggles, genuine spectrum analysis becomes much more useful.
With suitable hardware, it lets you catch radio activity that a Wi-Fi network scanner simply can't see. The skill is in reading the pattern, tracing it to a real source, and then checking that the network actually performs better once you've made a change.

Yes, but you'll generally need compatible external RF hardware. An app such as ChanLite can display spectrum measurements on an iPhone or iPad using a supported accessory setup. The phone's built-in Wi-Fi radio isn't a substitute for a dedicated RF spectrum analyzer.
Yes. That's one of the main reasons to use one. A genuine RF spectrum analyzer can reveal radio energy from devices that don't appear in a normal Wi-Fi network scan, such as certain cordless phones, wireless video transmitters, and other nearby electronics. It may show their signal patterns without automatically identifying the exact device.
Yes. Chanalyzer Lite is a free desktop option, and ChanLite is available free for supported iOS devices. The important catch is that both require compatible RF hardware to perform real spectrum measurements.
If you're troubleshooting interference on a 6 GHz Wi-Fi network, you'll need an analyzer that covers the frequencies you're using. Older dual-band devices that only measure 2.4 and 5 GHz can't inspect that spectrum. Check the hardware's actual frequency range before buying.
Wi-Fi Site Surveys, Analysis, Troubleshooting runs on a MacBook (macOS 11+) or any laptop (Windows 7/8/10/11) with a standard 802.11be/ax/ac/n/g/a/b wireless network adapter.