Please note: this heatmap is only available to PRO and Enterprise users.
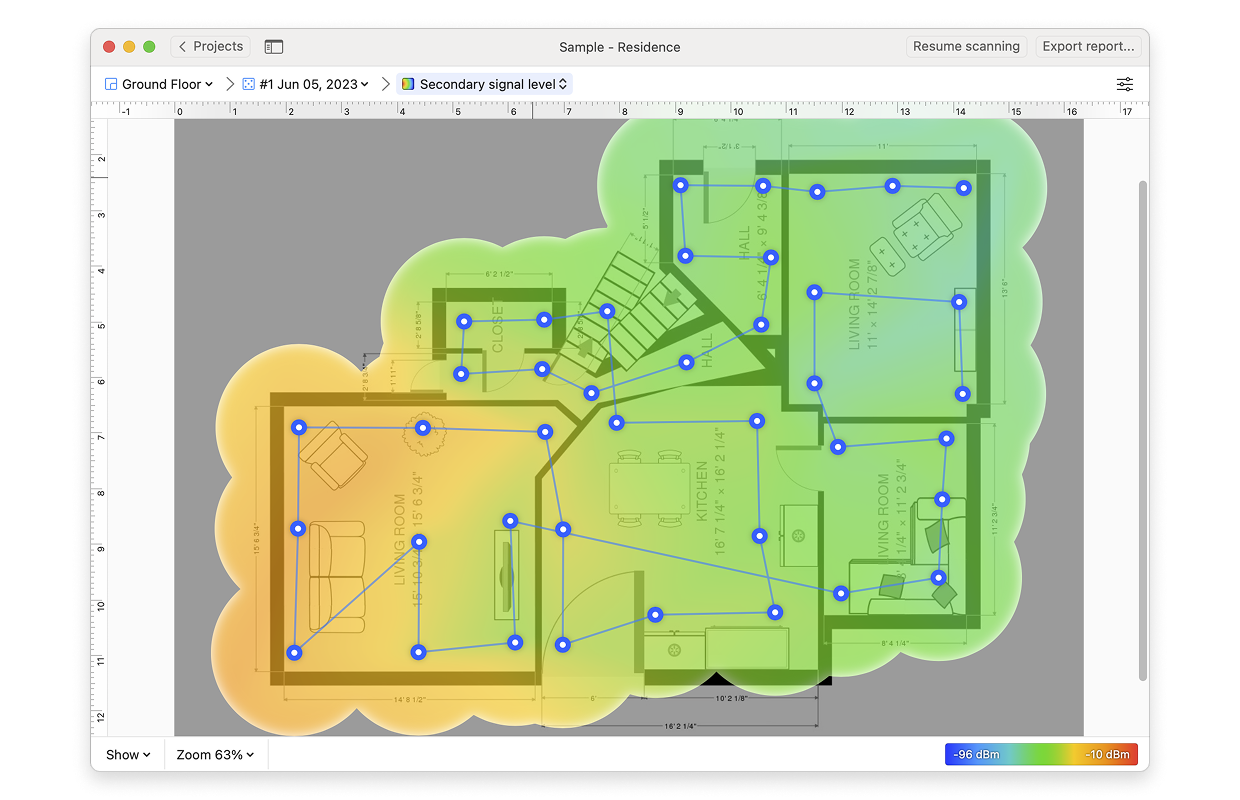
Secondary Signal Level refers to the second strongest Wi-Fi signal (measured as RSSI — Received Signal Strength Indicator) detected at a specific location. This metric is crucial in environments with multiple access points (APs), as it provides insights into the backup signal strength available when the primary signal weakens or becomes unavailable.
By analyzing the secondary signal level, you can identify areas where clients may struggle to transition between access points or experience degraded performance. This visualization helps assess the availability and quality of the secondary wireless signal, therefore ensuring the stable connection if the primary signal weakens or becomes unavailable.
There are several ways you can adjust this heatmap view:
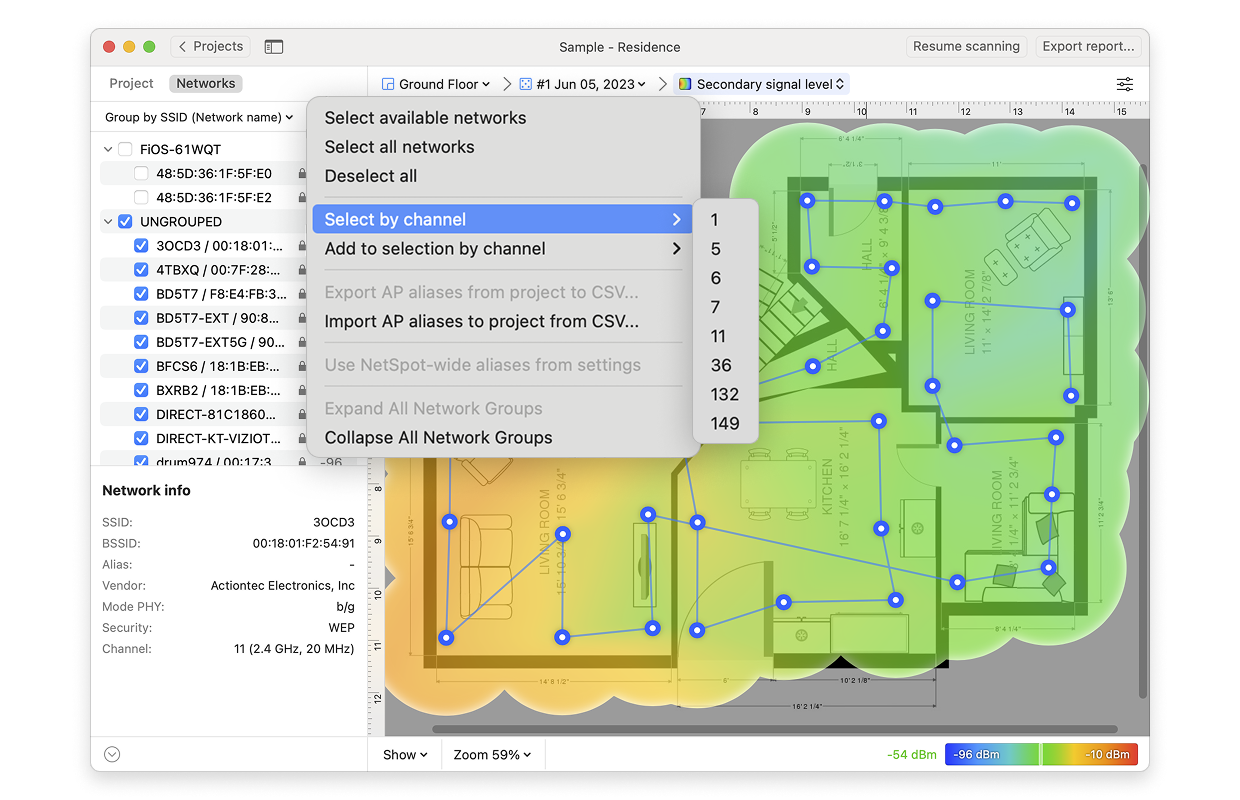
- Wi-Fi Network: Each Wi-Fi network detected can be mapped individually. Simply check the box next to the network(s) you wish to view on the left-hand side of the NetSpot window.
- Wi-Fi Channel: Click (
 ) at the top of the left panel in NetSpot (above the networks list) to visualize networks broadcasting on certain channels.
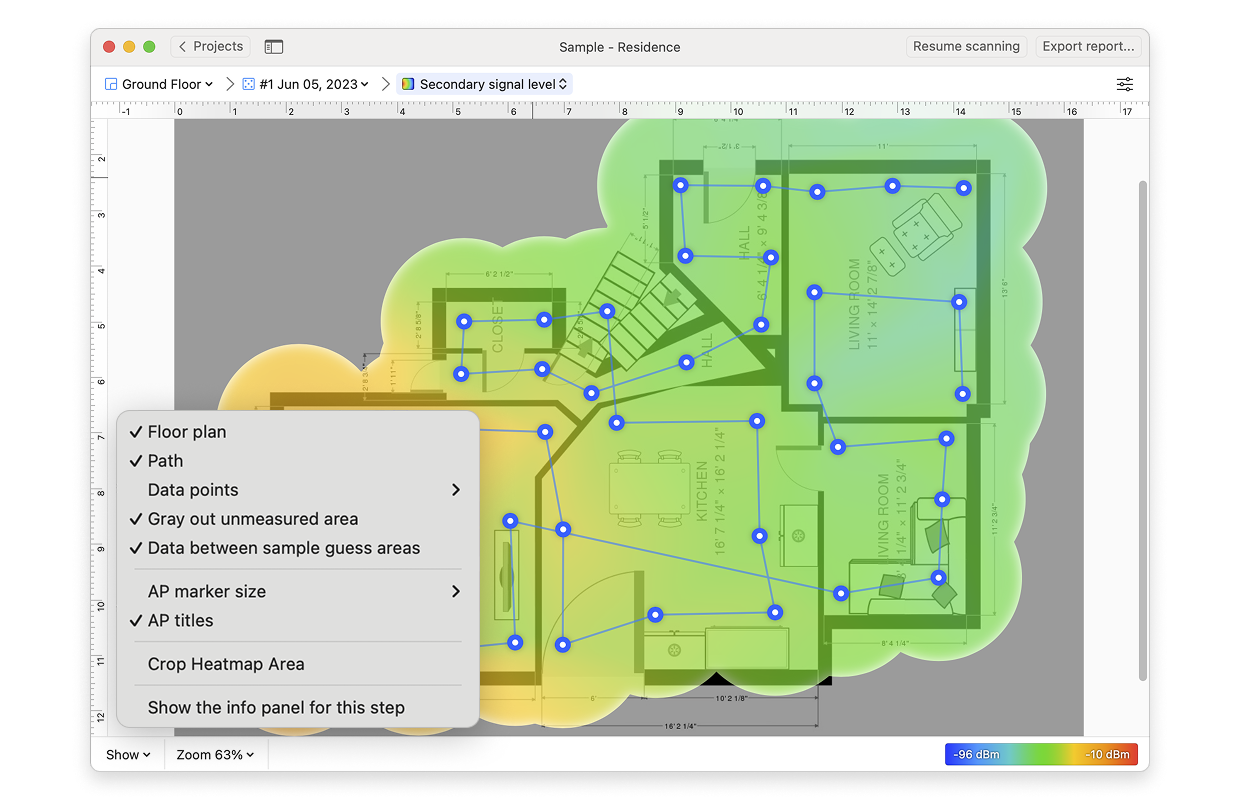
- View: By clicking on the Show menu in the bottom left corner of the canvas, you can choose whether to show your floor plan, path, sampling points, and AP titles on the heatmap, as well as several other adjustments.
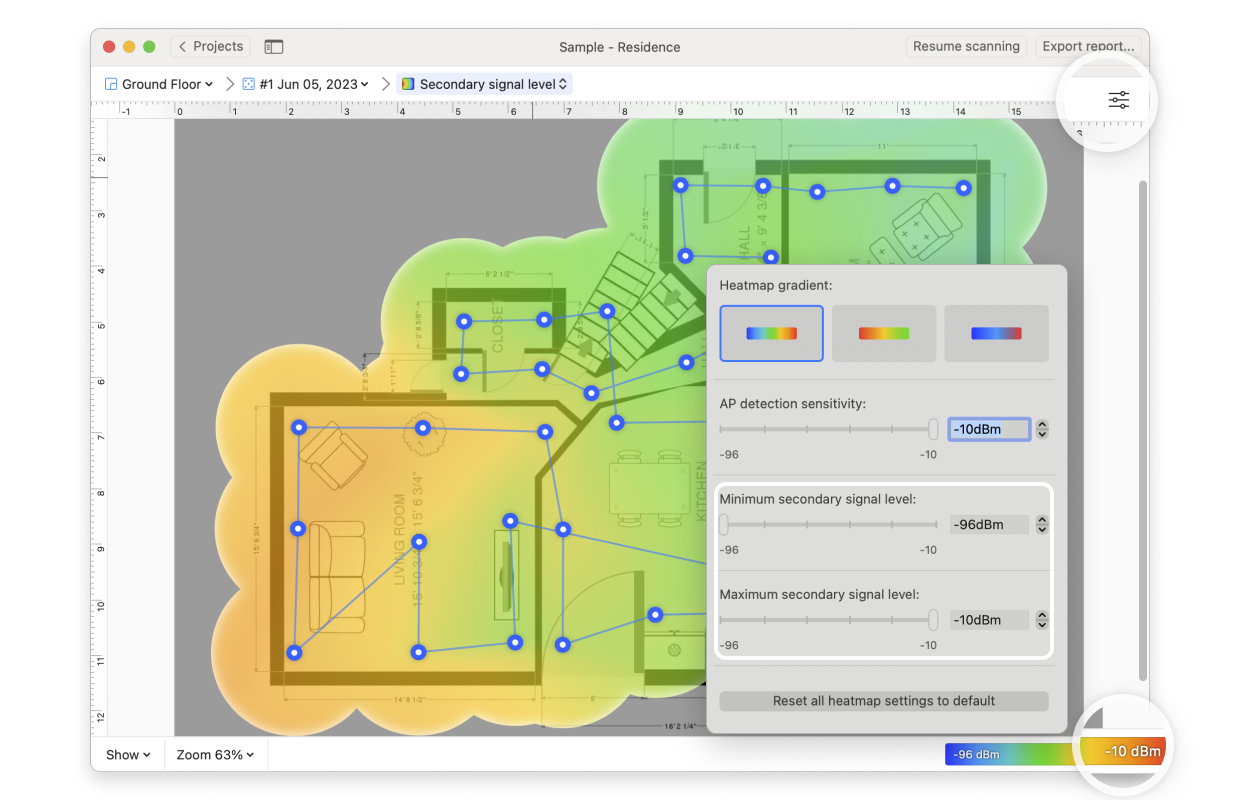
- AP Detection Proximity: By clicking the Heatmap Settings icon at the top right or by clicking on the gradient on the lower right, you can filter out weaker access points (APs) by adjusting the AP detection proximity slider. The default value is -50dBm.
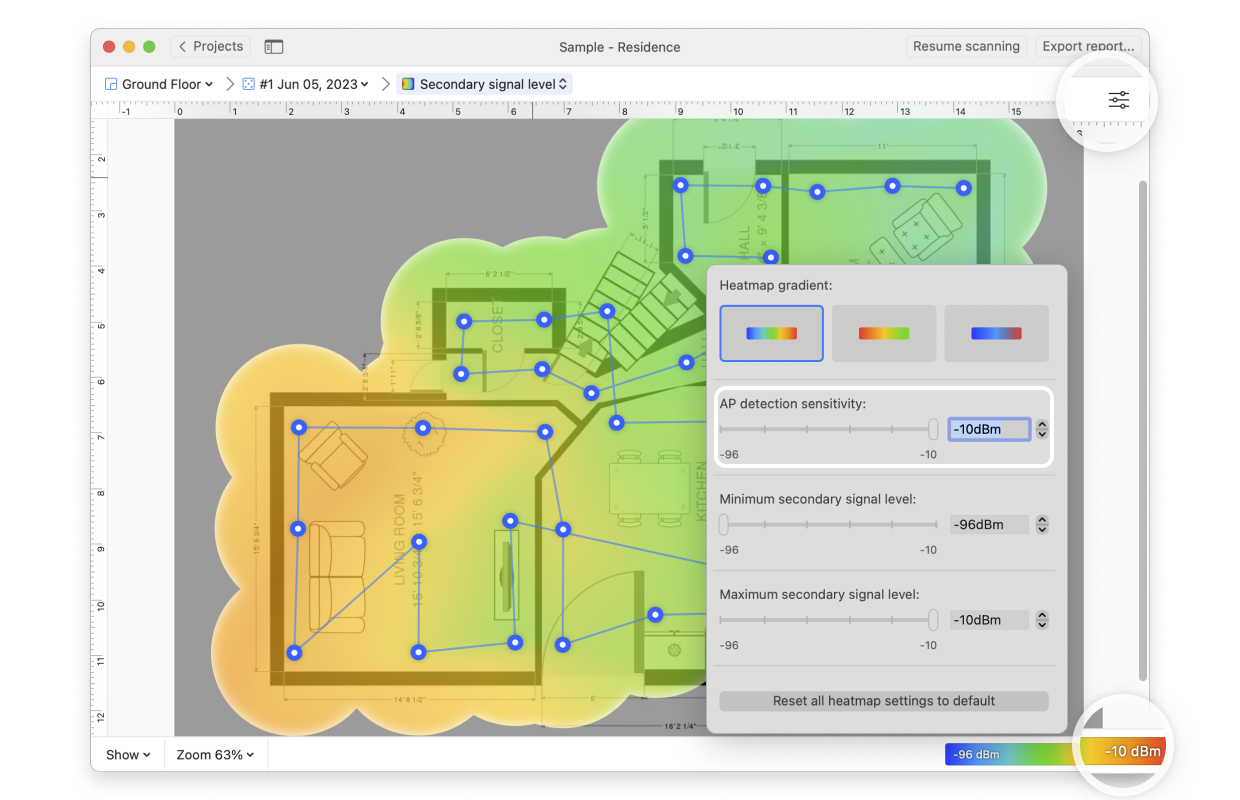
- Min/Max Secondary Signal Level: By clicking the Heatmap Settings icon in the upper right corner of the app window or by clicking on the gradient on the lower right, the color scheme of the secondary signal level heatmap can be adjusted to a more convenient range. You can change the color combination by choosing from the three gradient options, and then the intensity can be changed by tweaking the visualized signal levels. The default range is set to -96dBm (minimum) and -10dBm (maximum).