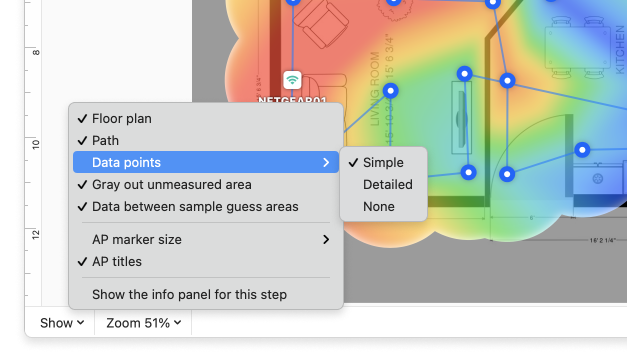
The menu that you can see below the heatmaps has some rather useful quick access settings right at your fingertips. The Show, Zoom, and the Gradient can all be clicked to call the following options:
NetSpot WiFi manager for macOS is available
Show:
- Floor plan: Uncheck to hide the area map and only see the signal distribution throughout the surveyed space. The floor plan won’t show until you tick the option again.
- Path: Uncheck to hide the blue lines that connect the data points (showing the path you walked when taking the readings). The path will stay hidden until you tick the option again.
- Data Points: You have three choices for the blue circles representing data points on the map: None, Simple or Detailed. “Detailed” shows the highest level of the parameter corresponding to a currently displayed heatmap type. Click on the data point to see the levels of this parameter for each detected network broadcasting in that spot. Selecting “None” will hide the blue data points on the map, while “Simple” setting will display the basic data point icons without any technical information on them.
- Grey Out Unmeasured Area: When ticked, this option provides for a more contrasting view.
- Data between sample guess areas: When this option is ticked, NetSpot will do its best to fill out the areas you may have missed while walking out your survey pattern. It is an estimated signal data based on real collected data in surrounding data points.
- AP marker size: choose a convenient display size for your AP markers – small, medium, or large.
- AP titles: Untick to hide the names of the APs shown on the heatmap.
- Hide/Show the Info panel for this step: We try to make NetSpot very easy-to-use and informative. Once you’ve read the explanation of what a certain heatmap means, you may decide not to see the hint anymore.
Zoom:
Here you can zoom in or out on the heatmap, or select either the Fit to View option or Fit the Surveyed Area.
Gradient icon:
The gradient icon you see at the bottom of NetSpot window is clickable and offers some useful options:
- Choose the color scheme of the gradient that works best for you.
- Set the AP detection sensitivity
- The default range of signal-to-noise ratio is set to 0dBm (minimum) and 86dBm (maximum). Use min and max signal-to-noise ratio sliders to get more helpful results: set the minimum and maximum levels to a smaller range based on your target ratio.
Get NetSpot WiFi tool for Windows
updated: October 17, 2024 author: