Note that users of the FREE edition of NetSpot can only sample surveys and do not have the ability to create, save, print, or export surveys.
Saving with PRO and Enterprise Editions
With NetSpot PRO and Enterprise you can save your existing network survey or a planning project in the following ways:
- Use the File menu while performing a survey: File → Save. This will immediately save your current progress to the NetSpot library.
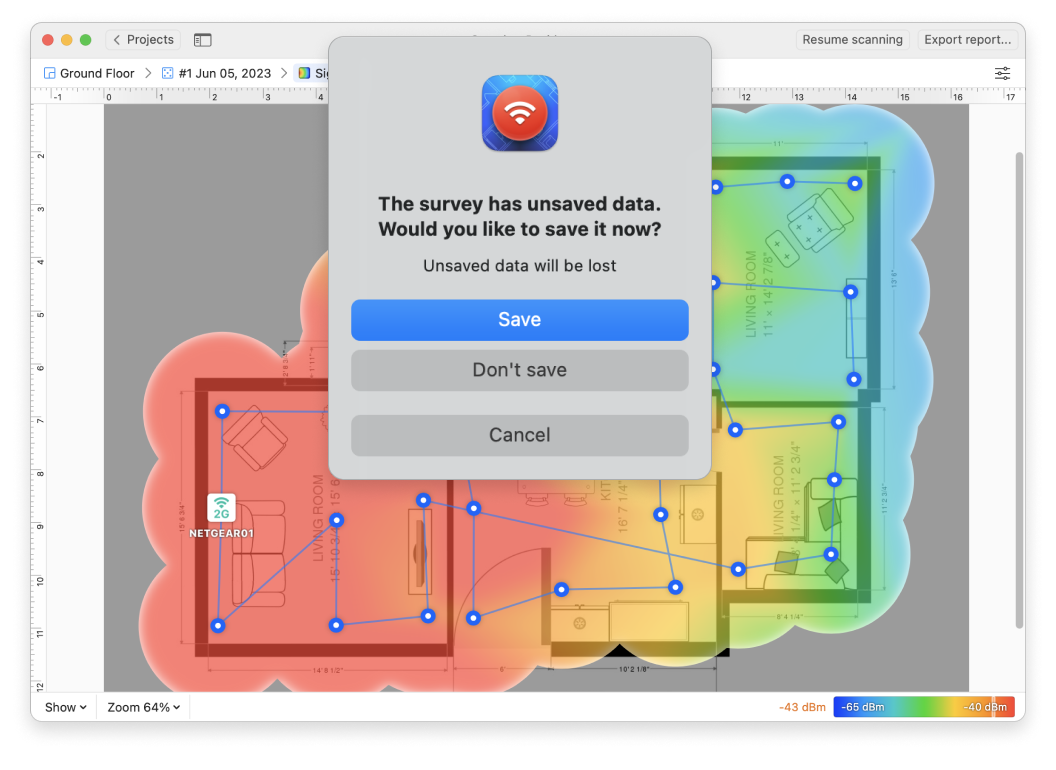
- If you decide to close a project you are currently working on, and have an unsaved progress, NetSpot will ask you whether to save current progress or not, or cancel and go back to editing.
Exporting your project
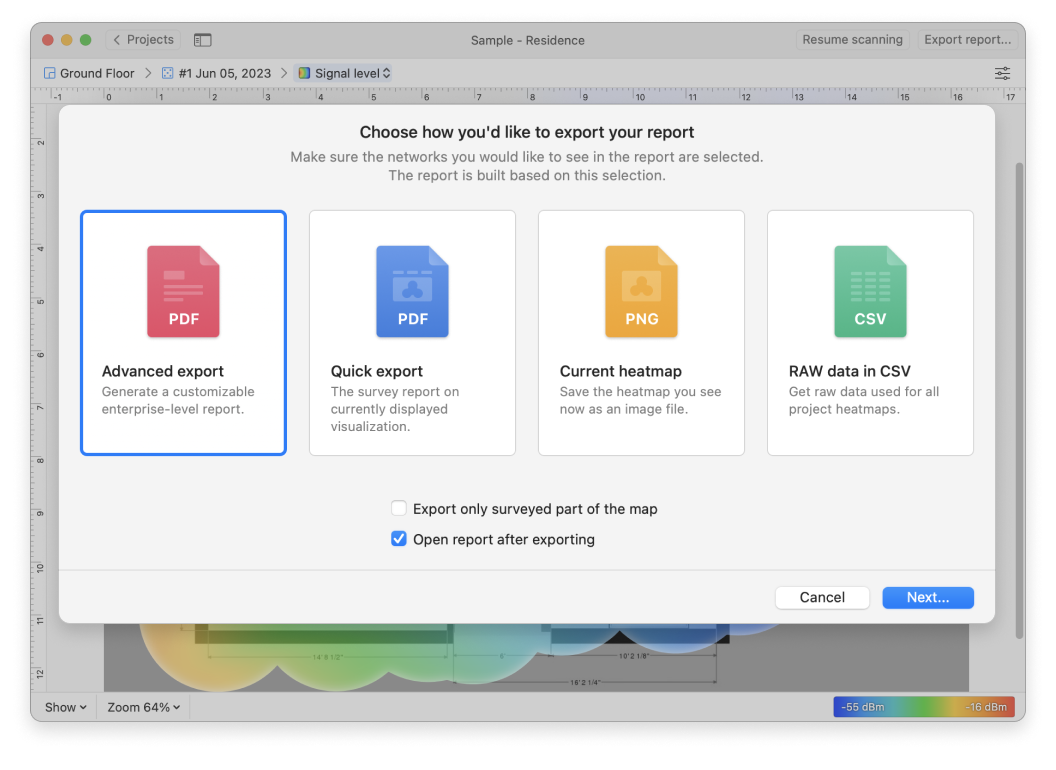
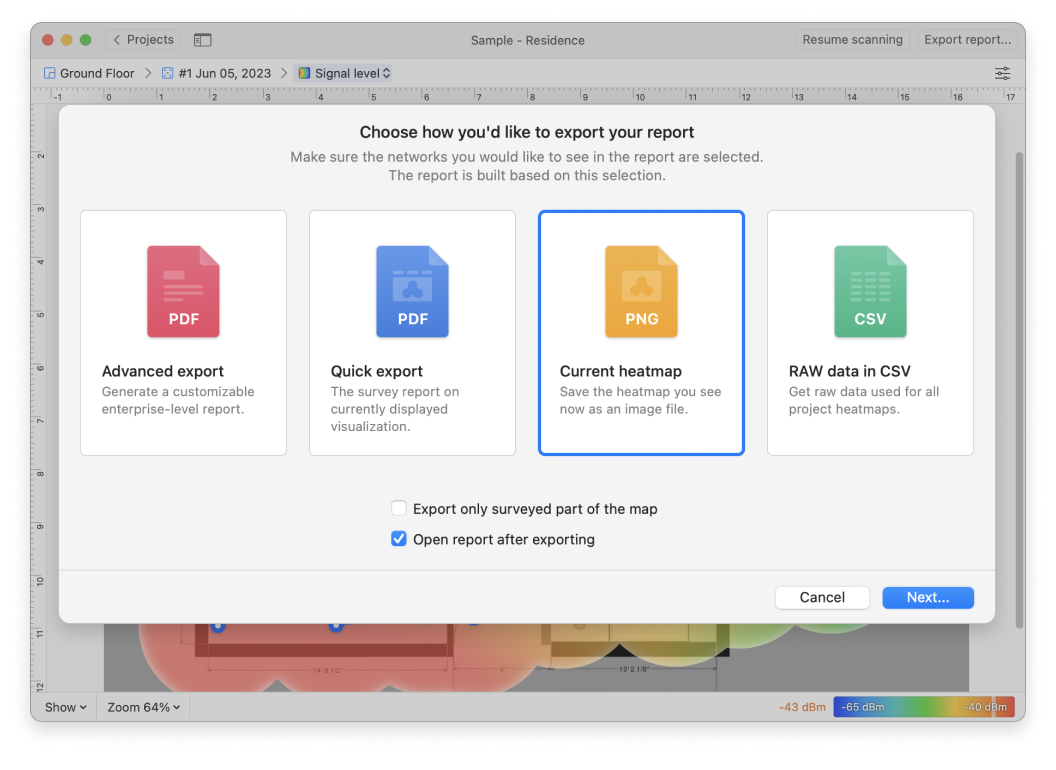
NetSpot PRO and Enterprise offer various advanced export options. To export your survey project click Export report… while in the heatmaps view at the top right of the NetSpot window.
- You have three export options in Planning Survey and you can choose whether to export only the surveyed part of the map and whether to open report right after exporting:
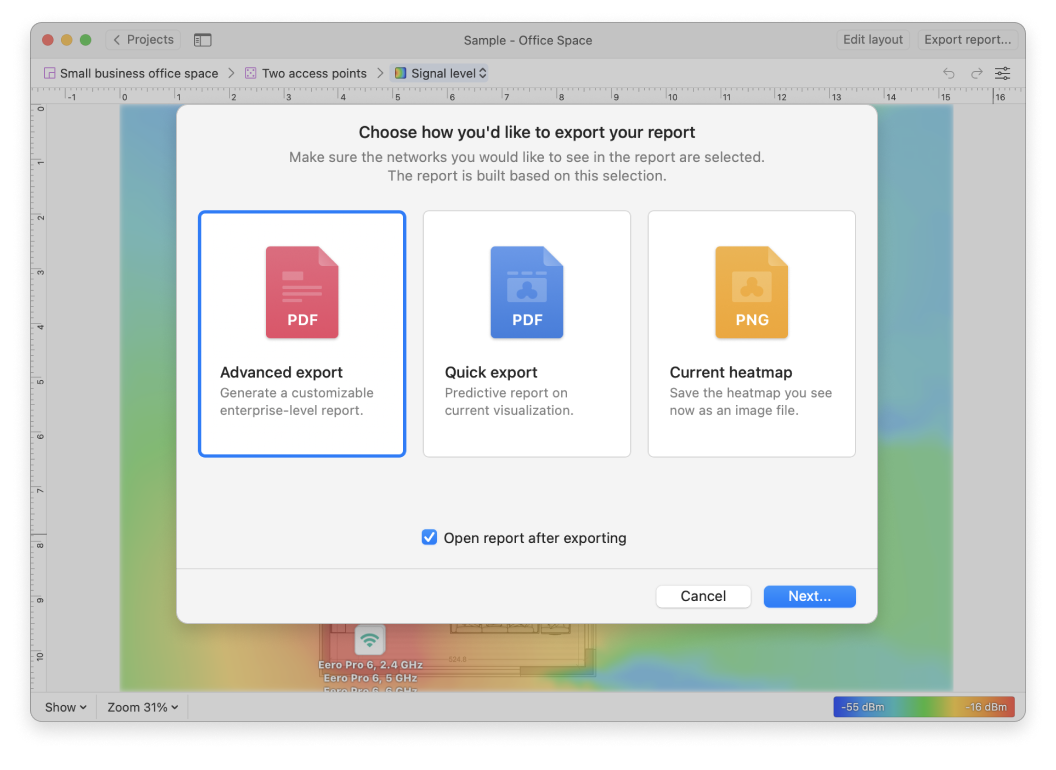
Advanced Export
This export option offers you the most comprehensive enterprise-level reports including all the heatmaps for the selected zones and snapshots:
- Zones: All zones and snapshots are selected by default. If there are any zones or snapshots you do not wish to include in your report, deselect the corresponding checkbox on the right. Click Next when done.
- Heatmaps (Visualizations): All visualizations are selected by default. If there are any that you do not wish to include in the report, deselect the corresponding checkbox to the left of the name. Visualizations normally include all APs and Frequency Bands, however you have an option of creating individual heatmaps based specifically on the AP information or frequency bands. To do that, tick the corresponding checkbox on the right. Click Next when done.
- View options: All additional data is included in the view by default. Choose how you’d like the AP markers and data points to be displayed and uncheck the corresponding box if you do not wish to show certain data. Click Next when done.
- Information: Name your project (this will be shown on the cover of the report) and provide a project description (which will be shown in the General Info section of the report). Upload your company logo, if desired, by clicking the Add Image… button. You can also add the Customer and Surveyor info. All the filled fields will be printed on the cover of the report. Click Export… when done.
- Select a location for your file and click Save to create your report.
- A folder will be saved to the location you have chosen. Inside the folder you’ll find the report in PDF format, plus image files (in PNG format) for each heatmap.
Quick Export
Saves the current heatmap (such as Signal-to-Noise Ratio) shown on screen as a PDF. Simply click the Quick Export button, select a location for your file, and click Save.
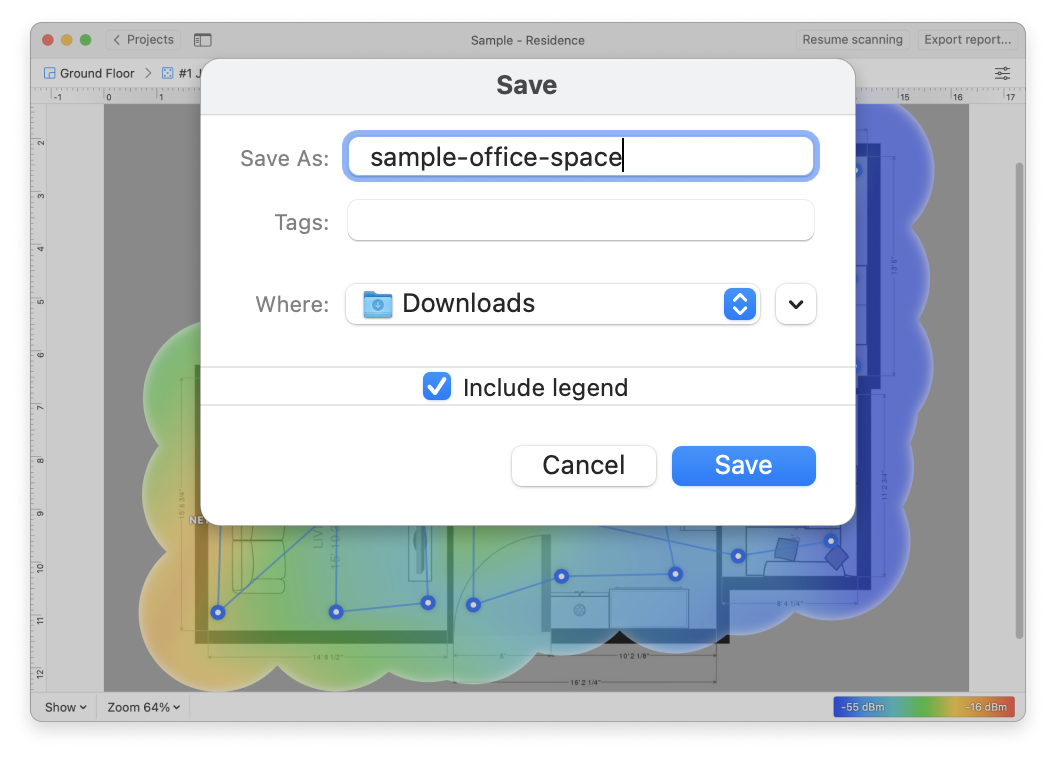
Current Heatmap
Saves the heatmap shown on screen as a PNG graphic image. Simply click the Current Heatmap option, select a location for your file, and click Save. If you wish to add the heatmap legend to your image, check the “Include legend” checkbox before clicking Save (enabled by default).
- You have four export options for an existing WiFi site survey. Additionally to three above mentioned options, you’ll find the possibility to export RAW data in CSV.
Printing Options
To print a visualization, export using one of the options above first. Once the PDF or PNG file has been saved to your computer, open it (or import it) in the program of your choice and print from there.