MacでWiFiサイトサーベイを実施する方法
あなたのMacは優れたマシンですが、その多くの機能はインターネット接続の質によって制限されています。これを改善するためには、MacでWiFiサイト調査を実行する方法を学ぶ必要があります。ここでは、Mac用のNetSpot WiFi Site Surveyを使用してそのプロセスを説明します。
WiFiサイトサーベイの目的は、WiFiルーターの最適な設置場所を見つけることでWiFiのカバレッジを最適化することです。
ジャンプ...
MacでWiFiサイト調査を実行する
WiFiの問題はMacユーザーが経験する最も一般的な問題の1つであり、その原因は滅多にコンピューターにありません。真の犯人は、ほとんどの人がルーターを最寄りの未使用の電源コンセントの近くに置き、時には家具の後ろに隠して見えないようにするため、ほとんどの場合、WiFiのカバレッジが不十分であることです。
ルーターが設置場所の悪さを補うほど強力でない限り(多くの家庭用ルーターでは難しいことです)その設置場所が最適でない結果として、信号弱点と呼ばれるエリアが生じ、これが速度低下や接続切れを引き起こす原因となります。
WiFiサイト調査を実施することで、これらの問題エリアを特定し、実行可能な解決策を提案するための診断ツールになります。信号ドロップや速度の不安定さに対処している場合や新しいWiFiセットアップを計画している場合でも、サイト調査は必要なデータを提供します。
サイト調査では信号強度をマッピングし、他のデバイスによる干渉を特定し、無線ネットワークのレイアウトを理解する手助けをします。この情報をもとに、ルーターの位置を調整したり、エクステンダーを追加したり、チャンネルを変更したりして、強固で信頼性のあるWiFiネットワークを実現できます。
- アクティブ調査: アクティブ調査を実施するためには、調査対象のネットワークに接続し、その接続の特性とパフォーマンスに関する情報を記録する必要があります。アクティブ調査は接続の問題をトラブルシューティングする際に特に有用です。
- パッシブ調査: この種類のWiFiサイト調査は特定のWiFiネットワークへのアクティブ接続を必要としません。代わりに、無線サイト調査ツールがエリア内の利用可能なすべてのネットワークをパッシブにリスニングし、それらに関する有用な情報を収集します。
- 予測調査: 名前の通り、この調査はWiFiルーターの場所などの一連の入力パラメータに基づいて、調査エリア内でWiFi信号がどのように伝わるかを予測します。予測調査は、実際の展開前に専門のソフトウェアアプリケーションを使用してリモートで実行されます。予測調査についての詳細を読む。
これら3種類のWiFiサイト調査を組み合わせることで、信号強度、信号対雑音比率、干渉からスループット、ラウンドトリップタイム、パケット損失などの有用な情報を把握できます。
何よりも、これらを実行するのは最初に思うほど難しくはありません。適切なMac用WiFiサイト調査ツールを選択し、それに任せるだけです。
Mac 用 Wi-Fi サイトサーベイソフトウェア
Macユーザーとして、アクティブサーベイ、パッシブサーベイ、予測サーベイに対応した多数のWiFiサイトサーベイソフトウェアツールから選ぶことができますが、それらの違いはかなり顕著であることを知っておくべきです。
以下は、Mac向けの最良のWiFiサイトサーベイソフトウェアを選ぶ際に考慮すべきポイントです:
- 互換性:選んだWiFiサイトサーベイMacツールは、Macコンピュータだけでなく、すべての802.11ネットワークと互換性がある必要があります。
- 使いやすさ:最良のWiFiサイトサーベイツールは、専門知識や経験がなくても大量の有用な情報を収集できるようにするため、調査の複雑さをすべて取り除きます。
- 機能:WiFiカバレッジを最適化し、一般的なWiFi問題をトラブルシューティングするために必要なすべての機能を備えたツールを選びたいです。
- 正確性:最後に望むのは、粗い測定にしか適していないWiFiサイトサーベイアプリが提供する不正確な情報に基づいて決定を下すことです。
- 価格:問題のないWiFiを手に入れるための探求で、銀行口座が空になることは避けたいです。そういうわけで、最初は無料のMac用WiFiサイトサーベイツールから始め、必要に応じてアップグレードすることをお勧めします。

上記の基準を満たすMacコンピューター用のWiFiサイト調査ツールはNetSpotです。現在利用可能な最高のツールであるだけでなく、NetSpotはMacで最初にリリースされたWiFiサイト調査ツールでもあります。最新バージョンは以下でも利用可能です:
- Windows (Windows用WiFiサイト調査ソフトウェアについて学ぶ)
- Android (Android用WiFiサイト調査ソフトウェアについて学ぶ)
- iOS
AndroidでWiFiサイト調査
徹底的な視覚分析を行い、包括的な色分けヒートマップを使用してWiFiネットワークのトラブルシューティングを行いましょう。

NetSpotは、macOS 11+以上を実行しているすべてのMacと互換性があり、すべての802.11ネットワークをサポートし、洗練されたユーザーインターフェイスのおかげで素晴らしい使いやすさ、優れた精度、および家庭ユーザーとプロフェッショナルのニーズを満たすための多くの優れた機能を提供します。
他の多くのMac用WiFiサイト調査ソフトウェアソリューションとは異なり、NetSpotは定期的に更新されるため、ユーザーはバグのないエクスペリエンスと新機能(今後の予測サイト調査のサポートなど)にアクセスできます。
NetSpotでWiFiサイト調査を行う方法
NetSpotの最新バージョンには、インスペクター(旧Discover)サーベイ、および新しい予測サイトサーベイモードであるプランニングという3つの主要な動作モードが搭載されています。これにより、NetSpotはMac向けの最も包括的なWiFi分析ソリューションとなり、アクティブ、パッシブ、および予測WiFiサイトサーベイを実行できるようになります。
インスペクターモードでは、近くのすべてのWiFiネットワークの全体像を素早く把握できます。チャンネル情報、送信速度、ベンダー、セキュリティタイプ、周波数帯などの詳細が、簡単にナビゲートできるインタラクティブな表で綺麗に表示されます。

サーベイモードはNetSpotを強力なアクティブWiFiサイトサーベイツールに変身させます。ここでは、調査対象の無線ネットワークに関する重要なデータが詰まったインタラクティブなヒートマップビジュアライゼーションを作成できます。

新しいプランニングモードは、予測サイト調査に関するものです。このモードでは、物理的な設定変更を行う前に、さまざまなシナリオをシミュレートして、WiFi環境を最適化することができます。これは新しい設置や広範囲の調整を計画する際に特に有用で、最初からデータに基づいた意思決定を行うことを保証します。

こちらは、Mac版のNetSpotを使ってWiFiサイトサーベイを実行する方法です:
ステップ1
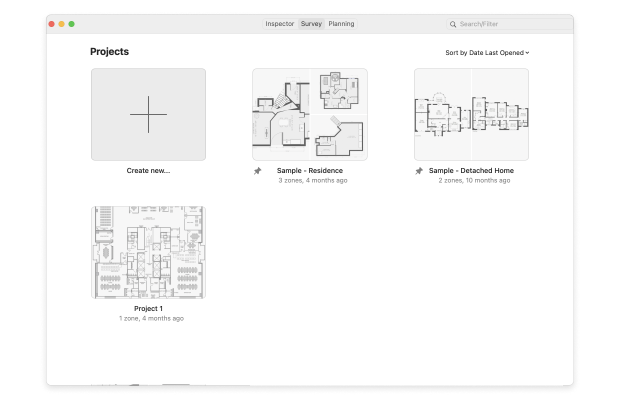
NetSpotを開き、ウィンドウの上部にある「調査」タブに移動します。
ステップ2
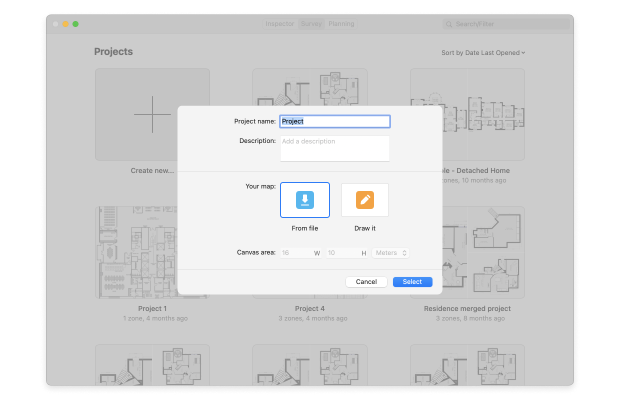
「新規作成」ボタンをクリックして、新しいアンケートについての必要な情報を入力してください。
ステップ3
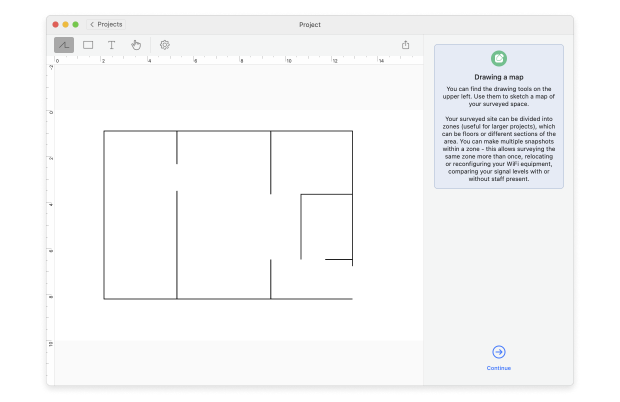
既存の地図をアップロードするか、NetSpot内で自分で描画します。いずれにせよ、調査予定エリアの地図が必要です。
ステップ4
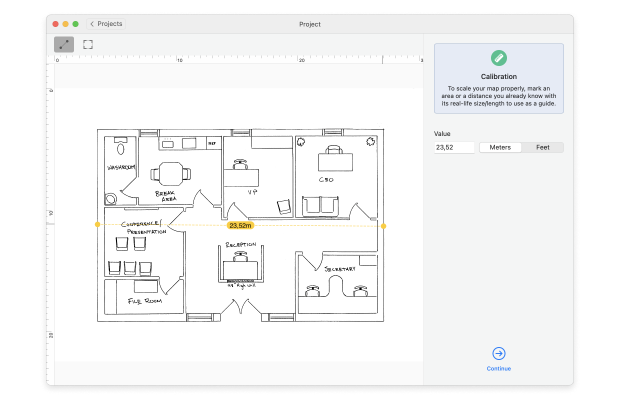
地図上の既知の2点をクリックし、それらの間の実際の距離を入力して、精度を高めるために調査を校正します。
ステップ5
「スキャン開始」ボタンを押し、画面の指示に従ってください。
ステップ6
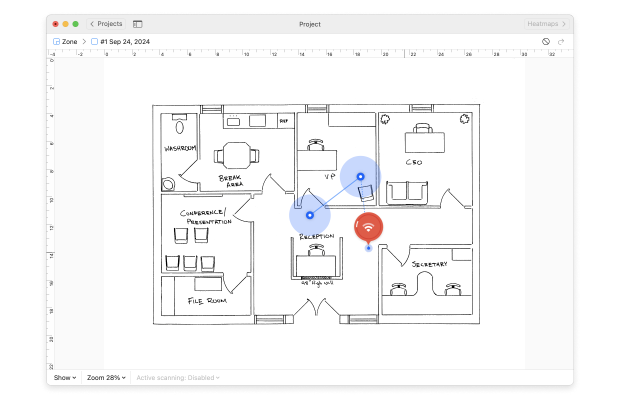
調査エリアを歩き回り、地図上に場所をマーキングしてNetSpotがデータを収集できるようにしましょう。最も正確な読み取りを得るために、各場所でしっかりと立ち止まってください。
ステップ7
全体をカバーし終えたら、右上にある「ヒートマップ」ボタンをクリックしてWiFi環境を可視化します。ヒートマップを分析して、デッドゾーンからチャネル干渉までを発見し、最適化のために情報に基づいた決定を下します。
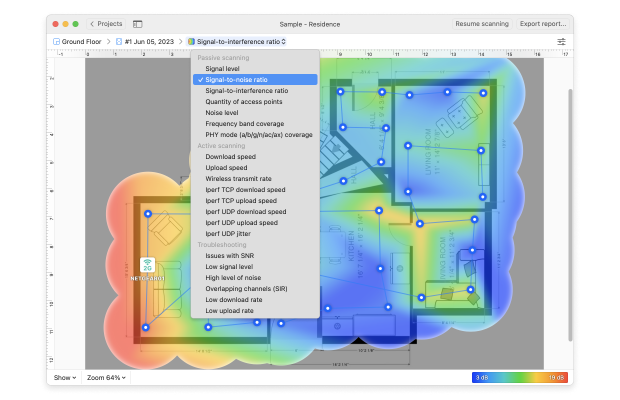
NetSpotは収集したデータを数多くの便利なWiFiヒートマップの視覚化に変えることができ、信号レベルから周波数帯のカバー範囲、無線送信速度までの全てを表示します。
視覚化
視覚的な分析は、無線接続に影響を与える複数の要因を調整するための最も好まれる方法の一つです。NetSpotは、Wi-Fi設定の比較、分析、トラブルシューティングを支援するさまざまな視覚化を提供します。
パッシブスキャニング
信号対雑音比
ワイヤレス信号のレベルがバックグラウンドノイズのレベルとどのように関係しているかを可視化します。
信号レベル
このビジュアライゼーションは、異なる測定ポイントでのWiFi信号の強さを示しています。これは、ノイズや干渉などの他の値と組み合わせたときに重要です。
信号対干渉比
他の無線送信機からの同チャネル干渉がWiFi信号に与える影響を分析できます。
第2信号レベル
特定の測定ポイントで検出された2番目に強いWi-Fi信号の強度(RSSIとして測定)を示します。この信号レベルを分析することで、セカンダリ信号がどのように空間をカバーしているか、クライアントがAP間で非効率的にスイッチする場所、およびWiFiパフォーマンスが低下する場所を確認できます。
アクセス ポイント数
各測定スポットで検出可能なアクセスポイントの数を調べることができます。
ノイズレベル
各測定ポイントでの干渉レベルと、それが信号強度にどのように影響するかを確認できます。
周波数帯域カバー率
周波数によるカバレッジの分析に役立ちます:2.4GHz、5GHz、または混在のいずれか。
PHY モードカバレッジ
このビジュアライゼーションは、WiFiプロトコルがワイヤレスネットワーク全体でどのように使用されているかを示しています。異なる色を使用することで、802.11a/b/g/n/ac/axまたはaxプロトコルが使用されているかを明確に確認することができます。
アクティブスキャンニング
アップロード速度
この可視化は、コンピュータからインターネット上のサーバーへのデータ転送速度を反映しています。
ダウンロード速度
このビジュアライゼーションは、インターネット上のサーバーからあなたのコンピュータへのデータ転送速度を反映しています。
無線送信速度
アクセスポイントからワイヤレスデバイスにデータが転送される速度を示します。
Iperf3 アップロード、ダウンロード、ジッターの可視化
TCPプロトコルまたはUDPプロトコルを介して速度テストを実施する場合でも、これらのビジュアライゼーションを使用すれば帯域幅のパフォーマンスを明確に確認し、分析できます。
トラブルシューティング
SNRに関する問題
この種類の可視化は、ネットワーク接続に影響を与える低SNRレベルの領域を特定するのに役立ちます。
高い騒音レベル
この種類の可視化は、高い騒音レベルがある地域を見つけることを目的としており、その結果、接続性ゼロのデッドゾーン」につながる可能性があります。
信号レベル低下
このビジュアライゼーションは、信号レベルが低いゾーンをすぐに見つけるのに非常に役立ちます。その後、影響を受けているアクセス ポイントの接続不良や接続の欠如の問題を修正することができます。
重複するチャネル (SIR)
アクセス ポイントがブロードキャストするチャネルを表示し、過度の重複を避けるために最適なチャネル使用方法を見つけるのに役立ちます。
低い二次信号レベル
このヒートマップを使用すると、二次無線信号が弱いエリアを視覚的に評価できます。結果に基づいて、二次無線設定を改善するためにできる調整を確認できます。
低いダウンロードおよびアップロード速度
このビジュアライゼーションでは、アップロードおよびダウンロード速度が不満足で、さまざまなサービスやストリーミング品質に適切な接続を達成するために調整が必要な場所を確認できます。

WiFiサイト調査の結果を分析し終えたら、右上隅にあるエクスポートボタンをクリックして、さまざまな方法で調査をエクスポートできます。たとえば、現在のビジュアライゼーションのみをエクスポートしたり、ヒートマップを画像ファイルとして保存したり、すべての生データをCSVファイルとしてエクスポートしたりできます。
ご覧の通り、NetSpotはMac向けの非常に有能で使いやすいWiFiサイト調査ツールであり、そのため多数のプロのレビュアーや実際のユーザーから高評価を受け続けている理由でもあります。
WiFiのカバレッジやパフォーマンスに問題がある場合は、ためらわずに無料版を今すぐダウンロードしてください。専門的なスキルがなくてもすぐにWiFiの問題を解決し、Macや他のデバイスに高速で信頼性のあるインターネットアクセスを提供できるようになります。
成功する Wi-Fi サイト調査のためのヒント
NetSpot が WiFi サイト サーベイを簡単なプロセスに変え、以前に WiFi サイト サーベイを実行したことがない場合でも優れた結果を得るのに役立ちますが、それでもある程度の準備と注意を持って作業に取り組むことが重要です。 WiFi サイト サーベイをできるだけ効果的にするためのヒントをいくつか紹介します:
- 適切なタイミングを選択します: ネットワーク使用状況が通常の作業条件を模倣する時間にサーベイを実行します。これにより、定期的に対処しなければならない WiFi 環境を最も正確に表すことができます。
- バッテリーの確認: お使いの Mac が完全に充電されていることを確認してください。 NetSpot を使用した WiFi 調査は特に時間のかかるプロセスではありませんが、正確な結果を得るには一貫した中断のないデータ収集が必要です。調査の途中でバッテリーが切れるとデータが不完全になり、最初からやり直さなければならない可能性があります。
- じっと立つ: 地図上の各ポイントでデータを収集するときは、ソフトウェアが最も正確な情報を収集できるように、しばらくの間動かずに立っていてください。
- 複数のサーベイ: 包括的な結果を得るために、複数の種類のサーベイを実行することをお勧めします。アクティブな調査によりパフォーマンスの問題が明らかになる場合がありますが、パッシブな調査により隣接するネットワークからの潜在的な干渉が明らかになる場合があります。
これらのヒントに従うことで、ネットワークのパフォーマンスと信頼性を向上させるための成功した WiFi サイト サーベイの準備が整います。
だから、私たちのおすすめです

NetSpot
Wi-Fi サイト サーベイ、分析、トラブルシューティングは、標準的な802.11be/ax/ac/n/g/a/b無線ネットワークアダプタを備えたMacBook(macOS 11+)または任意のラップトップ(Windows 7/8/10/11)で動作します。802.11beのサポートについての詳細はこちらをご覧ください。
NetSpotを無料で入手する
Wi-Fi サイト サーベイ、分析、トラブルシューティングは、標準的な802.11be/ax/ac/n/g/a/b無線ネットワークアダプタを備えたMacBook(macOS 11+)または任意のラップトップ(Windows 7/8/10/11)で動作します。802.11beのサポートについての詳細はこちらをご覧ください。