The wireless transmit rate is the speed that data is being transmitted from an AP to a wireless device. The technical term for this is the TxRate. For 802.11n connections, the maximum possible rate is 300 Mbit/sec (using 40 mHz and channel bonding). For 802.11ac connections, the maximum possible rate is 1 Gbit/sec. You will want to research what the maximum possible rate is for your particular network configuration and adjust the maximum rate for the visualization as needed (see below).
NetSpot obtains the Wireless Transmit Rate as the value returned by the system while establishing a connection to a selected network.
Note: Sometimes you might get a zero value, which might mean that a particular network was not available in that location at the moment, or connection to that network failed for some reason, or your device connected to another AP with the same SSID that had a stronger (better) signal.
The Wireless Transmit Rate visualization is one of the PRO visualizations available only to those that have upgraded to the PRO or Enterprise version of NetSpot.
To measure wireless transmit rate:
- Start a new survey and after you set the precision of your data point, decide which networks you are going to run Active Scanning for. Choose Connected networks or Selected networks, and check the box next to the network you wish to test the speed of.
- Perform your survey.
- Click on the Visualization drop-down menu and select Wireless Transmit Rate from the menu.
- Hover over any of your data points and the transmit rate for that spot will show next to the network name on the left-hand sidebar.
There are several ways you can view this heatmap:
- Wi-Fi Network: Each Wi-Fi network detected can be mapped individually. Simply check the box next to the network(s) you wish to view on the left-hand side of the NetSpot window.
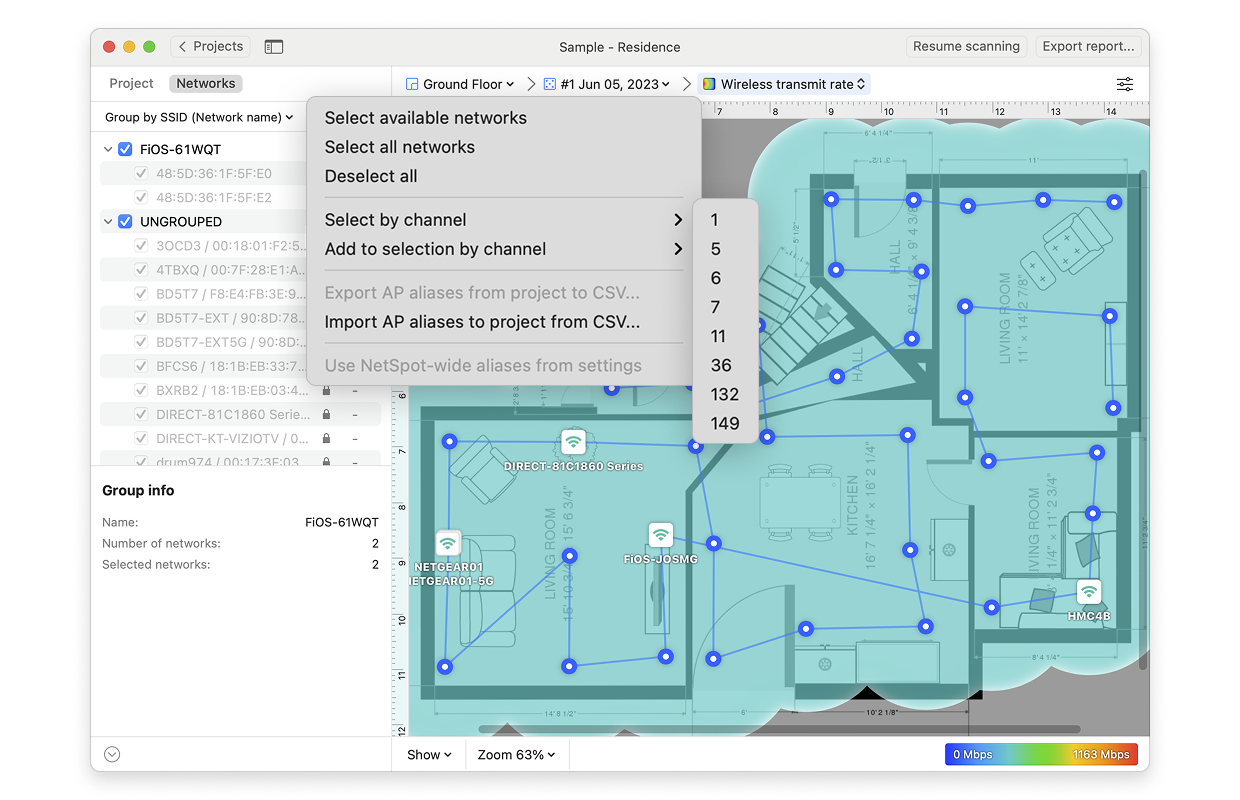
- Wi-Fi Channel: Click (
 ) at the top of the left panel in NetSpot (above the networks list) to visualize networks broadcasting on certain channels.
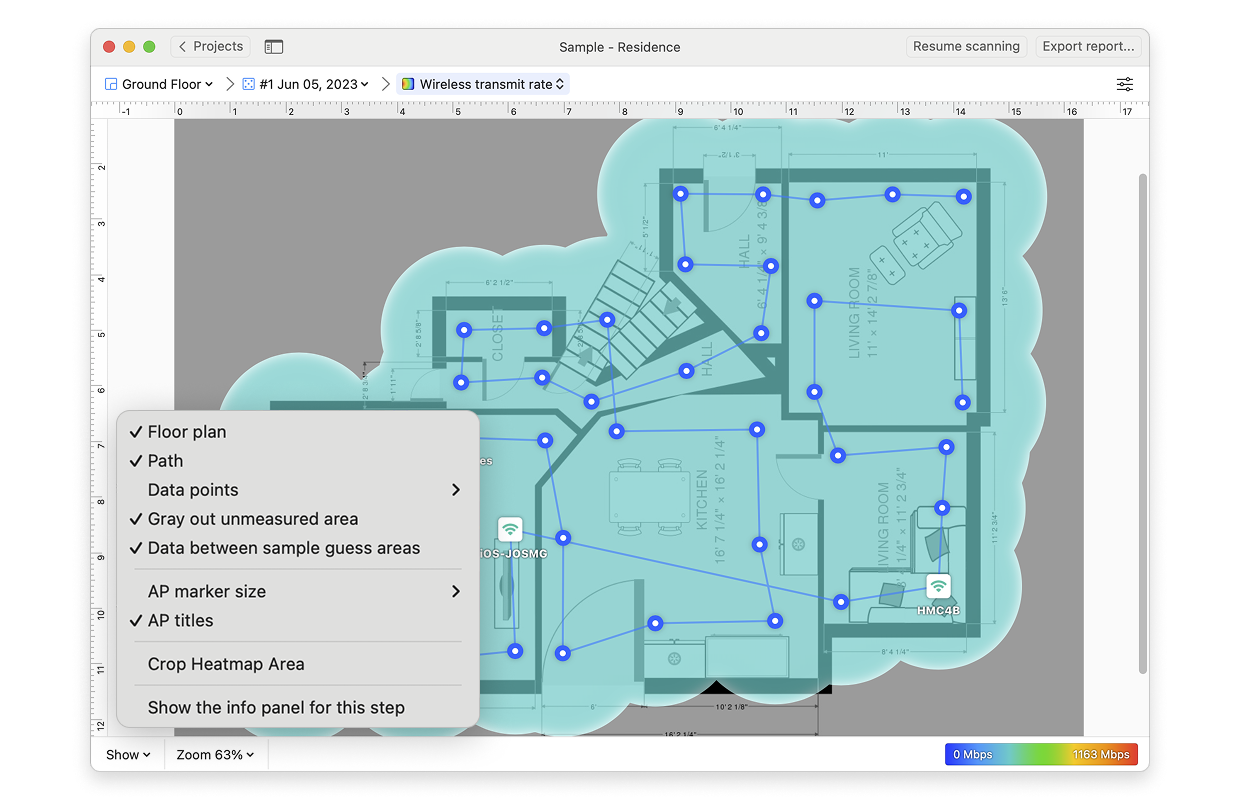
- View: By clicking on the Show menu in the bottom left corner of the canvas, you can choose whether to show your floor plan, path, sampling points, and AP titles on the heatmap, as well as several other adjustments.
- AP Detection Proximity: By clicking the Heatmap Settings icon at the top right or by clicking on the gradient on the lower right, you can filter out weaker access points (APs) by adjusting the AP detection proximity slider. The default value is -50dBm.
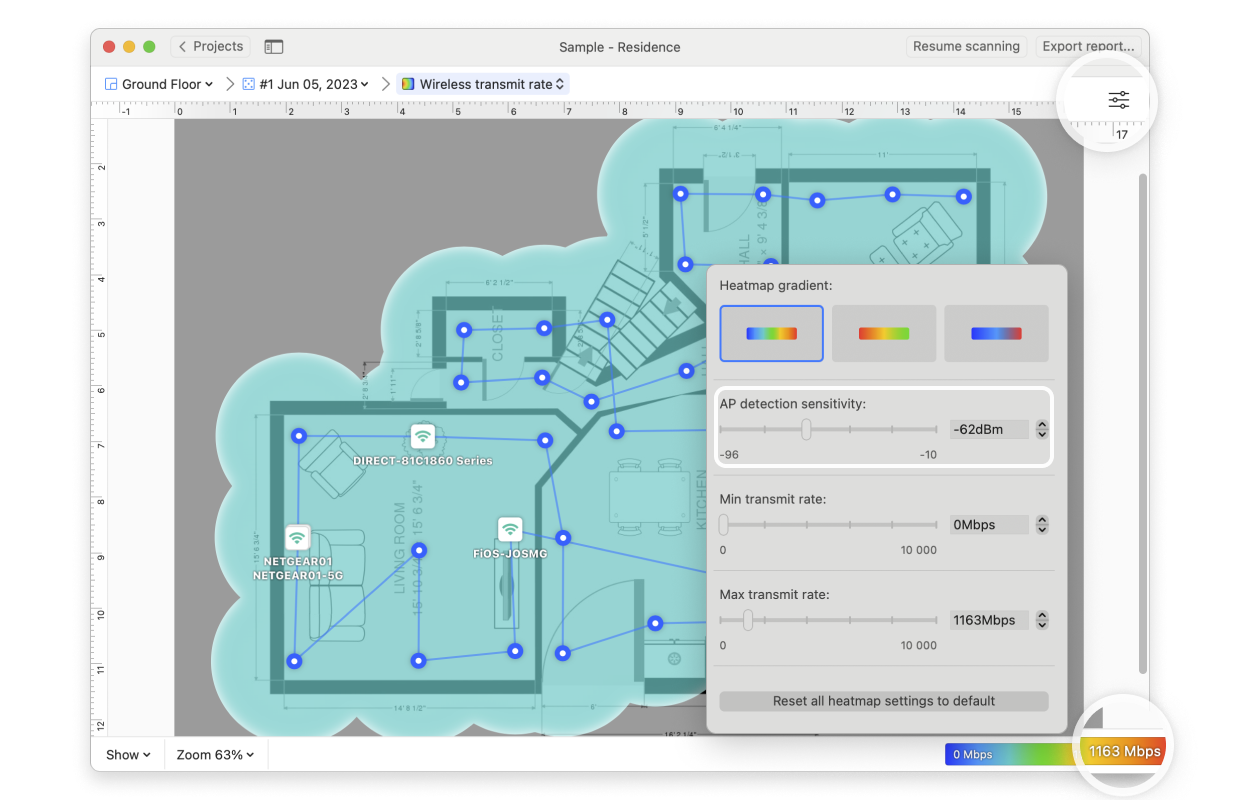
- Min/Max transmit rate: By clicking the Heatmap Settings icon in the upper right corner of the app window or by clicking on the gradient on the lower right, the color scheme of the transmit rate heatmap can be adjusted to a more convenient range. You can change the color combination by choosing from the three gradient options, and then the intensity can be changed by tweaking the visualized transmit rate levels. The default range is set to 0Mbps (minimum) and 1000Mbps (maximum).
