NetSpot WiFi Analyzer for Windows
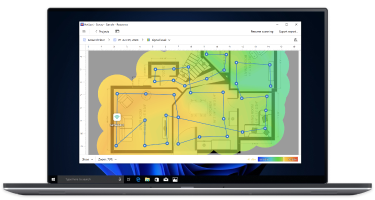
With the indispensable tool that is NetSpot WiFi analyzer for PC, you can quickly and efficiently analyze and make improvements to your WiFi network, carry out professional WiFi site surveys, and get customizable detailed reports.
NetSpot WiFi analyzer for PC
Discover Mode

Work with surrounding networks in WiFi analyzer for PC

Get to know your WiFi network's strong and weak sides and get the insight into the neighboring networks with NetSpot - WiFi analyzer PC app. You'll need a laptop with Windows* on board to see such data as performance, APs configurations, signal level, channel interference, etc.
Live Data Icon

Live Data

The most relevant data from all surrounding networks

AP Details Icon

AP Details

Channel, transmit rate, vendor, security type, frequency band, etc.

Real-time Charts Icon

Real-time Charts

Customizable real-time signal level and noise charts

In-Depth Analysis Icon

In-Depth Analysis

Discover mode can complement your survey by analyzing WiFi in specific locations

2.4 and 5GHz WiFi Icon

2.4 and 5GHz WiFi

NetSpot supports both frequency bands to keep you informed of channel occupancy

AP Comparison Icon

AP Comparison

Color-coded dBm bars help quickly compare all APs throughout all Wi-Fi networks

CSV Export Icon

CSV Export

Great for statistical review of data for each monitored AP

Network Search Icon

Network Search

NetSpot makes it easy to see which AP provides the strongest signal

Experience the best WiFi analyzer for Windows

survey Mode

Perform efficient and thorough WiFi Site Surveys

Map your coverage area and see how the signal spreads in reality on informative heat maps. Thanks to the numerous visualizations you can analyze and compare WiFi signals by a variety of parameters.
Multi-level Projects Icon

Multi-level Projects

Every project can be constructed of multiple zones representing various areas, like floors, rooms, levels of access, etc. This allows for efficient planning and allocation of the signal.

Zone Variations Icon

Zone Variations

Each zone can have multiple snapshots captured at different times of day or on different days with various configurations. Then you can compare the results to see what works best for you.

Hybrid Surveys Icon

Hybrid Surveys

Perform active and passive surveys simultaneously to see how the upload rate, download rate and wireless transmit rate correlate with coverage.
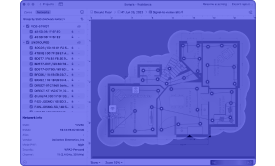
Visualizations

Visual analysis has always been the best approach to analyze specific signal values. Interactive heatmaps provide you with comprehensive layout for the surveyed wireless networks in each point of the analyzed area.

Passive Scanning:

  • Signal level
  • Signal to Interference ratio
  • Frequency band coverage
  • Number of access points
  • PHY mode coverage

Active scanning:

  • Download speed
  • Upload speed
  • Wireless transmit rate
NetSpot for Mac

Also available Mac version

Suppors Mac OS 10.6.8 and newer, including Mac OS 10.12 Sierra with a standard 802.11a/b/g/n/ac wireless network adapter.
Learn More

Wi-Fi Troubleshooting

It has never been easier to locate WiFi issues! Automated troubleshooting heatmaps with extensive recommendations come in handy when your wireless network needs an extra boost. You can clearly see how the coverage is distributed as well as the areas that lack the signal strength. NetSpot can help you determine the reasons for the issues you may be experiencing and eliminate them as a result.
Low signal level Icon

Low signal level

Overlapping channels Icon

Overlapping channels

Low download speed Icon

Low download speed

Low upload speed Icon

Low upload speed

Professional custom data reports

For your convenience, there are multiple ways to export NetSpot heatmaps for further analysis. Save your data as CSV, or export your current visualization to PDF or as a PNG image, and get a detailed Current Heatmap report.
NetSpot heatmaps
👍 It is also possible to prepare an advanced custom report with all the visualizations in one file.

You are in a good company

companyLogos

Choose your NetSpot

  • Home

    • Non-commercial use only, 1 user
    • 2 zones per project
    • 2 snapshots per zone
    • 50 data points per heatmap
    • Main visualizations: Signal and SIR (+ SNR for macOS only)
    • 5 Access Points visualized at a time
  • PRO

    • Commercial license, 1 user
    • 50 zones per project
    • 50 snapshots per zone
    • 500 data points per heatmap
    • All 12 visualizations and 4 additional visualizations for macOS only
    • Unlimited APs
  • Enterprise

    • Commercial license, 10 users
    • Unlimited zones
    • Unlimited zone snapshots
    • Unlimited data points
    • All 12 visualizations and 4 additional visualizations for macOS only
    • Unlimited APs

Why NetSpot stands out

  • 500,000+

    Users

    8 years

    at the market
  • Cross-platform

    Mac + Windows solution

    Easy to go

    No need in any specific Wi-Fi adapters or drivers

    Unique professional native solution for macOS

  • Simple to use

    by home users and small office staff without Wi-Fi knowledge

    WiFi heatmaps

Best WiFi analyzer Windows app
Use NetSpot for gathering information about WiFi networks and improving their performance.

Runs on any laptop Windows 7/8/10/11 with a standard 802.11a/b/g/n/ac/ax wireless network adapter.
★★★★
4.8 score, based on 969 user reviews
Version 2.15 • Submit your review