Projects
Project is created every time you start a new Survey. Project contains one zone only. Wifiner Project files are saved with the file extension of .netspl.
When you create a new survey and load a map, this area is called a zone. A zone can encompass all of an area map, or just part of it.
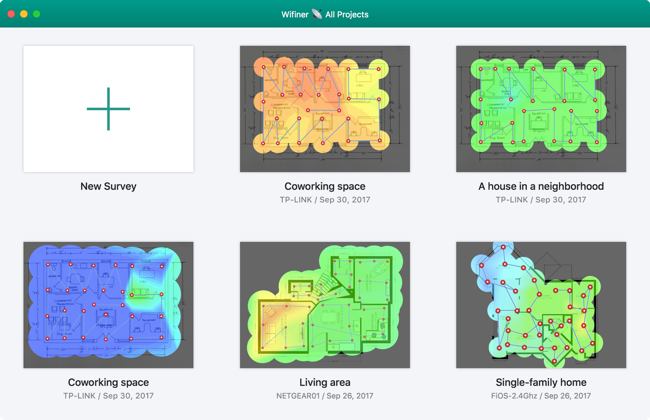
Sample projects
We have created a few sample projects for you to give you an idea of how Wifiner works and what you should get in the end. You can check them out and play with visualizations.
Managing the Projects
You can remove, export or rename your projects. You can also drag-and-drop projects created on another Mac computer.
Create a new Project
After clicking a Start new survey button you see a wizard for creating a new Project, where you can choose network, name your project, add a description, load a map and choose an area type.
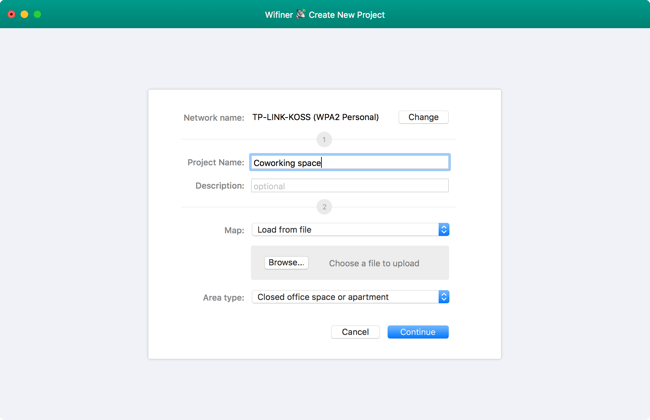
Network
Your current WiFi network is caught automatically. You can see it at the top. You can change WiFi network you would like to survey by clicking Change button.
We can scan one WiFi network only due to Apple restrictions and limitations.
Project name and description
Give your project a name (such as “My House”) and briefly describe your project (Description).
Map and Area type
Select the option to load a map from your computer (GIF, JPEG, PNG, TIFF, PDF) or choose a sample map from the list.
Set the area type. This setting regulates how large the blue circle is around each measurement point during a survey. There are several options:
- Closed office space or apartment – the blue data sampling circle is 3 m in diameter.
- Office with privacy walls – 5 meters.
- Large open indoor area (airport, store) – 12 meters.
- Outdoor restrained urban area – 15 meters.
- Outdoor area with medium housing density – 30 meters.
- Large open outdoor area (stadium) – 60 meters.
Then click Continue button on the bottom right of the screen to start map calibration process.
Map Calibration
Choose any two points on the map, and then input the actual distance between them in the box at the bottom of the window. Be sure to select the correct unit of measurement (feet or meters).
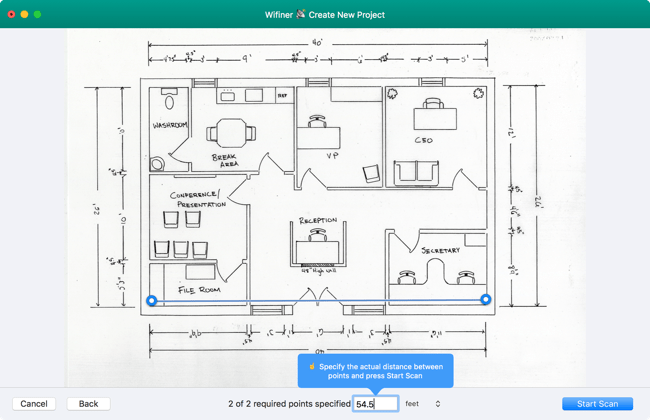
It is necessary for accurate mapping of Wi-Fi signals in your space. Please note, incorrectly calibrated map will lead to invalid values shown.
Click Scan my WiFi button to start the scanning process.
Scanning process:
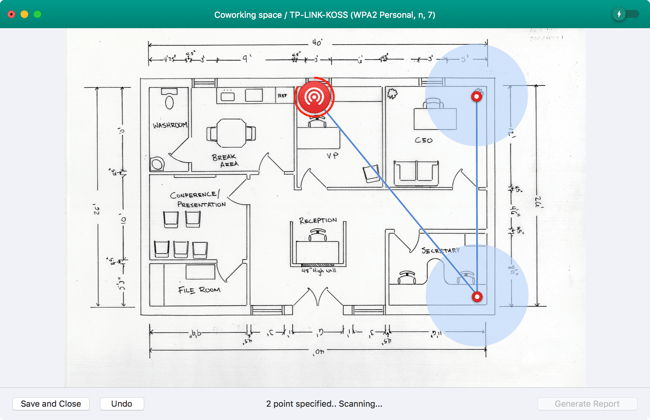
You must take at least 3 sampling points to build a visualization.
Active Scanning
Active scanning allows you to test your network’s Internet connection speeds. It will test upload rate, download rate and wireless transmit rate by sending queries to various servers and monitoring the time it takes to send and receive them.
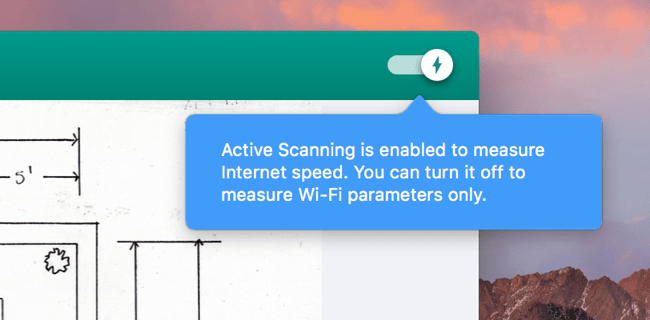
Active scanning is usually On. You can turn it Off manually. Please note that
turning Off the active scanning in the middle of the process will distort the results of the Survey. It’s better to turn it off or turn it on in advance.
Drawing data points
Walk to one corner of your space and click the point on the map that corresponds to where you are standing (Note: You need to be able to accurately locate yourself on the map each time you stop for a scan). The app will then take its first measurement, which can take 10 seconds to a few minutes. Be sure to stay still during this time. It is finished when the blue circle appears.
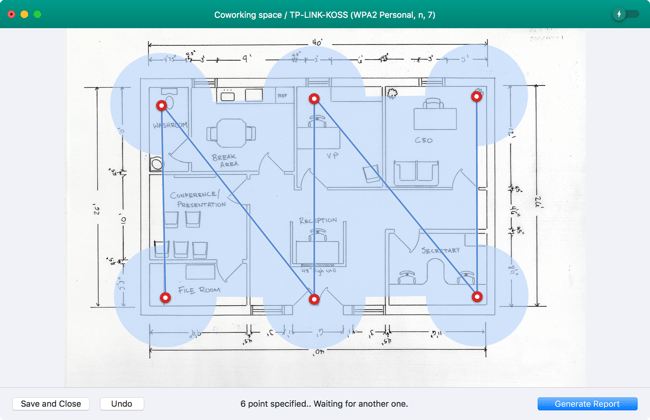
Continue moving and scanning until you have covered the whole area of the map that you wish to scan. (Note: You don’t have to scan the entire map area. Scan only the portions you wish to survey for this zone.) You should take your measurements close enough that the blue circles overlap slightly. Most of your survey area should be blue by the time you are finished.
Click the Generate WiFi Report button on the bottom-right of the window when done, in order to view the heatmap visualizations. If you want to do a step backward, click Undo button.
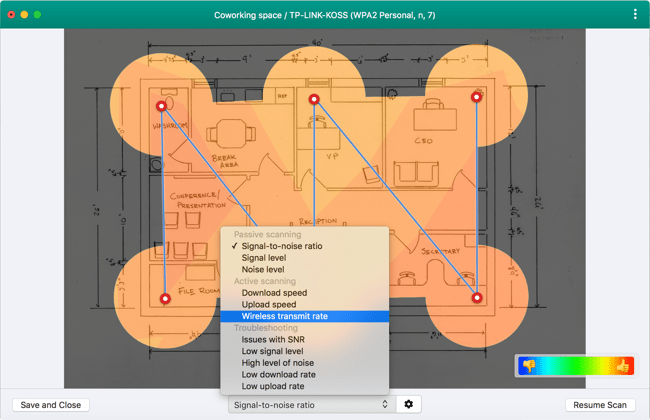
Visualizations
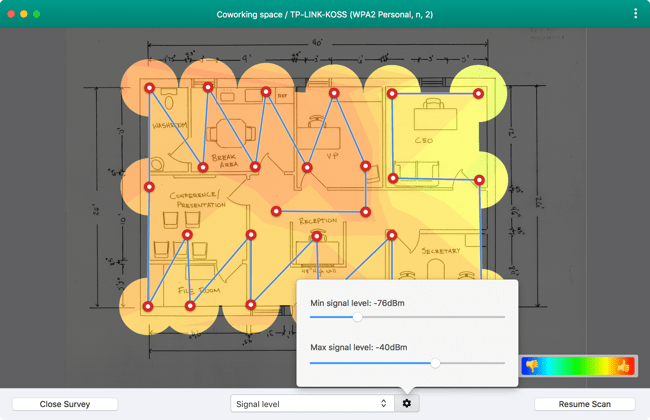
You can check all visualizations by choosing them from the list in the bottom-left of the window. All heatmaps are interactive and show you the detailed information in every point of the map.
Passive Scanning
Signal-to-Noise Ratio (SNR) compares the level of the Wi-FI signal to the level of background noise. Sources of noise can include microwave ovens, cordless phones, Bluetooth devices, wireless video cameras, wireless game controllers, fluorescent lights, and more.
The Signal level is the strength of your Wi-Fi signal. The Signal visualization is provided to give you a better understanding of your Signal-to-Noise Ratio (SNR).
The Noise level is the amount of outside interference detected at each measurement point. Noise negatively affects your Wi-Fi signal.
*Viewing the Signal and Noise separately can help to identify underlying problems that are causing a poor SNR.
Active Scanning
Download speed is the rate at which information can be downloaded from the Internet. It is measured in Mbps (megabits per second). Wifiner calculates this speed during Active Scanning, by sending queries to servers and measuring the speed at which information is sent and received.
Upload speed is the rate at which information can be uploaded from a device connected to the network to the Internet. It is measured in Mbps (megabits per second). Wifiner calculates this speed during Active Scanning, by sending queries to servers and measuring the speed at which information is sent and received.
The wireless transmit rate is the speed that data is being transmitted from an AP to a wireless device. The technical term for this is the TxRate. For 802.11n connections, the maximum possible rate is 300 Mbit/sec (using 40 mHz and channel bonding). For 802.11ac connections, the maximum possible rate is 1 Gbit/sec.
Troubleshooting
Troubleshooting visualizations can be used to quickly highlight areas that have potential issues.
The five visualizations are:
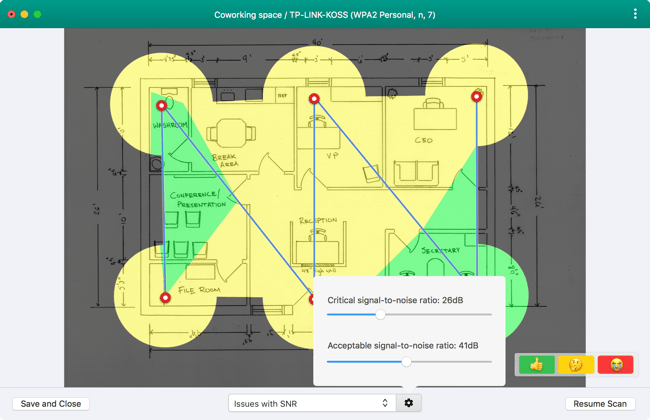
Issues with SNR visualization compares the level of the Wi-FI signal to the level of background noise. A ratio of 10-15dB is considered unreliable and a ratio of 16-24dB is considered poor. First, you should try to determine whether your problem is with your signal strength or noise level. Take a look at your Signal Level and Noise Level visualization heat maps. Check the color in the map areas that had registered low SNR. If you are seeing blue or purple on just one of those visualizations, then that is where your main problem lies. If you are seeing blue or purple on both visualizations, then you have issues with both signal strength and noise.
Next, deselect all of your APs on the left sidebar and then re-select them one by one. Try to narrow down which APs are affected.
Low Signal level. The signal level is the strength of your Wi-Fi signal. Signal levels lower than -40 dBm are of concern and lower than -70 dBm is considered critical. But what is truly important is your signal level in comparison to your noise level (see signal-to-noise ratio). A low signal level can be tolerated if the noise level is minimal.
If you are registering low signal levels in some areas of your Signal Level visualization, then your first step should be to deselect all of your APs on the left sidebar and then re-select them one by one. Try to narrow down which APs should be covering the area(s) of low signal strength.
High noise levels can interfere with your network signal strength and cause areas of poor connectivity — or “dead zones” where there is no connectivity. Noise can be caused by any electronic device, including microwave ovens, cordless phones, Bluetooth devices, wireless video cameras, wireless game controllers and fluorescent lights. Note that other Wi-Fi networks are not included when measuring noise, but they are included in the Signal-to-Interference Ratio.
Low download rate. Download speed is the rate that information can be downloaded at from the Internet. It is measured in Mbps (megabits per second). Wifiner calculates this speed during Active Scanning, by sending queries to servers and measuring the speed at which information is sent and received.
Low upload rate. Upload speed is the rate that information can be transmitted at from a client device. It is measured in Mbps (megabits per second). Wifiner calculates this speed during Active Scanning, by sending queries to servers and measuring the speed at which information is sent and received.
Once you finished your survey, click Save and Close button.
Export
You can export any current visualization, by clicking the Menu in the top-right of the screen.
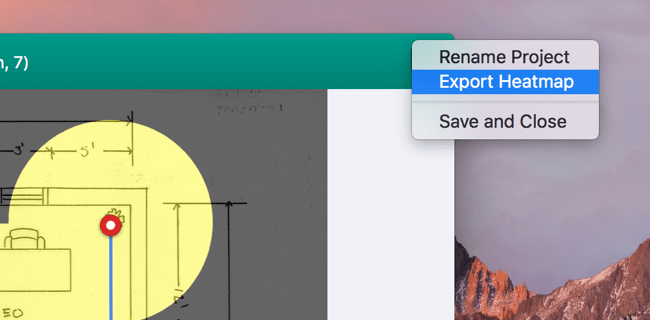
You will get an image of the chosen visualization in PNG.
Wifiner – FAQ
Q: What is the difference between Wifiner and Netspot?
Wifiner is our new product with an easy-to-understand user interface for users without special knowledge in the Wi-Fi environment, while NetSpot is for more professional usage with two modes (Discover and Survey) surveying all the Wi-Fi networks around (including hidden ones). With Wifiner you can only survey your current Wi-Fi network without any limits on data points, build any of 11 visualizations and fix your Wi-Fi issues.
Q: Can I load my own map?
Sure, it will be the best option! Select the option to load a map from your computer while creating a new Survey.
Q: What parameters are recommended for the map I upload?
Maps need to be saved as one of the following file types before they can be imported into Wifiner: GIF, JPEG, PNG, TIFF or PDF, but currently, only the first page of a multi-page PDF (we will improve it in our future updates).
Ideally, maps should be black and white with no other colors. The map background should be white. If the background is a different color, try lightening it using a photo editing program.
If you have a very large area to scan, we recommend breaking up the map into sections and uploading those sections as separate projects. The maximum size map we recommend is 3000 x 2000 pixels.
Q: What is a sample map?
If you don’t have a map of an area you want to survey, you can use a sample map from Wifiner and calibrate it.
Q: What is an area type?
Area type setting regulates how large the blue circle is around each measurement point during a survey. It is necessary for accurate data measurement. There are several options:
- Closed office space or apartment – the blue data sampling circle is 3 m in diameter.
- Office with privacy walls – 5 meters.
- Large open indoor area (airport, store) – 12 meters.
- Outdoor restrained urban area – 15 meters.
- Outdoor area with medium housing density – 30 meters.
- Large open outdoor area (stadium) – 60 meters.
Q: What is Active Scanning?
Active scanning is a feature where the download speed, upload speed and wireless transmit rate of a network can be measured.
Q: Can I open NetSpot projects in Wifiner and vice versa?
Unfortunately, you can’t open NetSpot projects in Wifiner and vice versa.
Q: Why does Wifiner monitor one WiFi network only?
According to App Store Developer guidelines, Wifiner cannot have full access to the required Wi-Fi Framework it relies on, thus being able to scan only one wireless network at a time. There’s a slight possibility that Apple may alleviate this restriction some time.
However, if you need to scan more than one network and shall benefit with more features, we advise you to try NetSpot.
Q: Is there a version for iPhone or iPad?
Not yet. However, we are working on it and plan to deliver it to you as soon as possible. Stay tuned for updates from our developers.
Q: Does Wifiner support Google Maps?
Wifiner doesn’t support Google Maps yet. However, you can load a screenshot of the Map for your survey and get a report by indicating the scale of the map loaded.
Q: Do you have any tips for a better surveying?
We will be glad to help you with your WiFi site survey. These tips will help you to get more accurate data:
- Start in one corner and follow a zigzag path through the space you wish to scan.
- Your goal should be to end up with most of your map covered in blue circles, with the circles overlapping a bit on the edges. If a measurement overlaps too much (or not at all), click Undo and take another sample in a better position.
- Corridors have to be surveyed in 2 lines: either by walking in a zigzag pattern from wall to wall, or by walking along one wall and then along the other one.
- Each room in your survey area needs to have at least 3-4 samples inside of it. Make sure the corners are covered and that there are samples in the middle of the room.
- If a room is normally locked, request access to it — any blank areas in your survey could hide possible sources of noise.
- For outdoor area surveys, you can place sampling points farther apart and the blue circles do not need to overlap. Make sure you selected the correct zone area type for the outdoor surveys to improve the guess range of Wifiner.
- When surveying a large area, you can take fewer measurements if the area is relatively empty. If there are many obstacles (walls, tables, machinery), you will need to make more frequent stops to ensure identification of dead spots.
- Do not re-measure the same spot twice as readings from two close points with different data can result in an inaccurate heatmap.
- Keep your laptop still while a measurement is being taken.
- Complete the scan without any long pauses between measurements. In order to be accurate, all measurements need to be taken under the same conditions.
- Try not to make any changes to your environment while surveying your area: don’t open or close doors, move furniture around, etc. Keep everything the way it normally is.
- If you do decide to change something in your environment, make sure you redo the whole survey.
- Be sure to take readings from the entire perimeter of the area, as well as from the center.
- There is no need to get samples on both sides of an open doorway — one sample right in the doorway is enough. If the door is usually closed, keep the door closed and take samples on both sides.
- There’s no need to take samples close to each other if there are no obstacles between them — the Signal Level is unlikely to change significantly.
- You may get better signal strength readings in the early morning or evening, when there aren’t so many people around, and there are fewer electronic devices providing interference. However, if you want to map realistic “everyday” conditions, then you will want to take your readings during a busy time of day.
- Avoid taking readings during thunderstorms or downpours. Excessive humidity or high temperatures may also affect your readings.
- We definitely recommend turning off all potentially conflicting electronic appliances when running a survey, like microwave ovens, radio telephones, and even cell phones. Of course, this doesn’t apply if you are searching for sources of noise.
- The same applies to any other apps accessing your Airport adapter when the survey is active: turn them off. And be sure to turn off Internet Sharing as well.
Q: Can I scan several floors?
Sure, you can scan several floors, however each level should be saved as a separate project.
To perform a multi-level survey within one project, consider using NetSpot app.
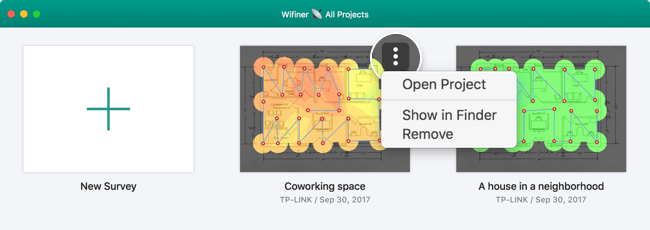
Q: How can I rename or remove a project?
You can remove or rename a project in the main window, by clicking on the three-dot menu of the project you want to work with.
Q: How do I edit or change a map?
How you edit your map depends on the source it came from:
- If you created your map in another application, you will need to edit the map in that program and then re-load it into Wifiner.
- If you scanned your map from a paper copy, you will need to make changes to the paper copy and then re-scan the map and load the new image into Wifiner.
- If you have already started scanning, you can no longer edit it. You will need to create a new project and re-load the map.
Q: How do I zoom in or out on a map?
You can zoom in or out on a map with the button combinations:
- command + to zoom in
- command – to zoom out
- Or pinch with two fingers on trackpad (should be enabled in system preferences)
Q: What are the system requirements?
Runs on a MacBook (macOS 10.10+) with a standard 802.11a/b/g/n/ac wireless network adapter. Supports 2.4 GHz and 5 GHz frequency bands at 20/40/80/160 MHz channels.
Q: Can I use my own servers to measure Download and Upload speed?
Not yet, however, we plan to add such a possibility soon.
Q: How do I change the values represented by the colors on the map?
You can easily adjust the values represented by each color on the heatmap visualizations. This can be useful if you have a situation where you don’t have a lot of color variation on your map and you want to make the subtle differences more evident. Or when you have a particular signal or noise level cut-off point and want to be able to highlight all areas that fall below that point.
To change the values, click on the Visualization Configuration gear icon, located to the right of the Visualization drop-down menu. There is a different configuration box for each visualization.
Q: How do I manually relocate an AP on a map?
Currently you can not manually relocate an AP, however we are working on it.