Jump to…
- Internet speed test
- Find available networks and compare them
- How to add a network to the comparison graph
- Types of graphs
- Filters
- Performing a Wireless Network Survey with NetSpot for Android
- Performing a predictive survey
- FAQ
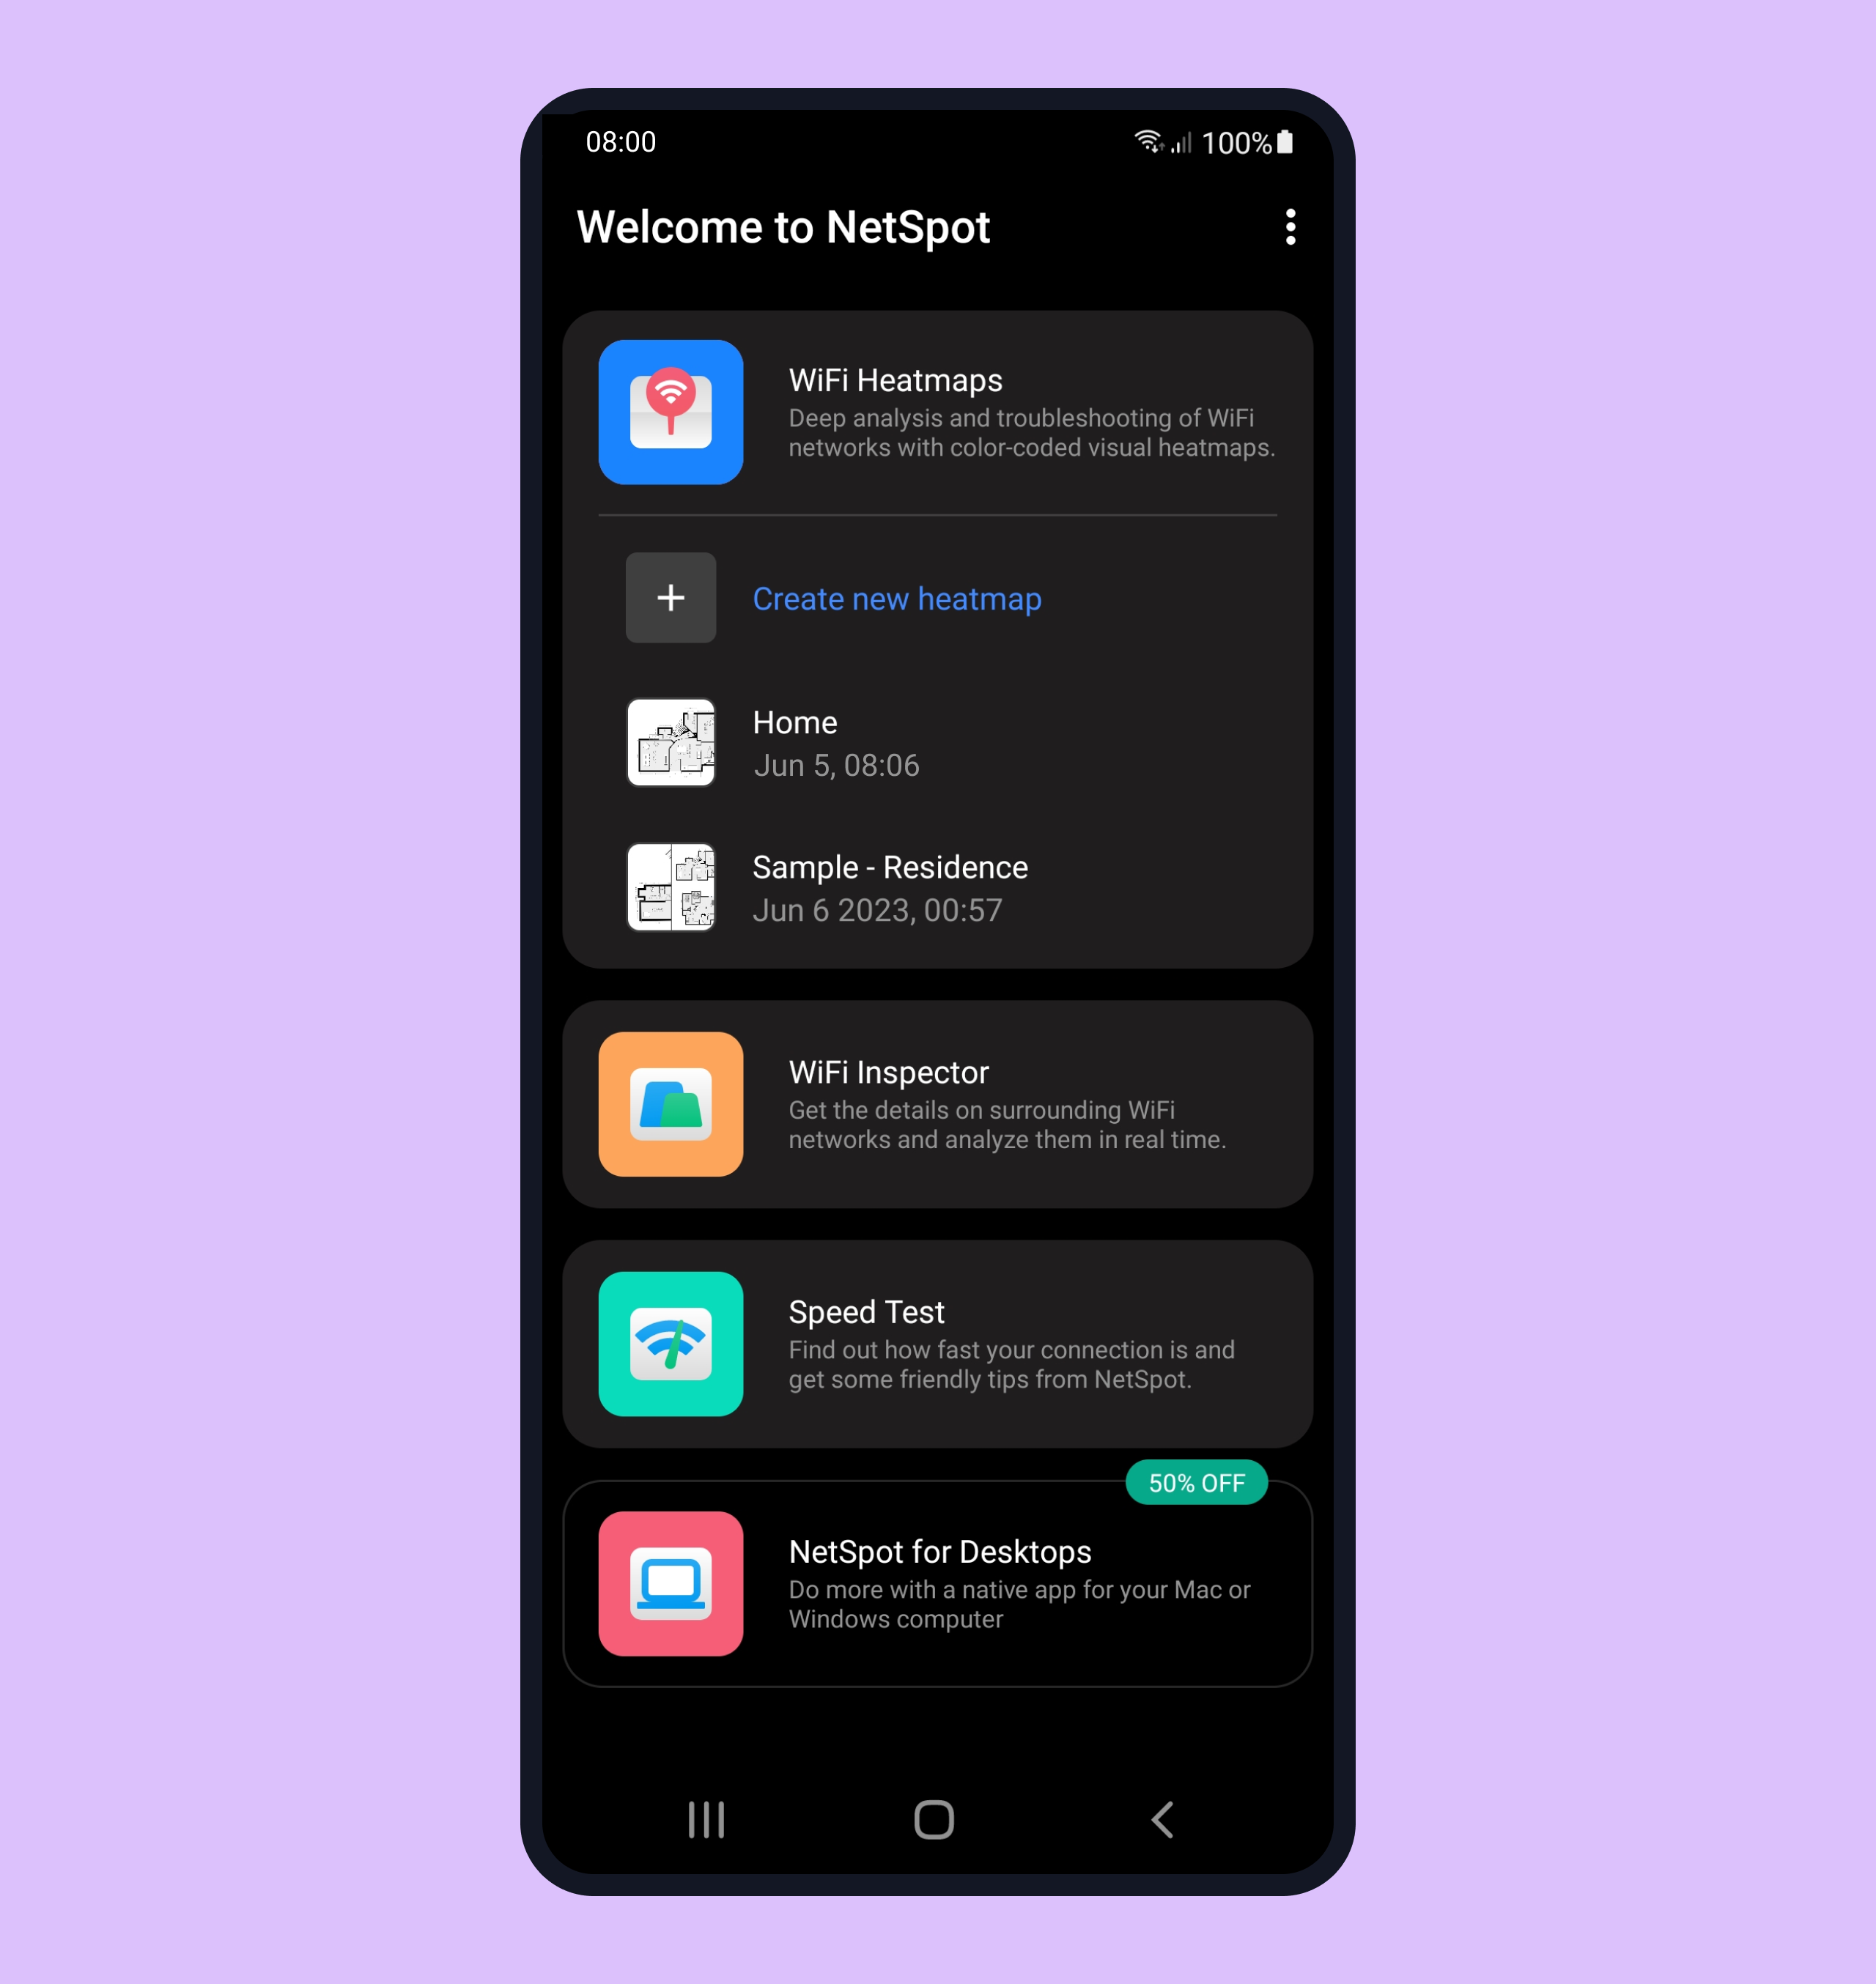
Welcome to the first truly mobile NetSpot — an Android one!
NetSpot for Android allows discovering WiFi networks around you to examine and compare their parameters. You can also perform a wireless survey of your WiFi network for in-depth analysis, generate Wi-Fi heatmaps, and troubleshoot your wireless coverage using your phone or tablet.
Internet speed test
Ready to test your Internet speed? NetSpot for Android is a great tool to be aware of your Internet speed values and to observe any changes in them.
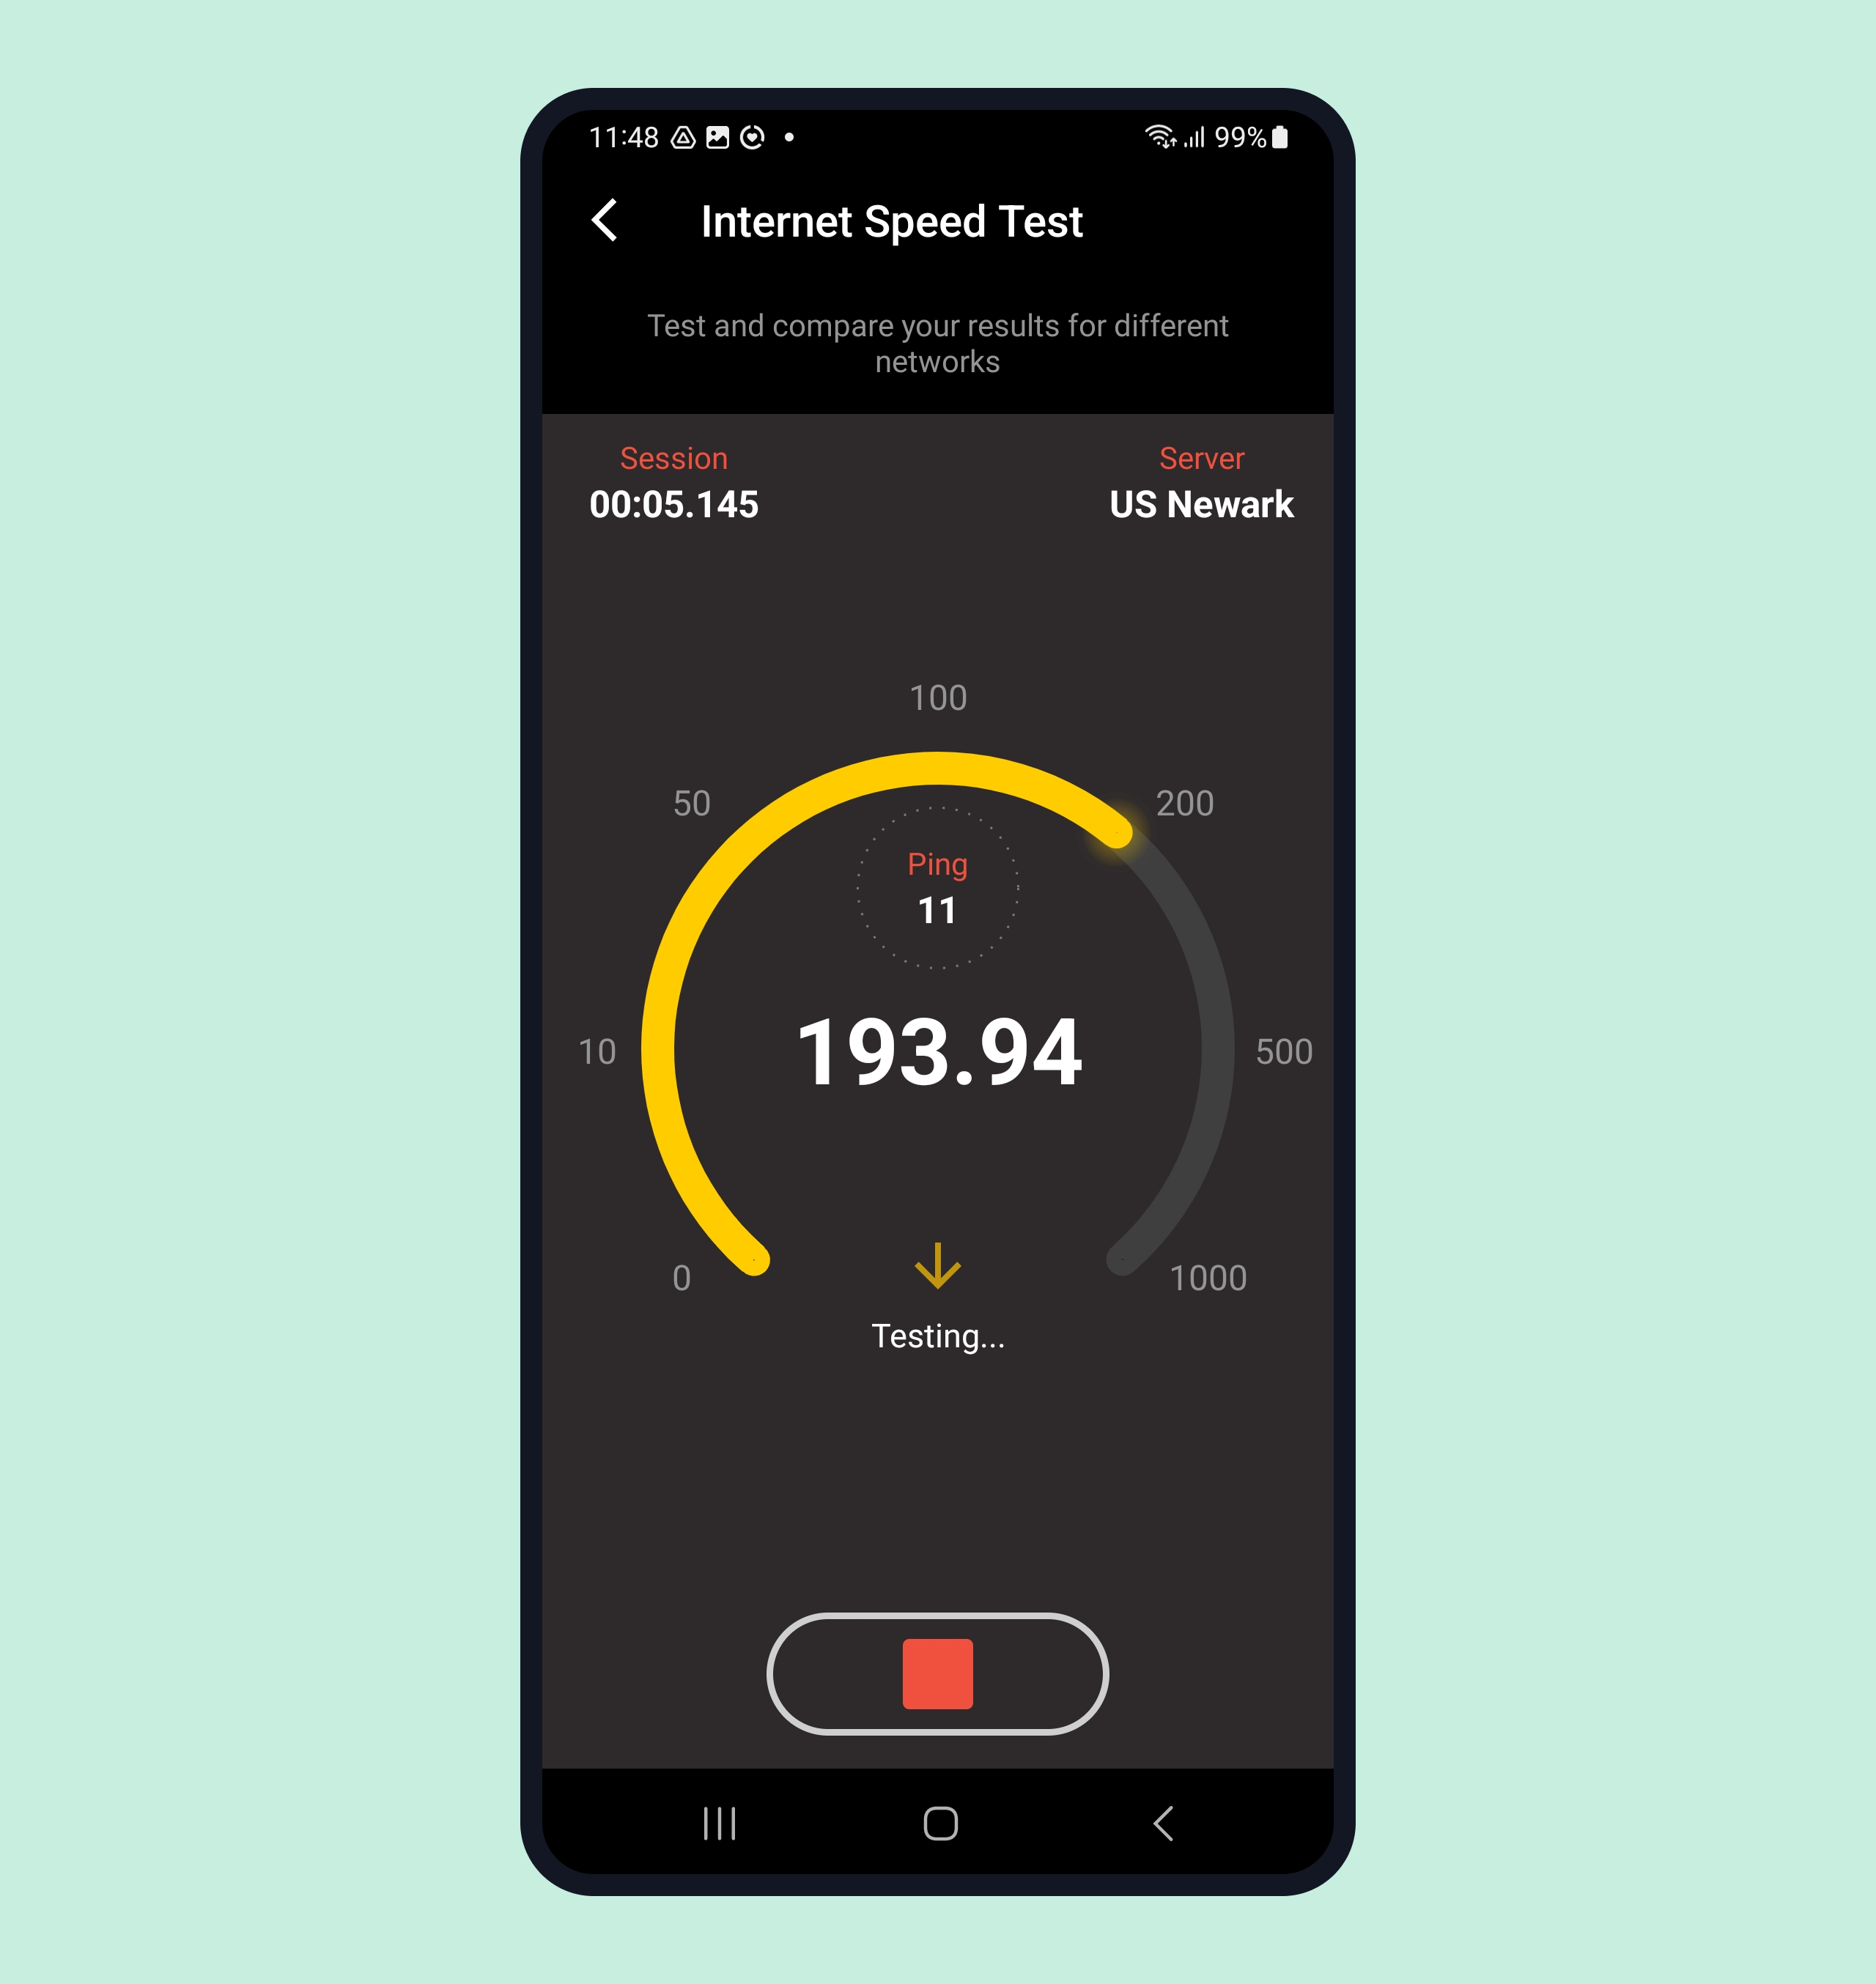
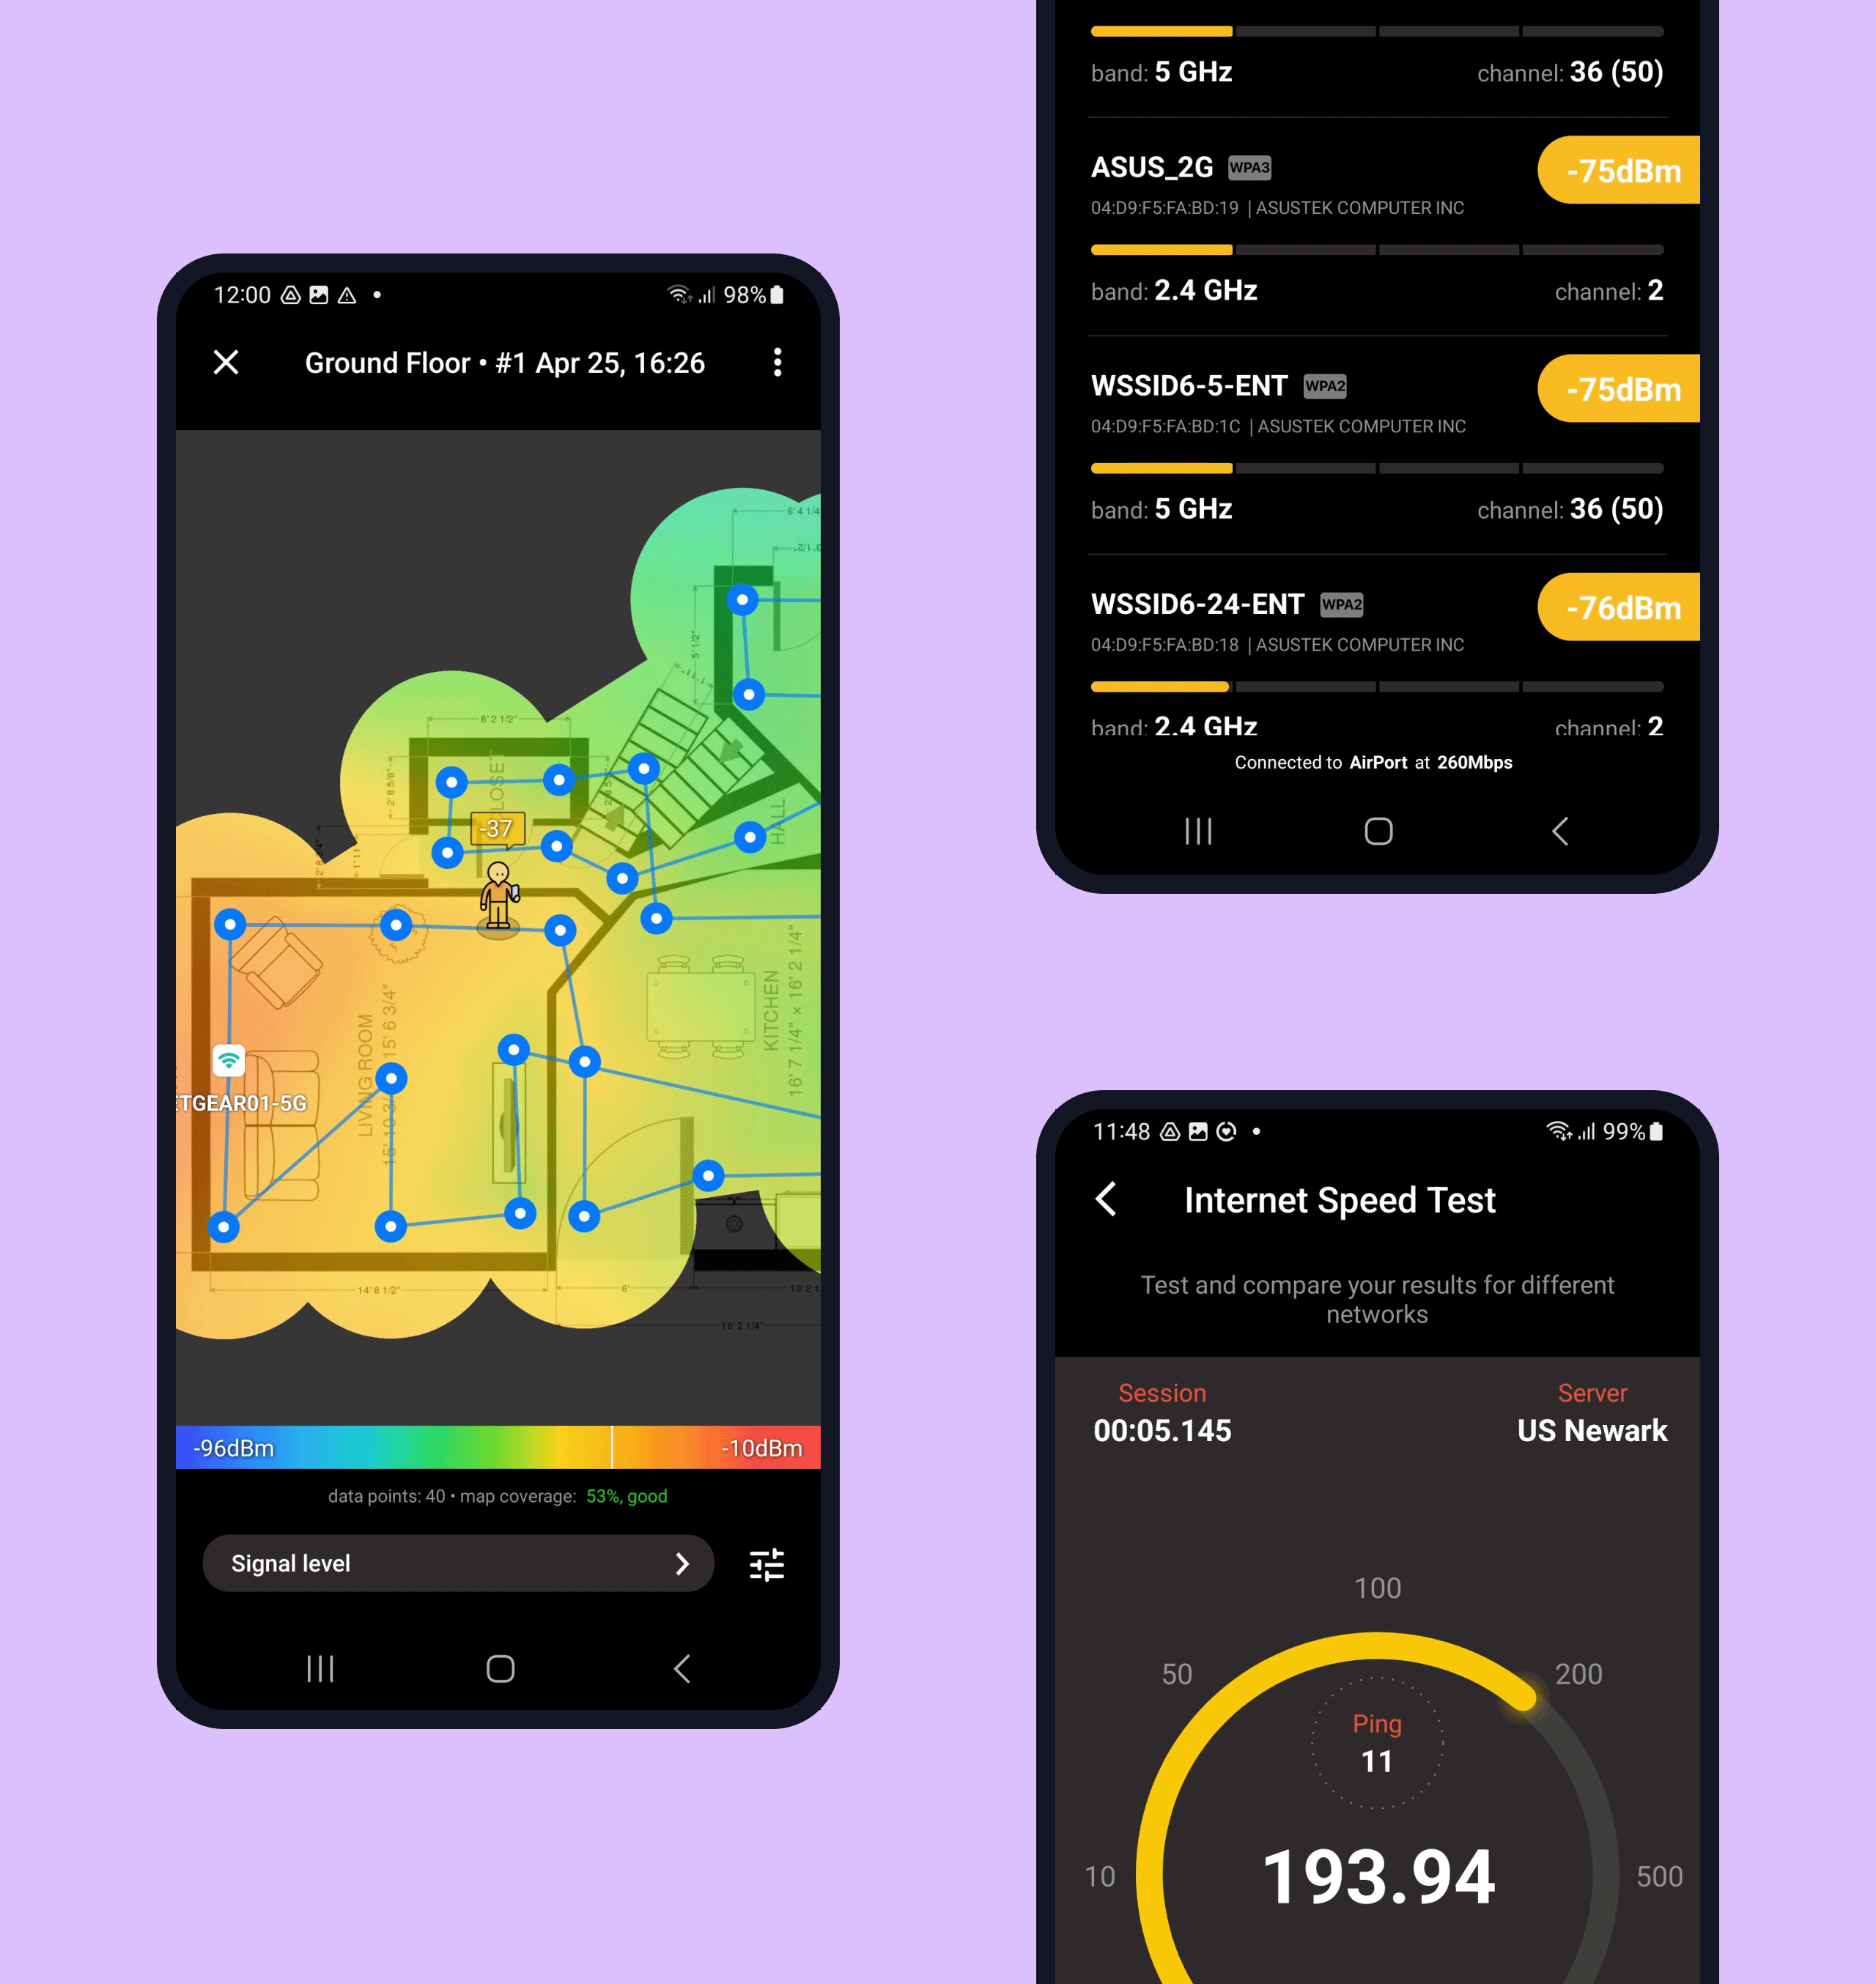
When you open NetSpot you’ll see the Welcome screen with three main options:Wi-Fi Inspector, Survey, Internet Speed Test. Tap the latter to begin.
If you have recently performed this test, the previous value of your Internet speed for the network you analyzed will be displayed as well as the information on the time of the test and the server used. It will also show you the ping value from last time. To run a fresh test, tap the previous test results for the detailed view, and tap Start there. Wait for the process to be completed to get the updated data.
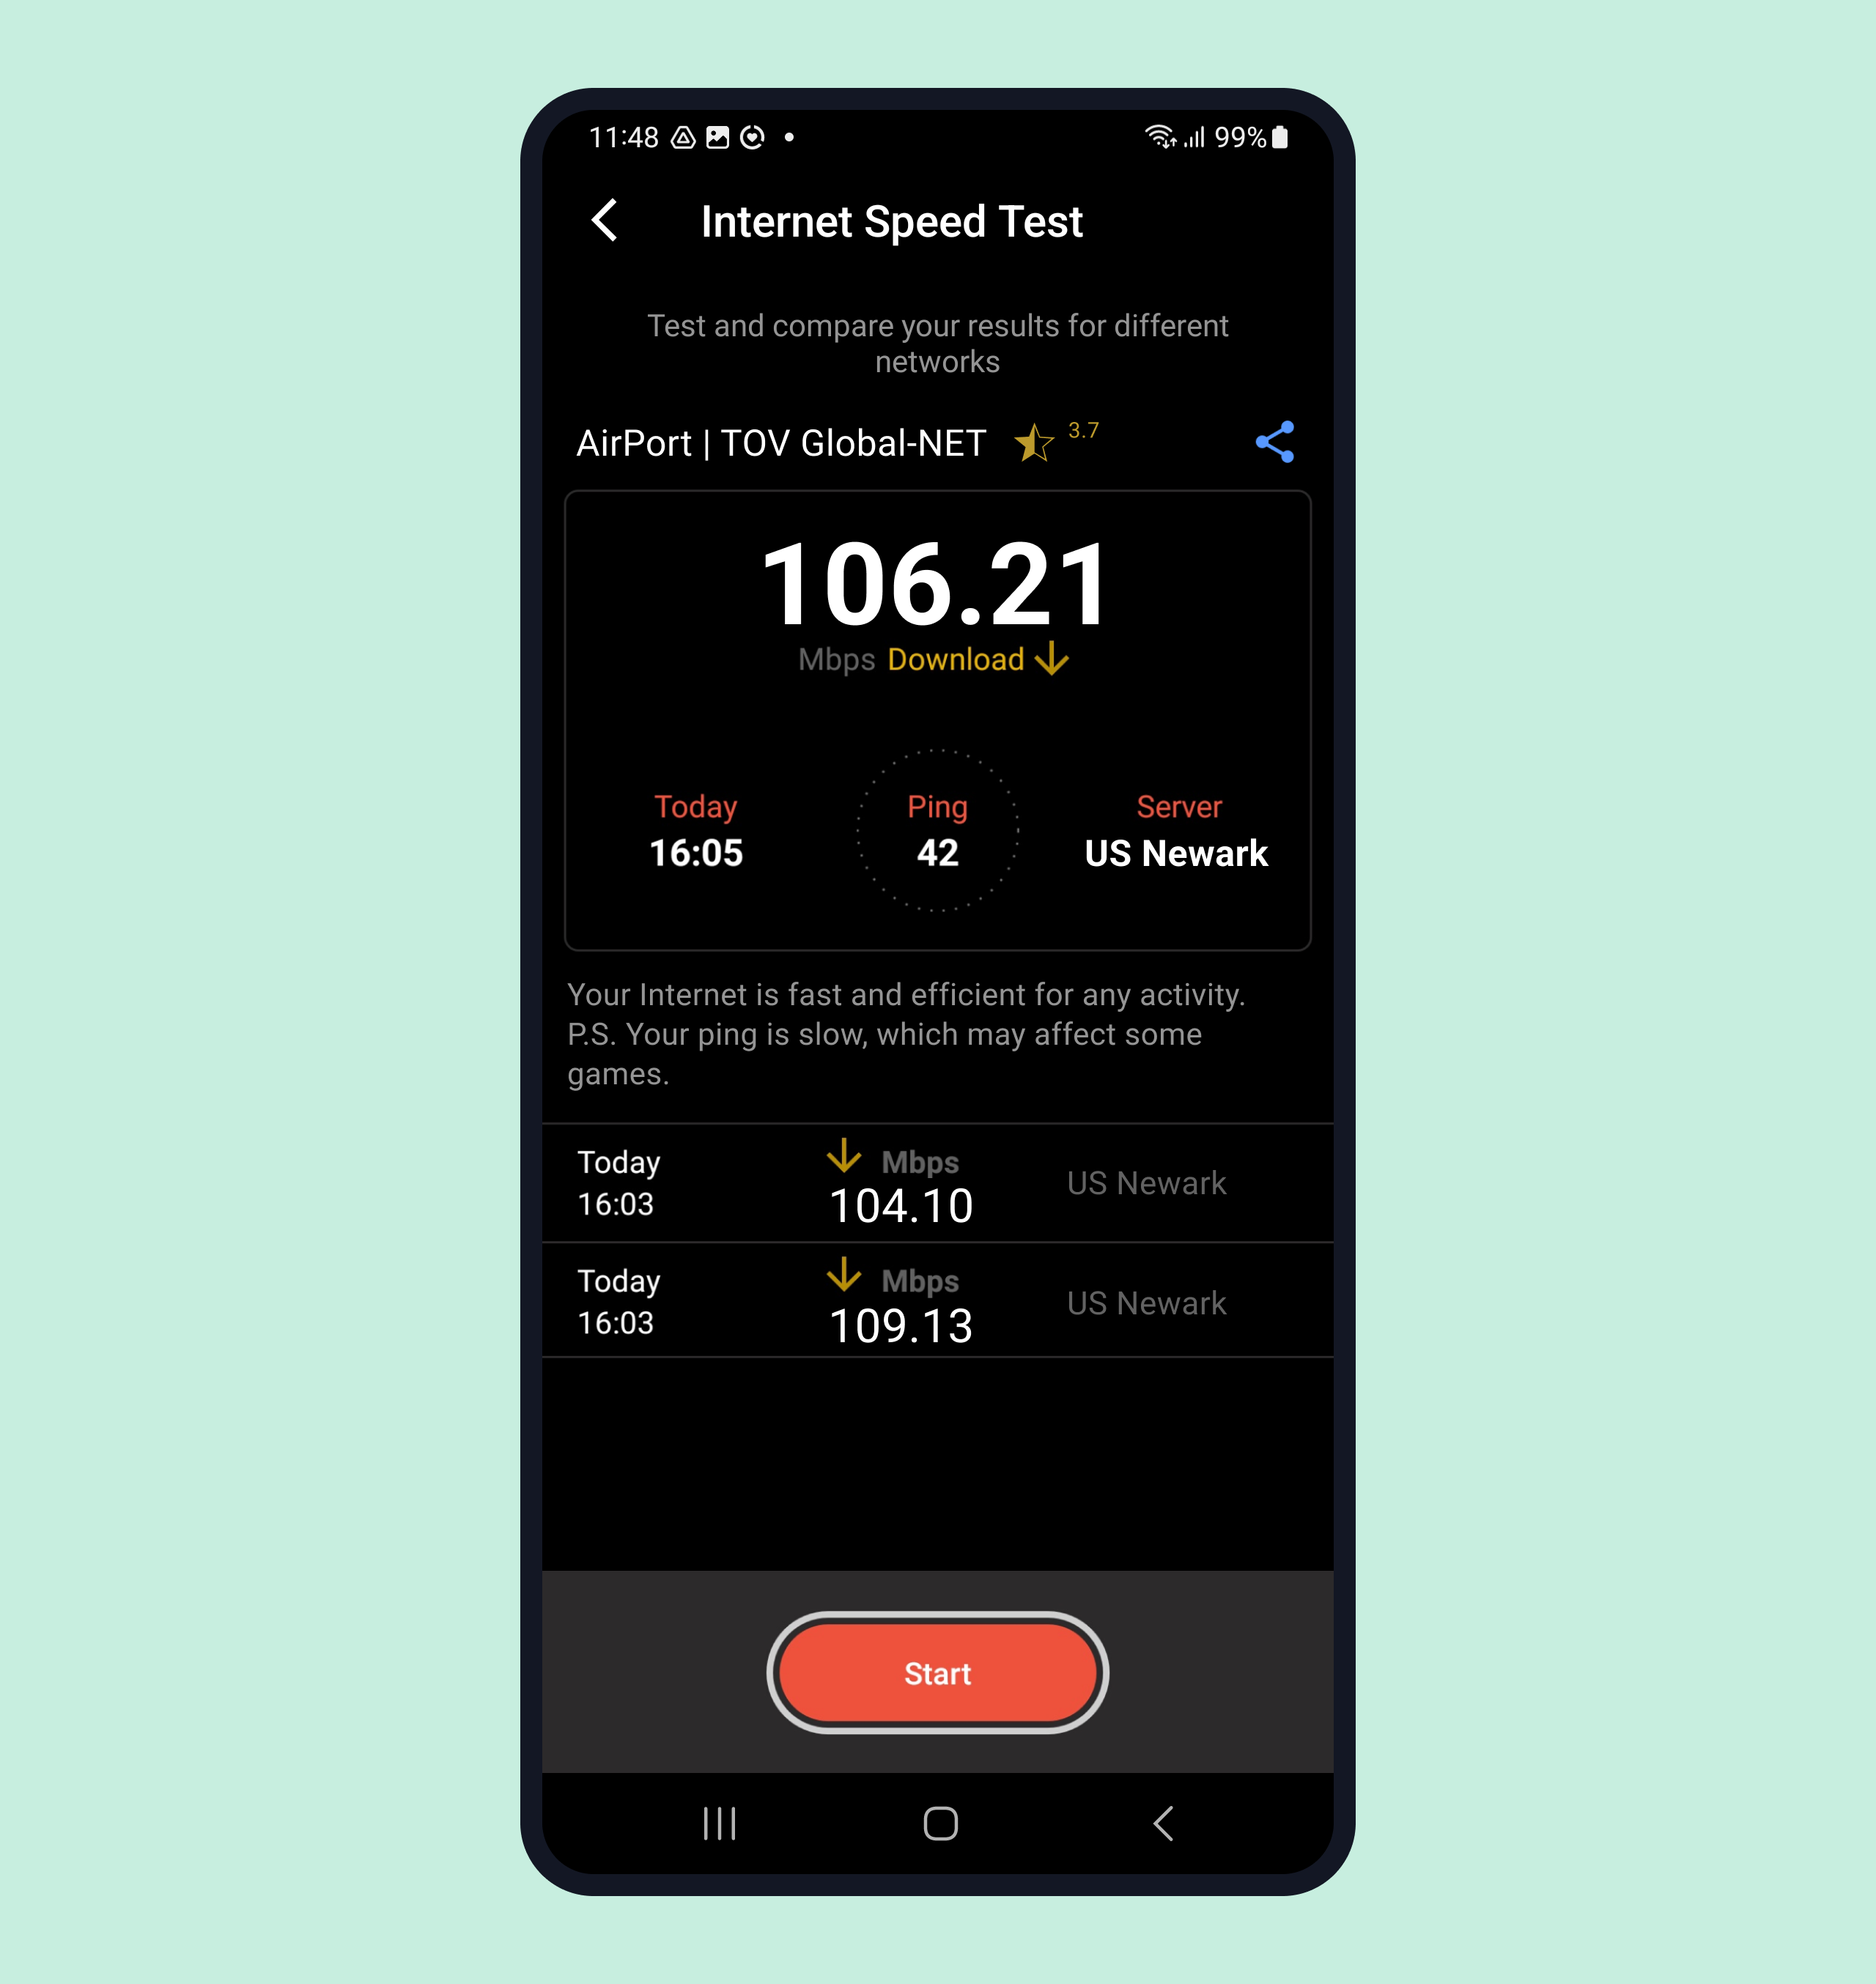
Upon the test completion you’ll see the following details:
- Download speed (Mbps) – indicates how fast your device downloads data from the Internet. If you have been noticing your Internet connection to be insufficient for your activities, you can trace the connection with the resulting Download speed measurement.
- Ping (milliseconds – ms) – the stretch of time it takes a data packet sent from your computer to reach a remote recipient. It is an important parameter for such activities as online games or video calls. The ping and subsequently the latency value depend on the distance between your computer and the reference server.
- The location of a remote server that was used in this test.
- Date and time the measurements take place.
How is my Internet speed?
Depending on what results you get after the Internet speed test is complete, NetSpot will give you some tips on what these values might mean for the quality of your Internet usage. If the Internet speed turns out to be low, that means it can only be suitable for basic activities like browsing. Your Internet speed might be fine and allow you more than just browsing, but still not quite there yet to offer browsing, downloading, streaming, and online gaming without any major slowdowns like a good Internet speed would. If you have a fast Internet speed then you are good to do any activity online without any hiccups at all.
Find available networks and compare them
There are two tabs in Inspector Mode in NetSpot for Android: Networks and Comparison.
The following options are available in Wi-Fi Inspector when scanning for wireless networks:
- To stop the wireless scanning process, tap Stop in the top-right corner. Tap Play to resume the scanning.
- To filter the displayed networks, tap the “Filter” icon in the top-right corner. You can filter WiFi networks by name, signal level, security protocol, and band. To go back to the networks list with filters applied, tap the left arrow at the top left.
- To reset the filters, just tap Reset in the top-right corner.
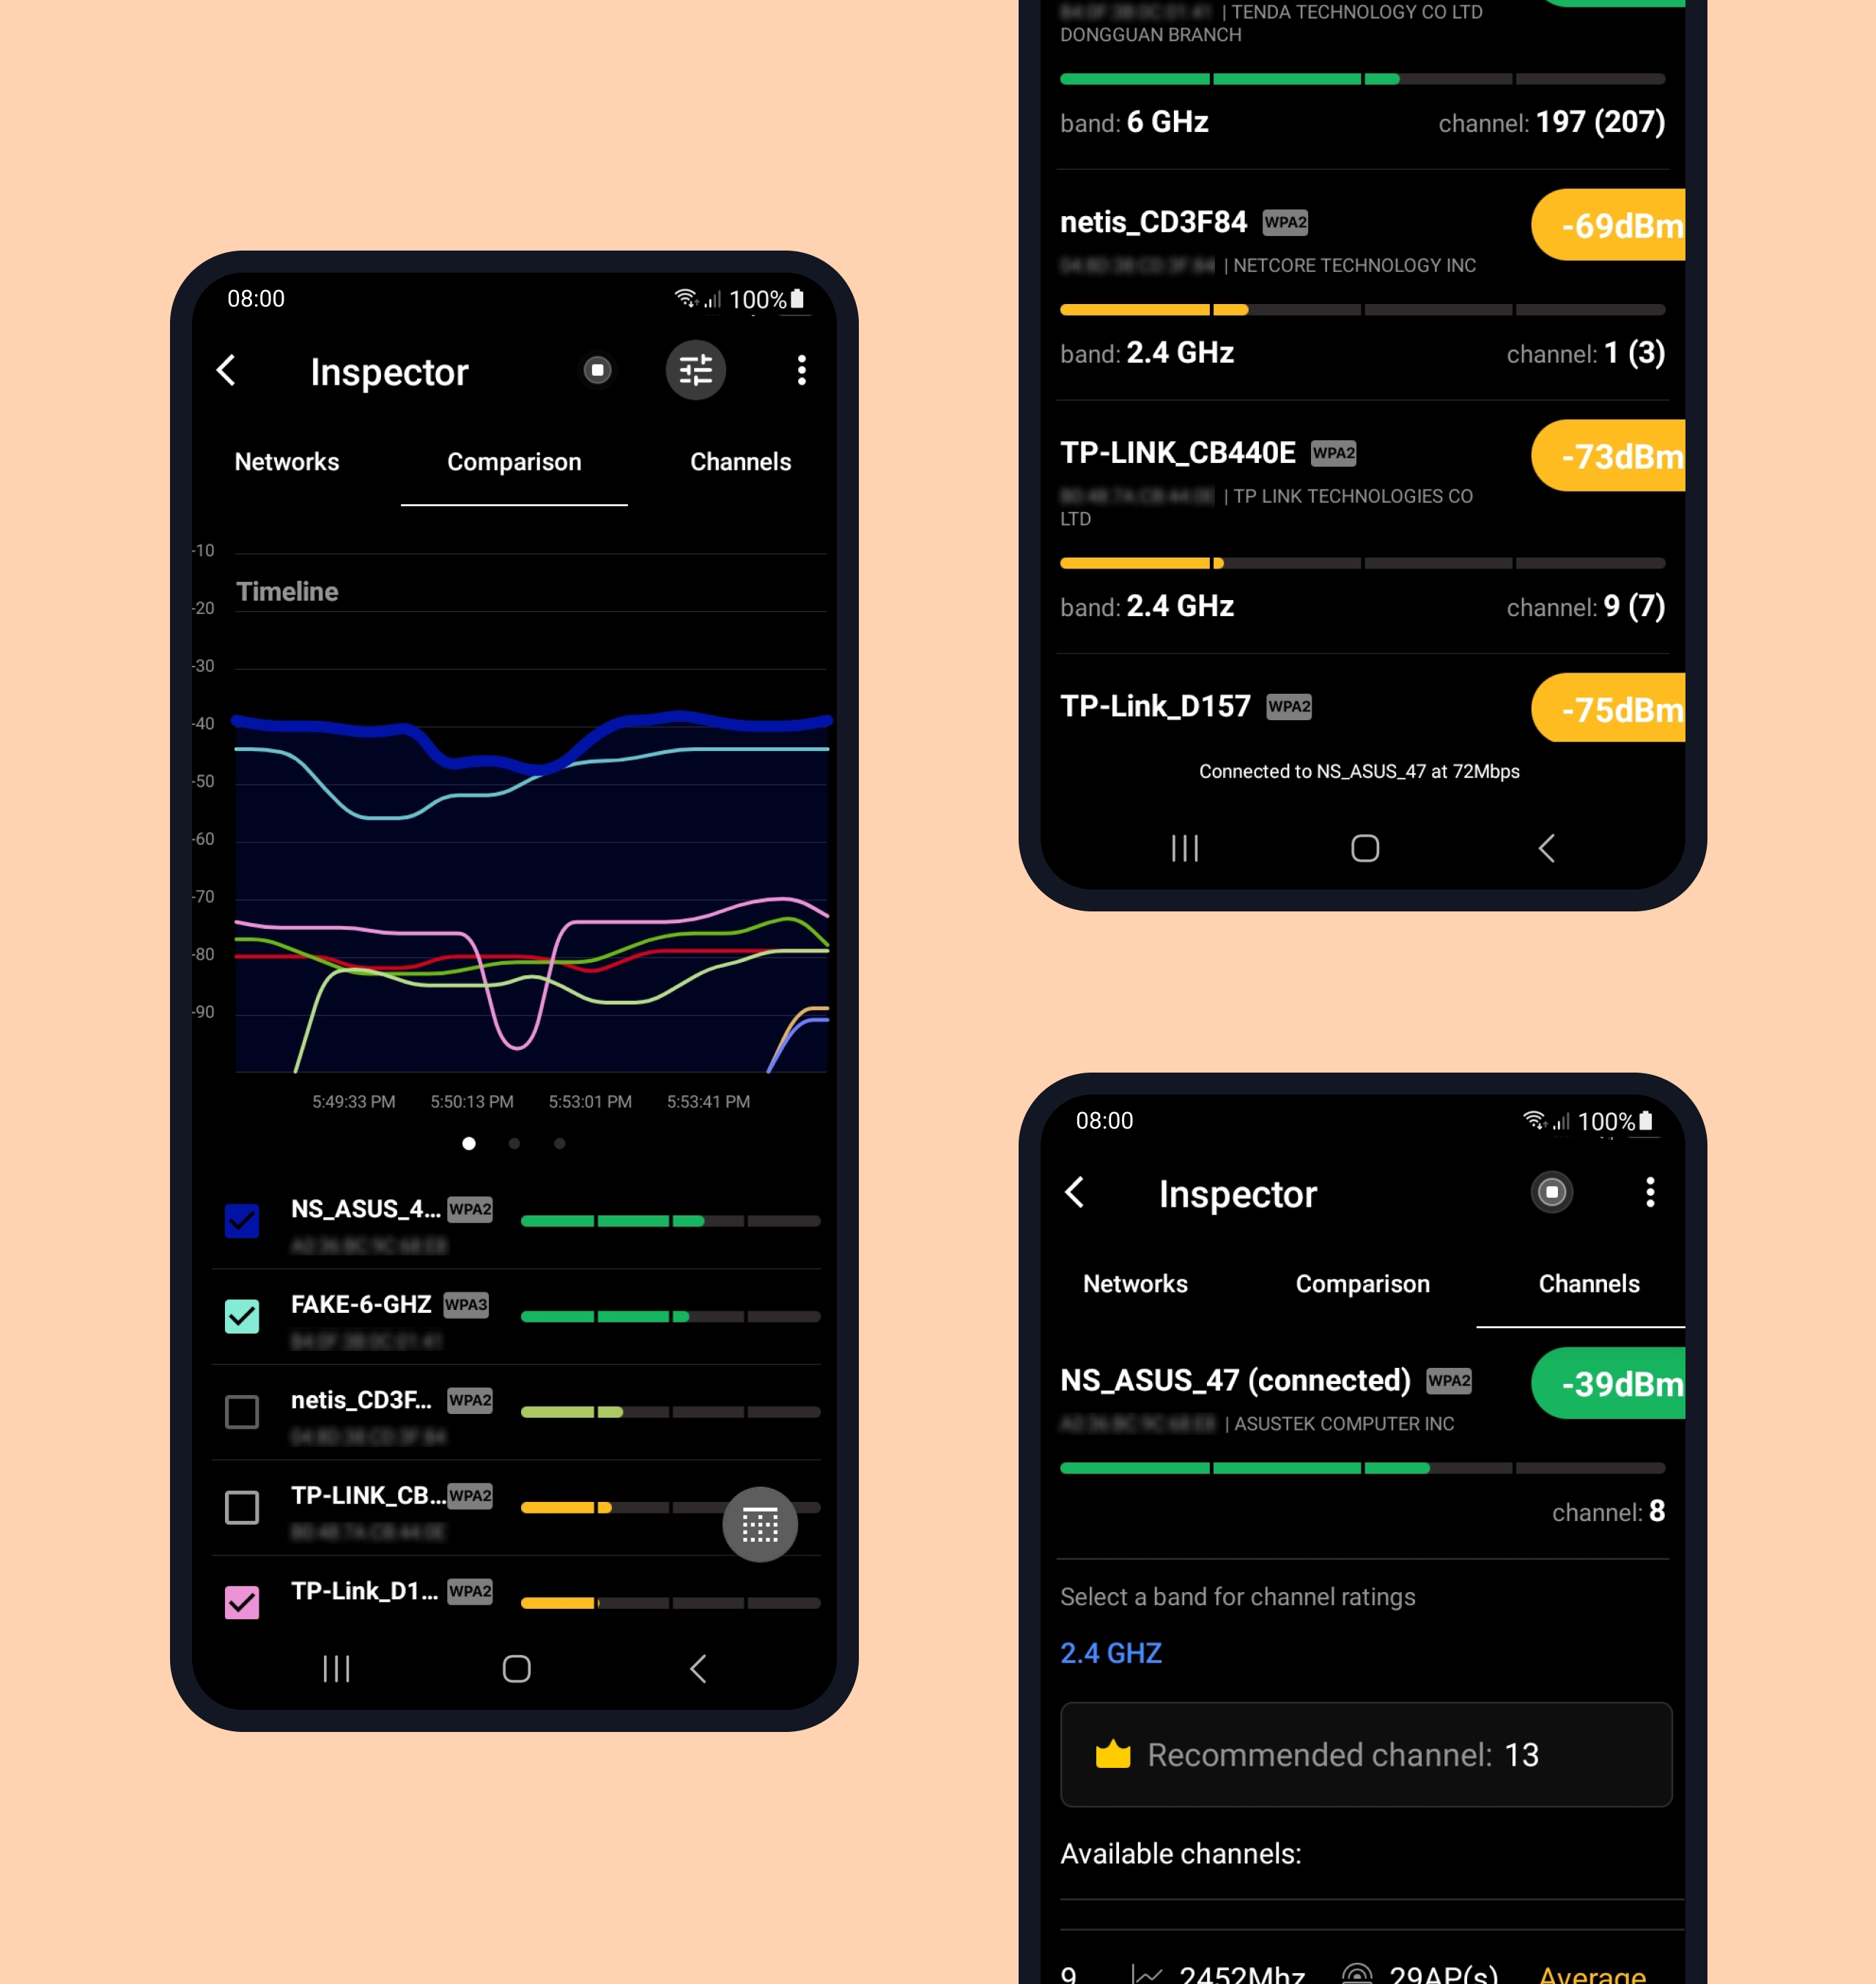
Networks
In this mode, you can see the list of all detected Wi-Fi networks. For every network the following data is shown:
- Network Name (e.g. TP-LINK_BCFF)
- MAC Address (e.g. F0:79:69:EA:98:27)
- Band (2.4 GHz, 5 GHz or 6 GHz)
- Signal (e.g. -61 dBm)
- Channel (1-229)
- Security protocol
You’ll see the color indication of WiFi signal strength in front of the name of every detected network. This data is renewed every 10 seconds (up to 30 seconds when WiFi throttling is enabled).
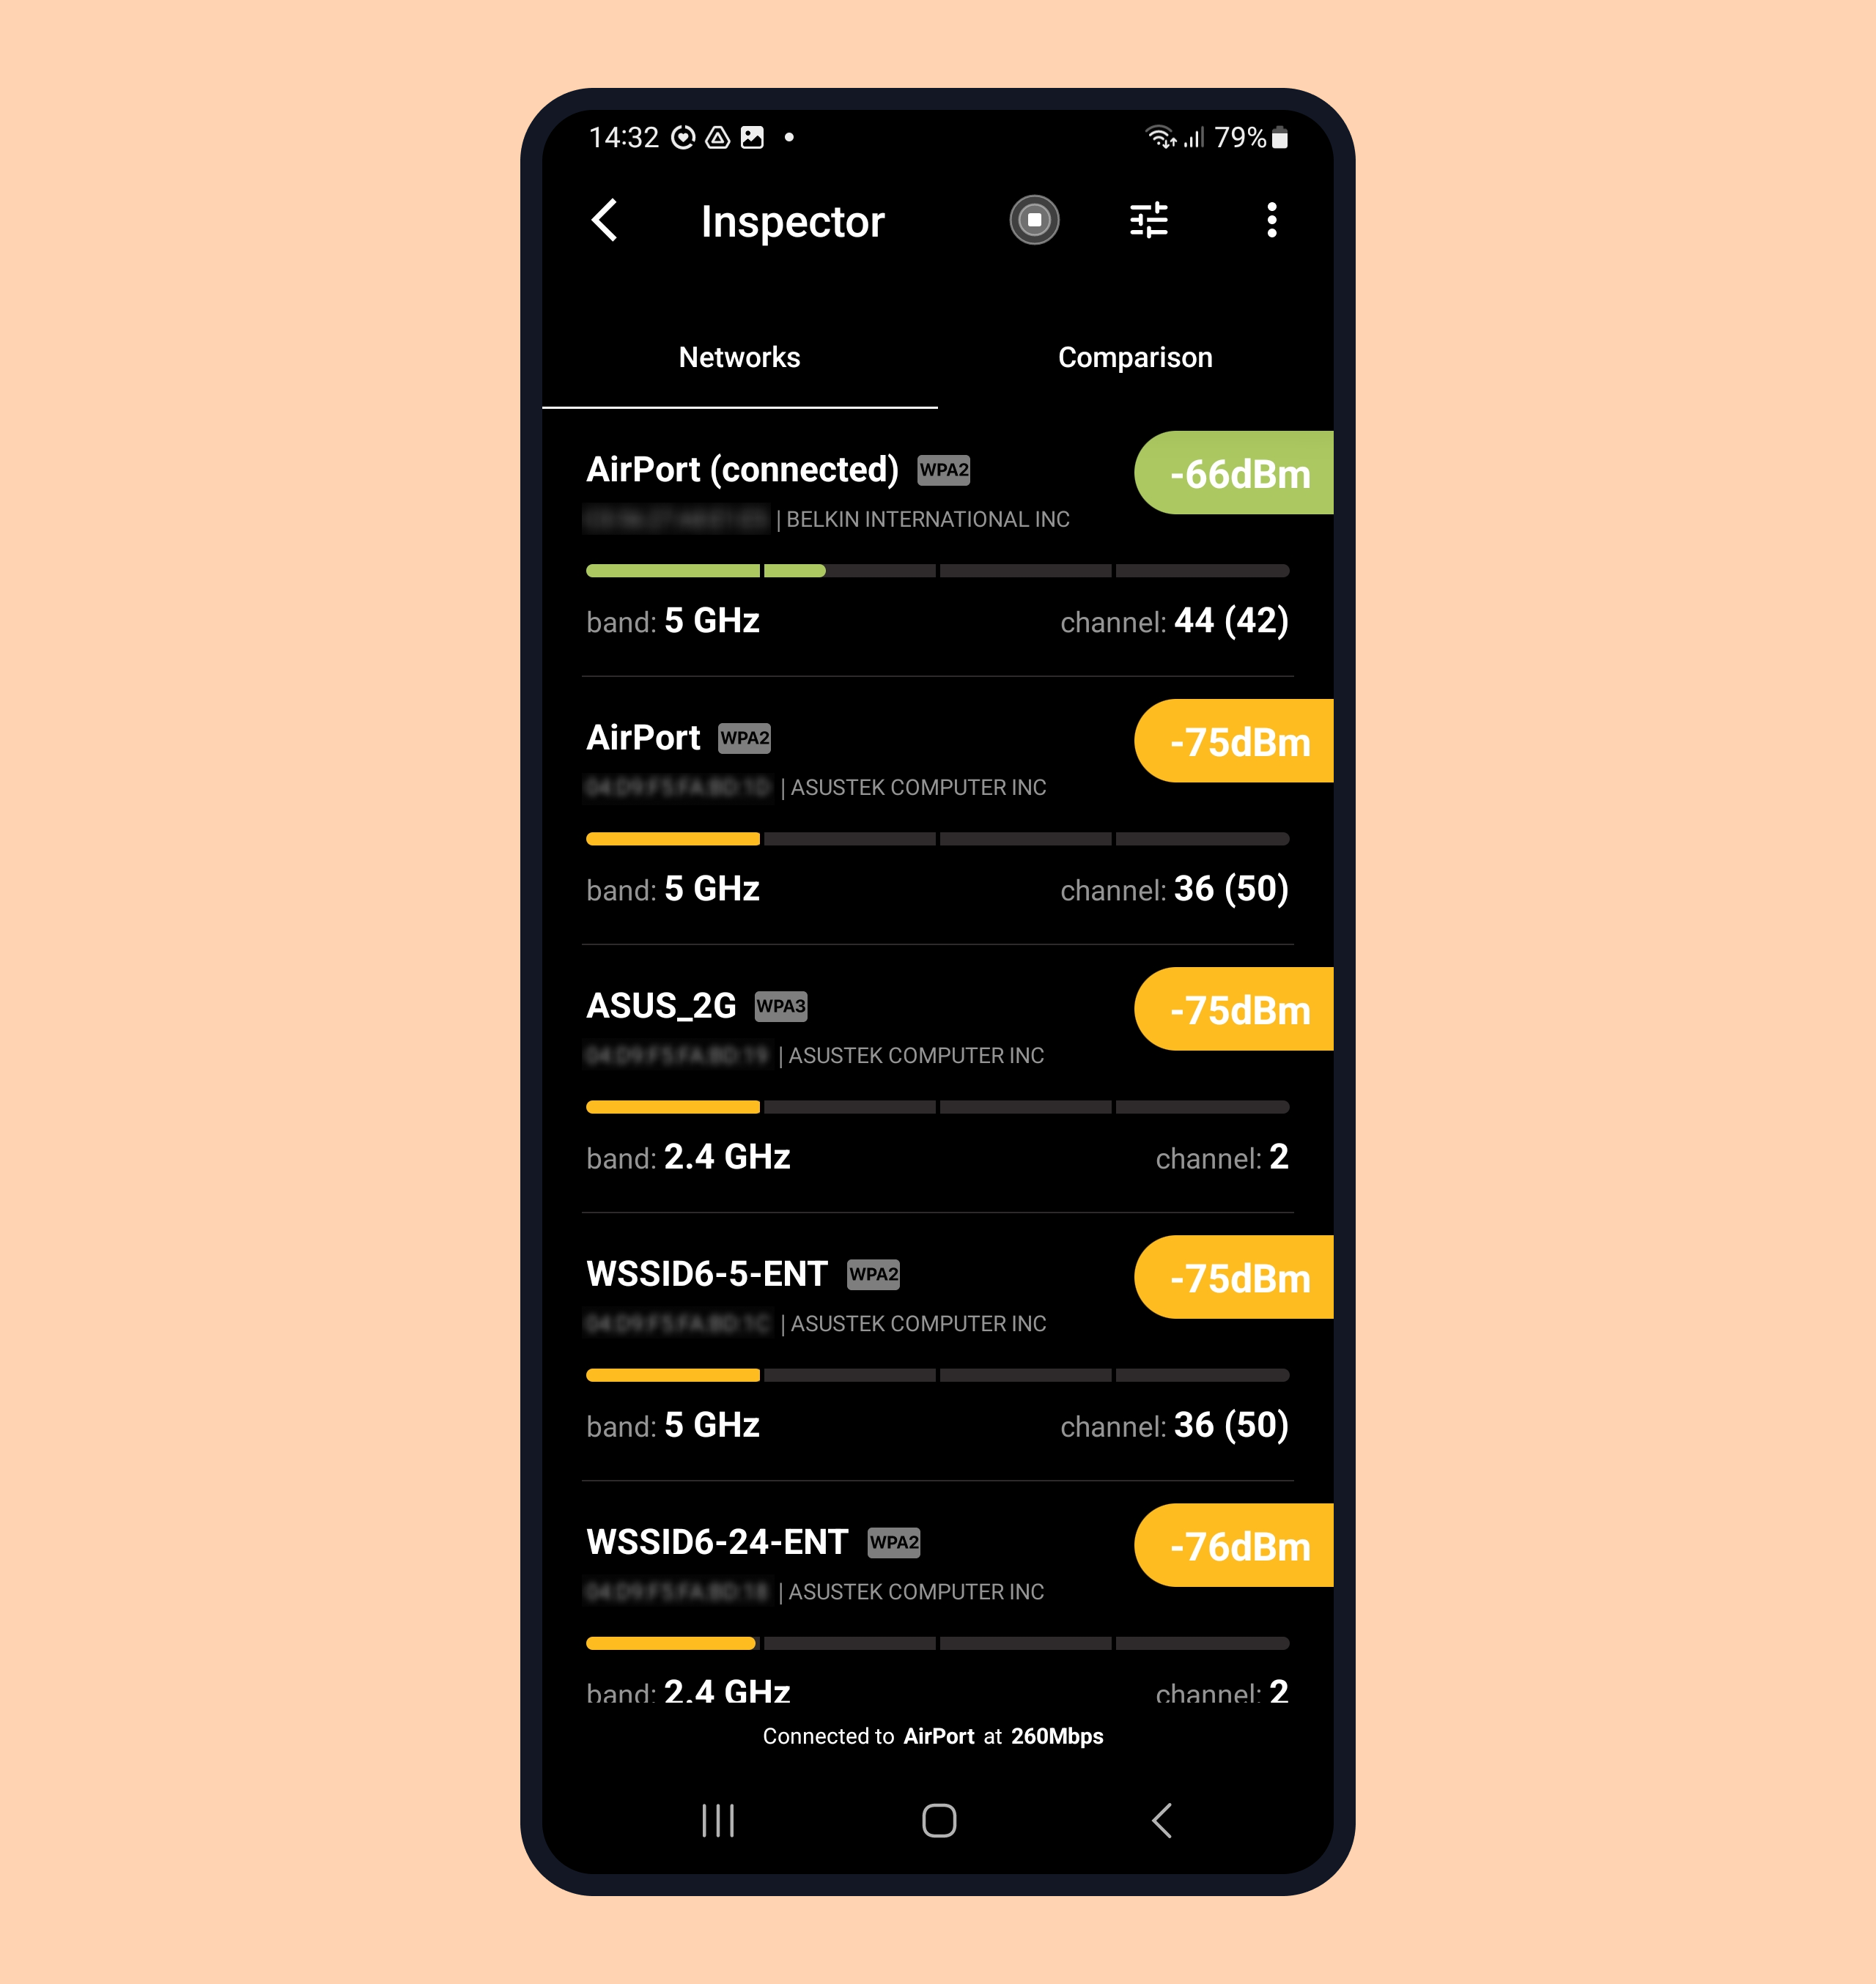
Color index:
Red – weak signal
Orange – poor signal
Yellow – average signal
Light-green – good signal
Green – strong signal
At the bottom of the screen you’ll see which network you are currently connected to and its signal strength.
Attention!
#1 – In your list, you might see currently active networks as well as those that are no longer actively detected:
– ACTIVE, if NetSpot can regularly collect the data about the network (signal strength);
– LOST, if NetSpot couldn’t collect any data about the network since the last scan. These networks display additional information as the “last seen X min ago” notification.
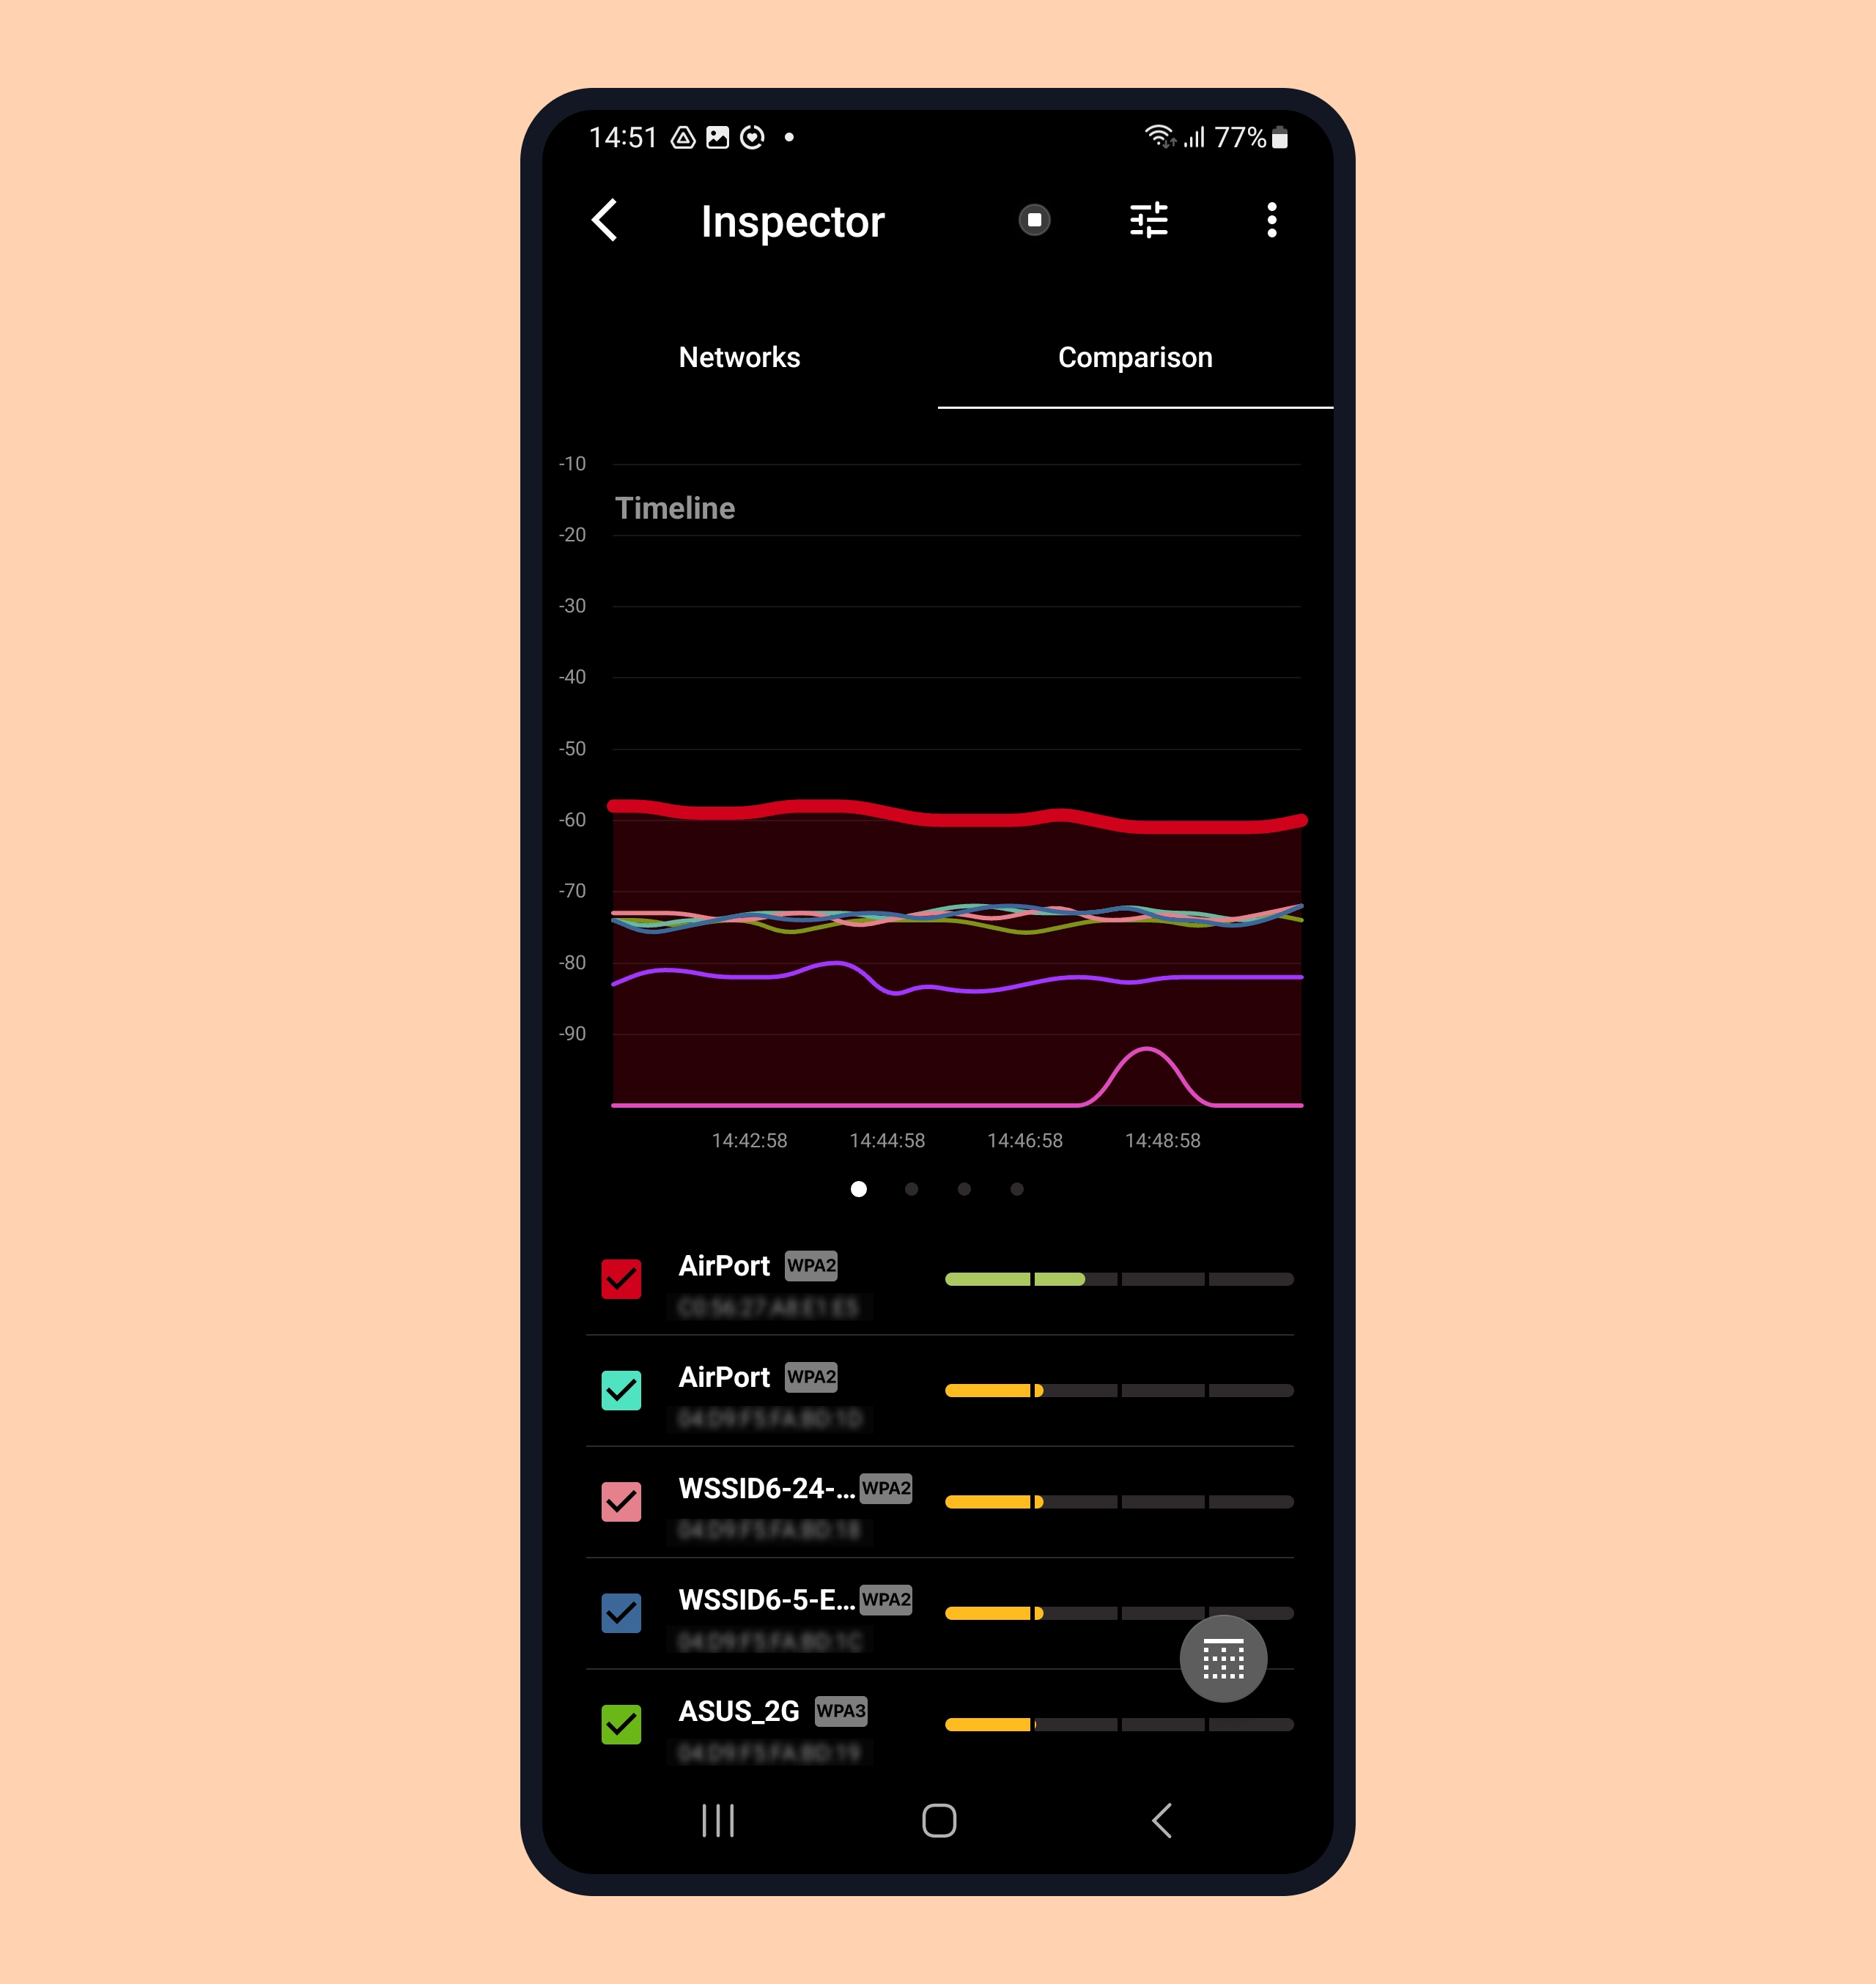
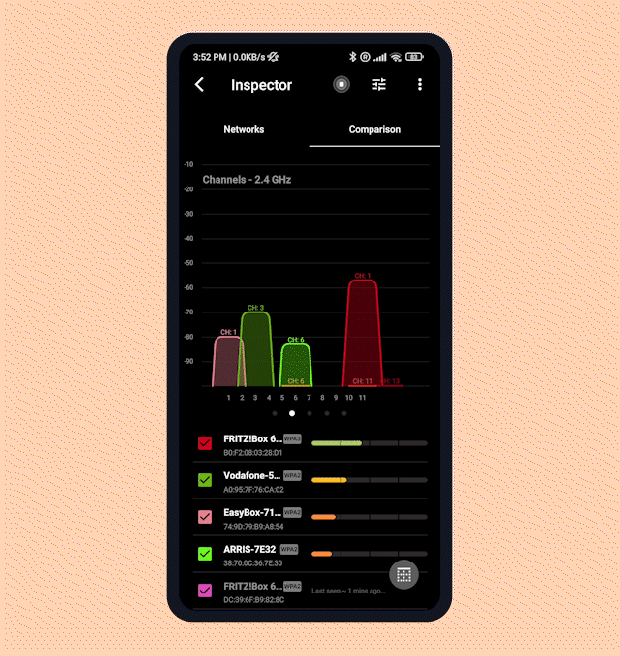
Comparison
This mode allows you to filter and compare networks according to certain parameters: frequency band, signal level, security protocol. You’ll also see such information as which channels a network broadcasts on and whether there is a channel overlap. To switch to Comparison mode, tap the corresponding tab or just swipe left.
Best channels
This mode helps you select the most suitable channels to use for your Access Points.
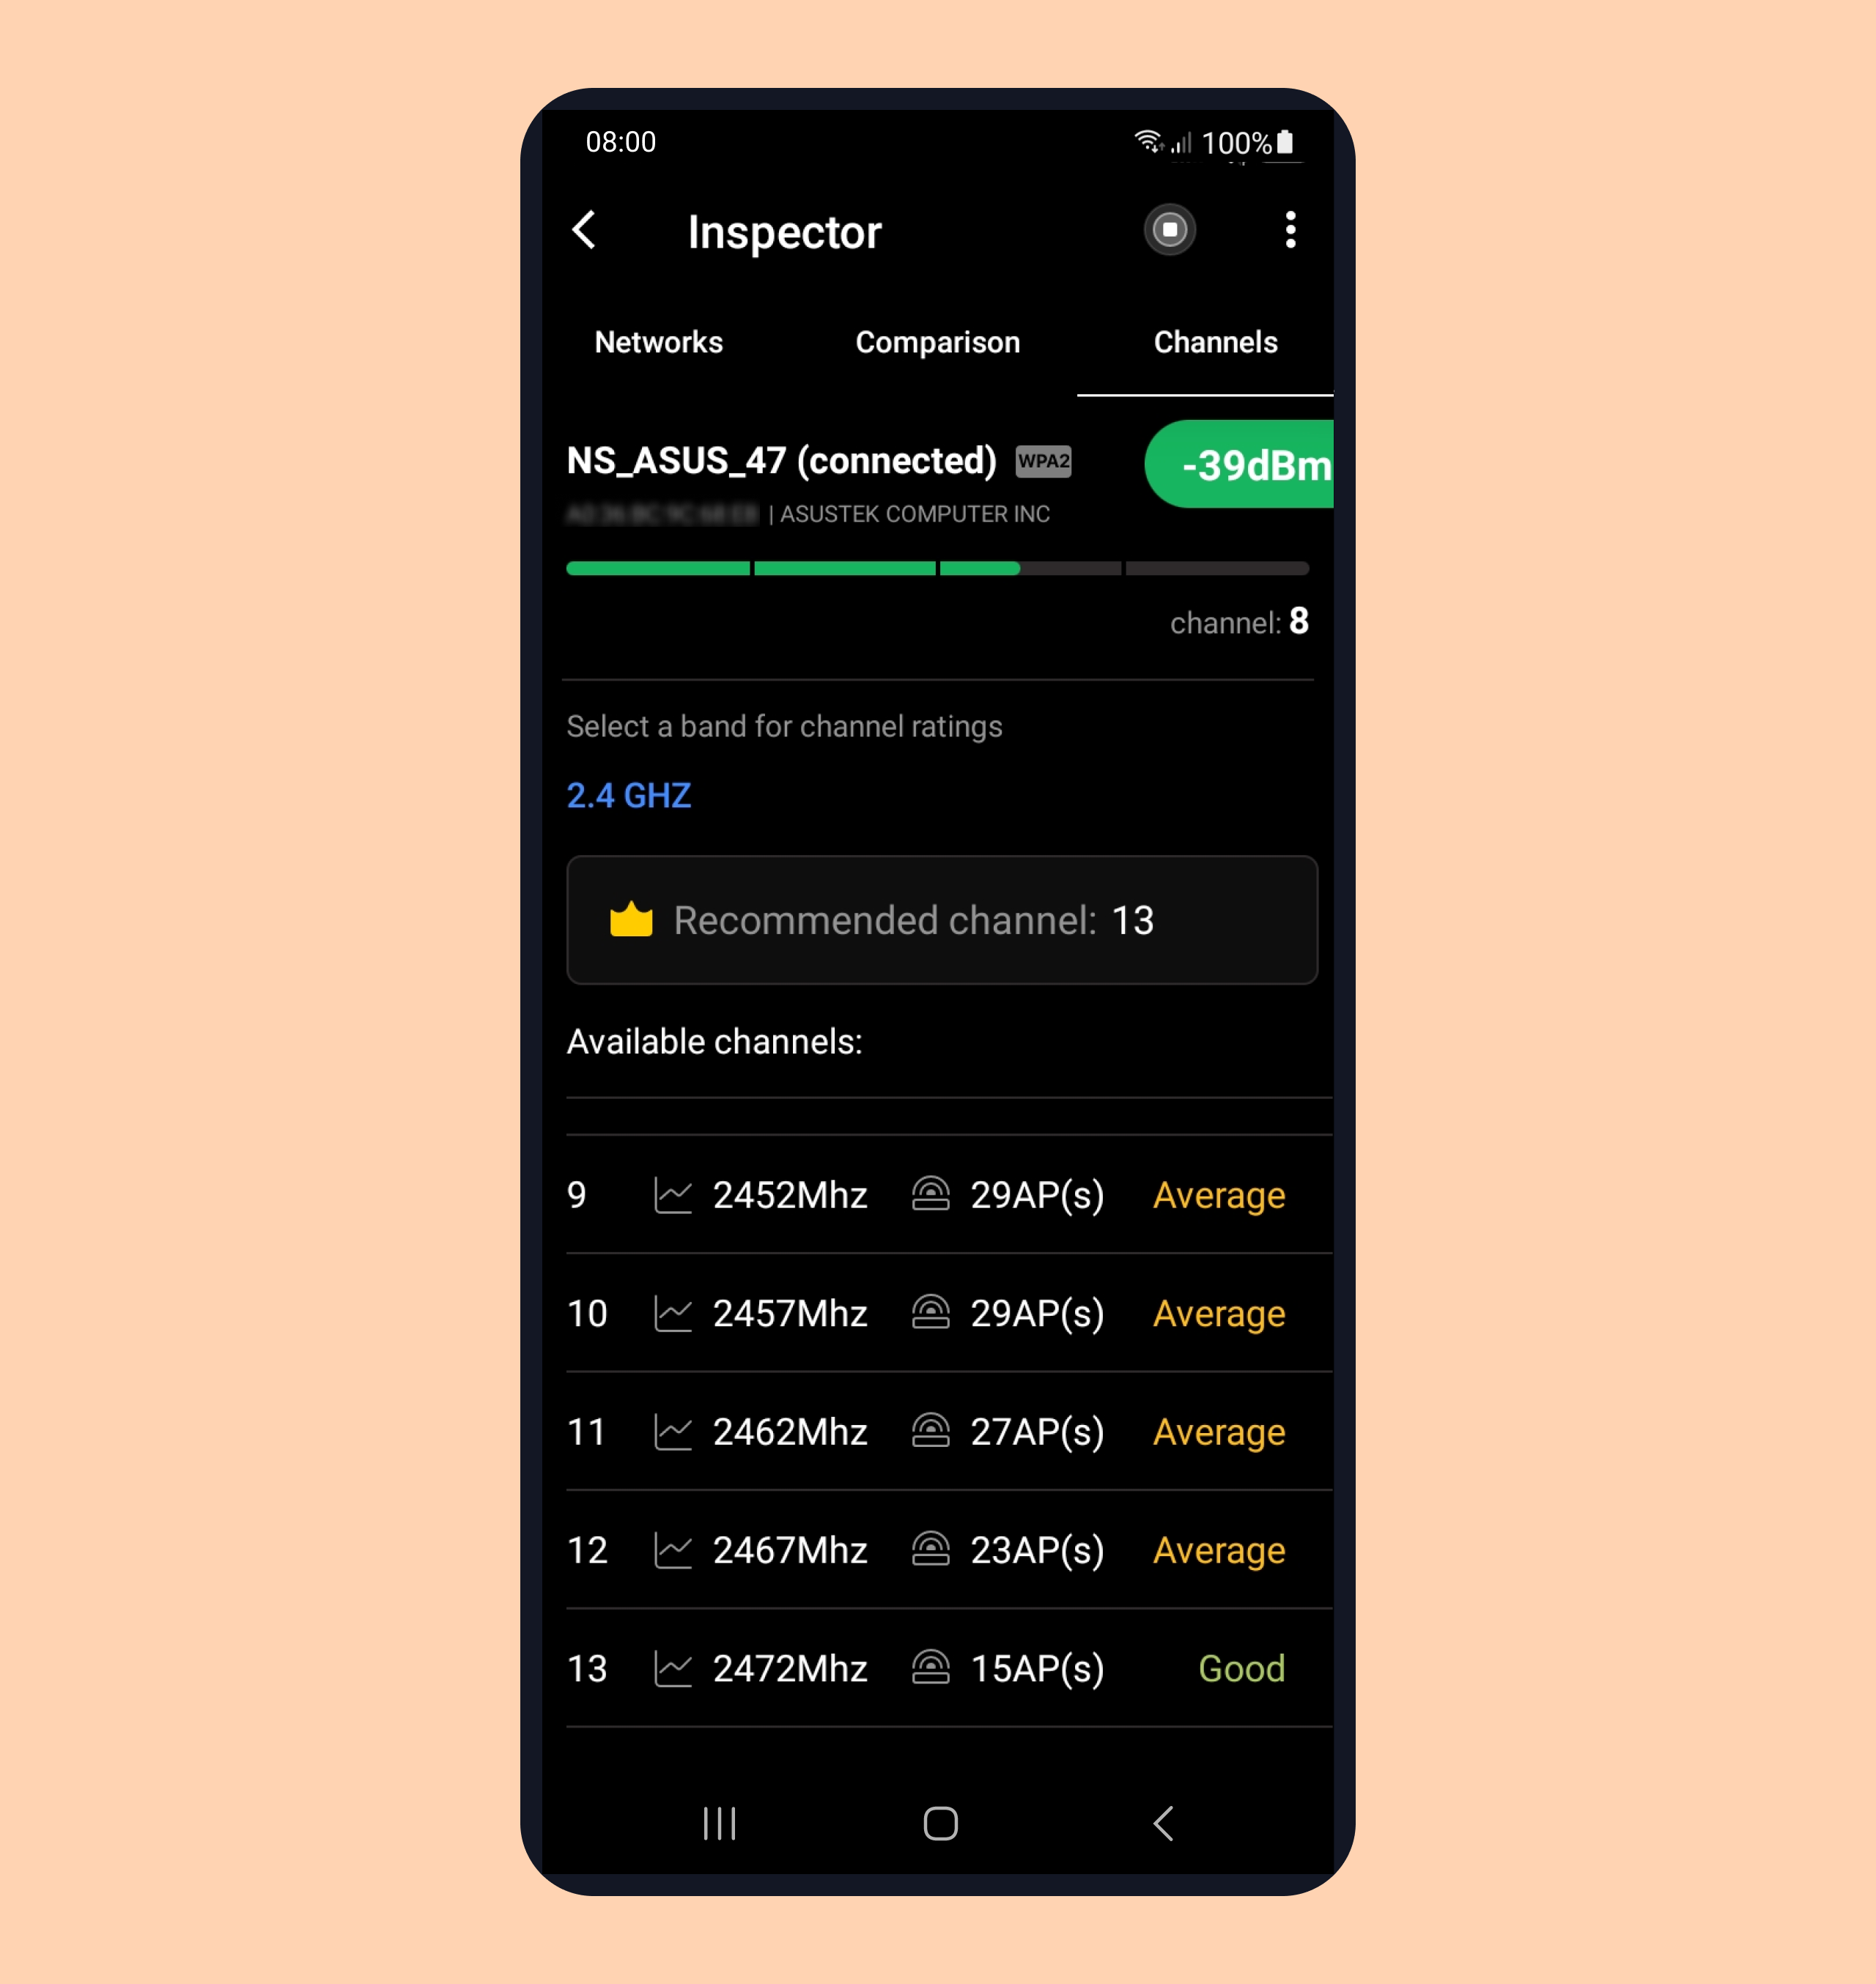
There are three tabs in this mode:
- 2.4 GHz – information about channels broadcasting on 2.4 GHz frequency band;
- 5 GHz – information about channels broadcasting on 5 GHz frequency band;
- 6 GHz – information about channels broadcasting on 6 GHz frequency band.
- The list of all channels available in a band;
- The level of existing load on a channel. The most available and least busy will be displayed as Strong, and the busiest and least available will be shown as Weak;
- A recommended channel. NetSpot will automatically analyze all collected data to select the optimal channel for an AP alongside two second best options.
Best Channels is aimed at enhancing WiFi connection thanks to the selection of the most optimal channel for a specific AP. It is a very straightforward option catering to any level of wireless networks knowledge.
How to add a network to the comparison graph
- — In Comparison mode select the networks you want to compare from the list by checking their boxes.
- — The color of the checkbox is the color of the network you’ll see in the graph.
The data on the graph will be refreshed in 10 seconds (up to 30 seconds when WiFi throttling is enabled).
Types of graphs
Signal Strength (Timeline)
With this graph, you can compare various wireless networks according to their WiFi signal strength.
Channel overlap for 2.4 GHz / 5 GHz / 6 GHz frequencies
This graph will show the channels on 2.4 GHz / 5GHz / 6GHz frequency bands that WiFi networks broadcast on. You’ll be able to clearly see a channel overlap when there is one.
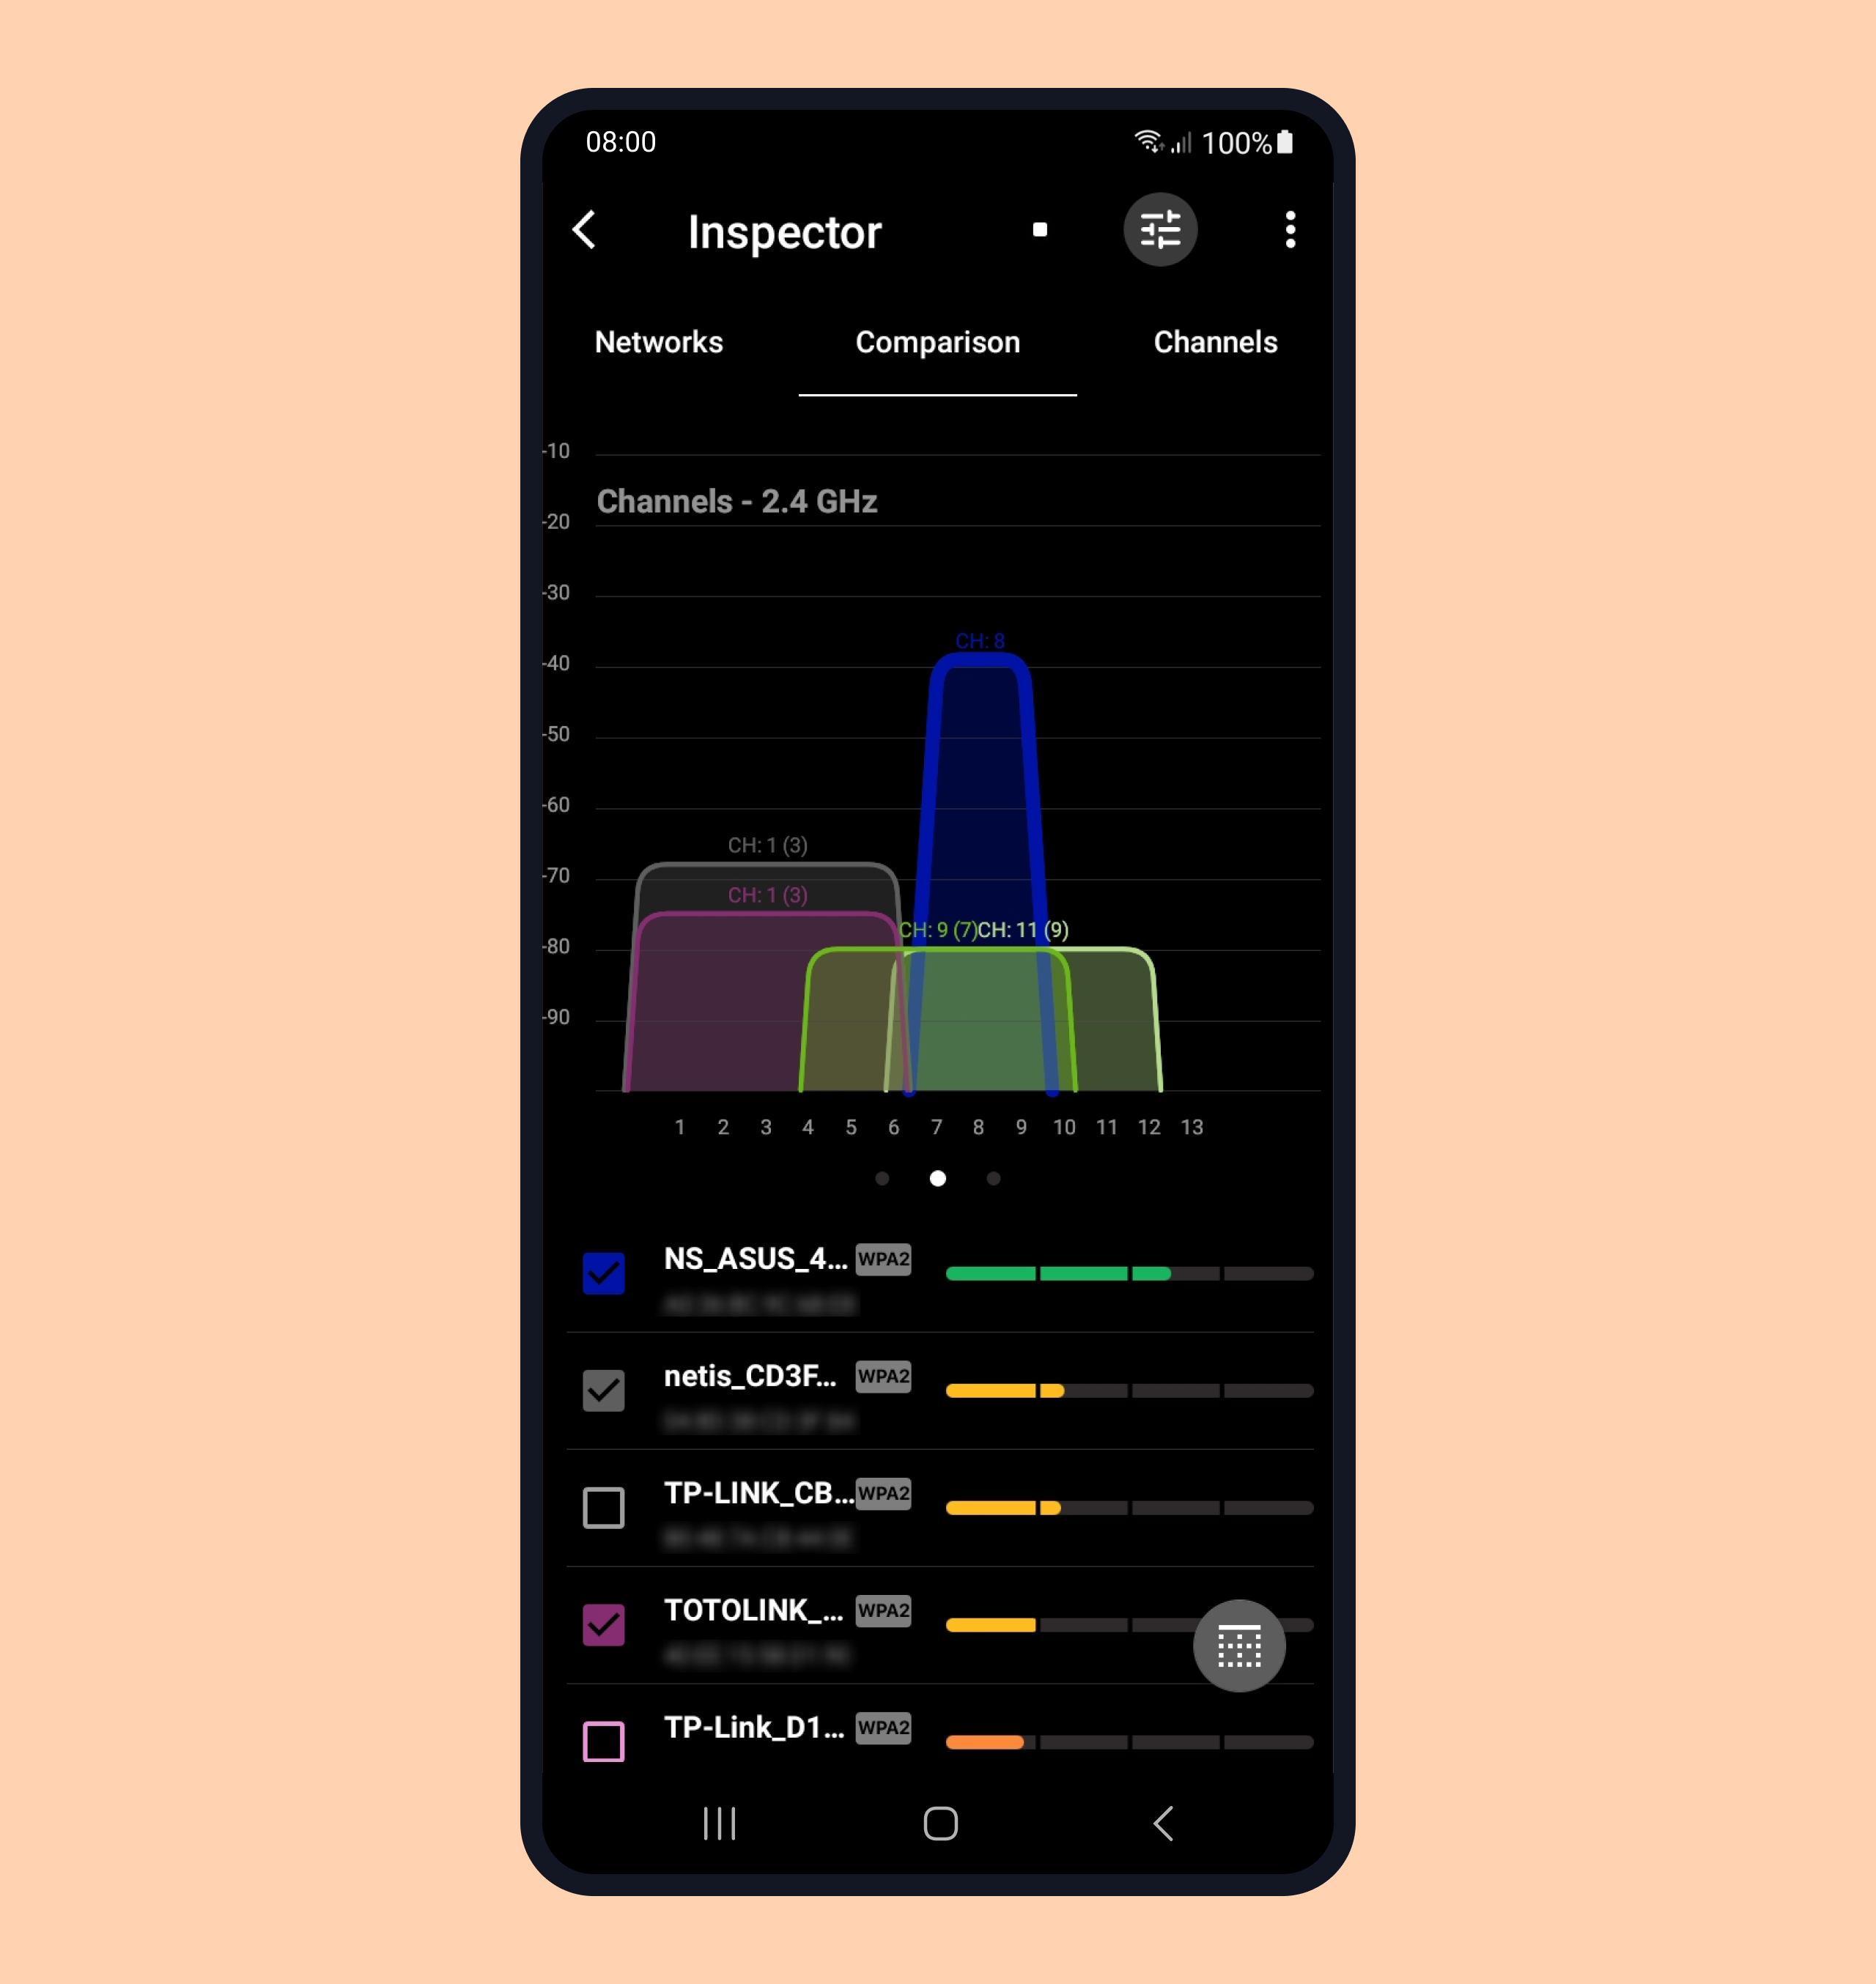
Note that on the Channel overlap graph with all 2.4 GHz, 5GHz and 6GHz frequencies the corresponding WiFi networks will be shown that operate on these frequency bands. If you have selected several networks that operate on different bands, they will be shown in different graphs.
The difference between 2.4 GHz, 5 GHz and 6 GHz graphs
The difference would be in the frequency bands used by a WiFi network. WiFi networks on different bands don’t overlap.
The 5 GHz and 6 GHz frequency bands offer more channels than the 2.4 GHz one.
Swipe left to see the next graph, and swipe right to go back to previous.
Filters
Wi-Fi Inspector mode offers various filters for WiFi networks.
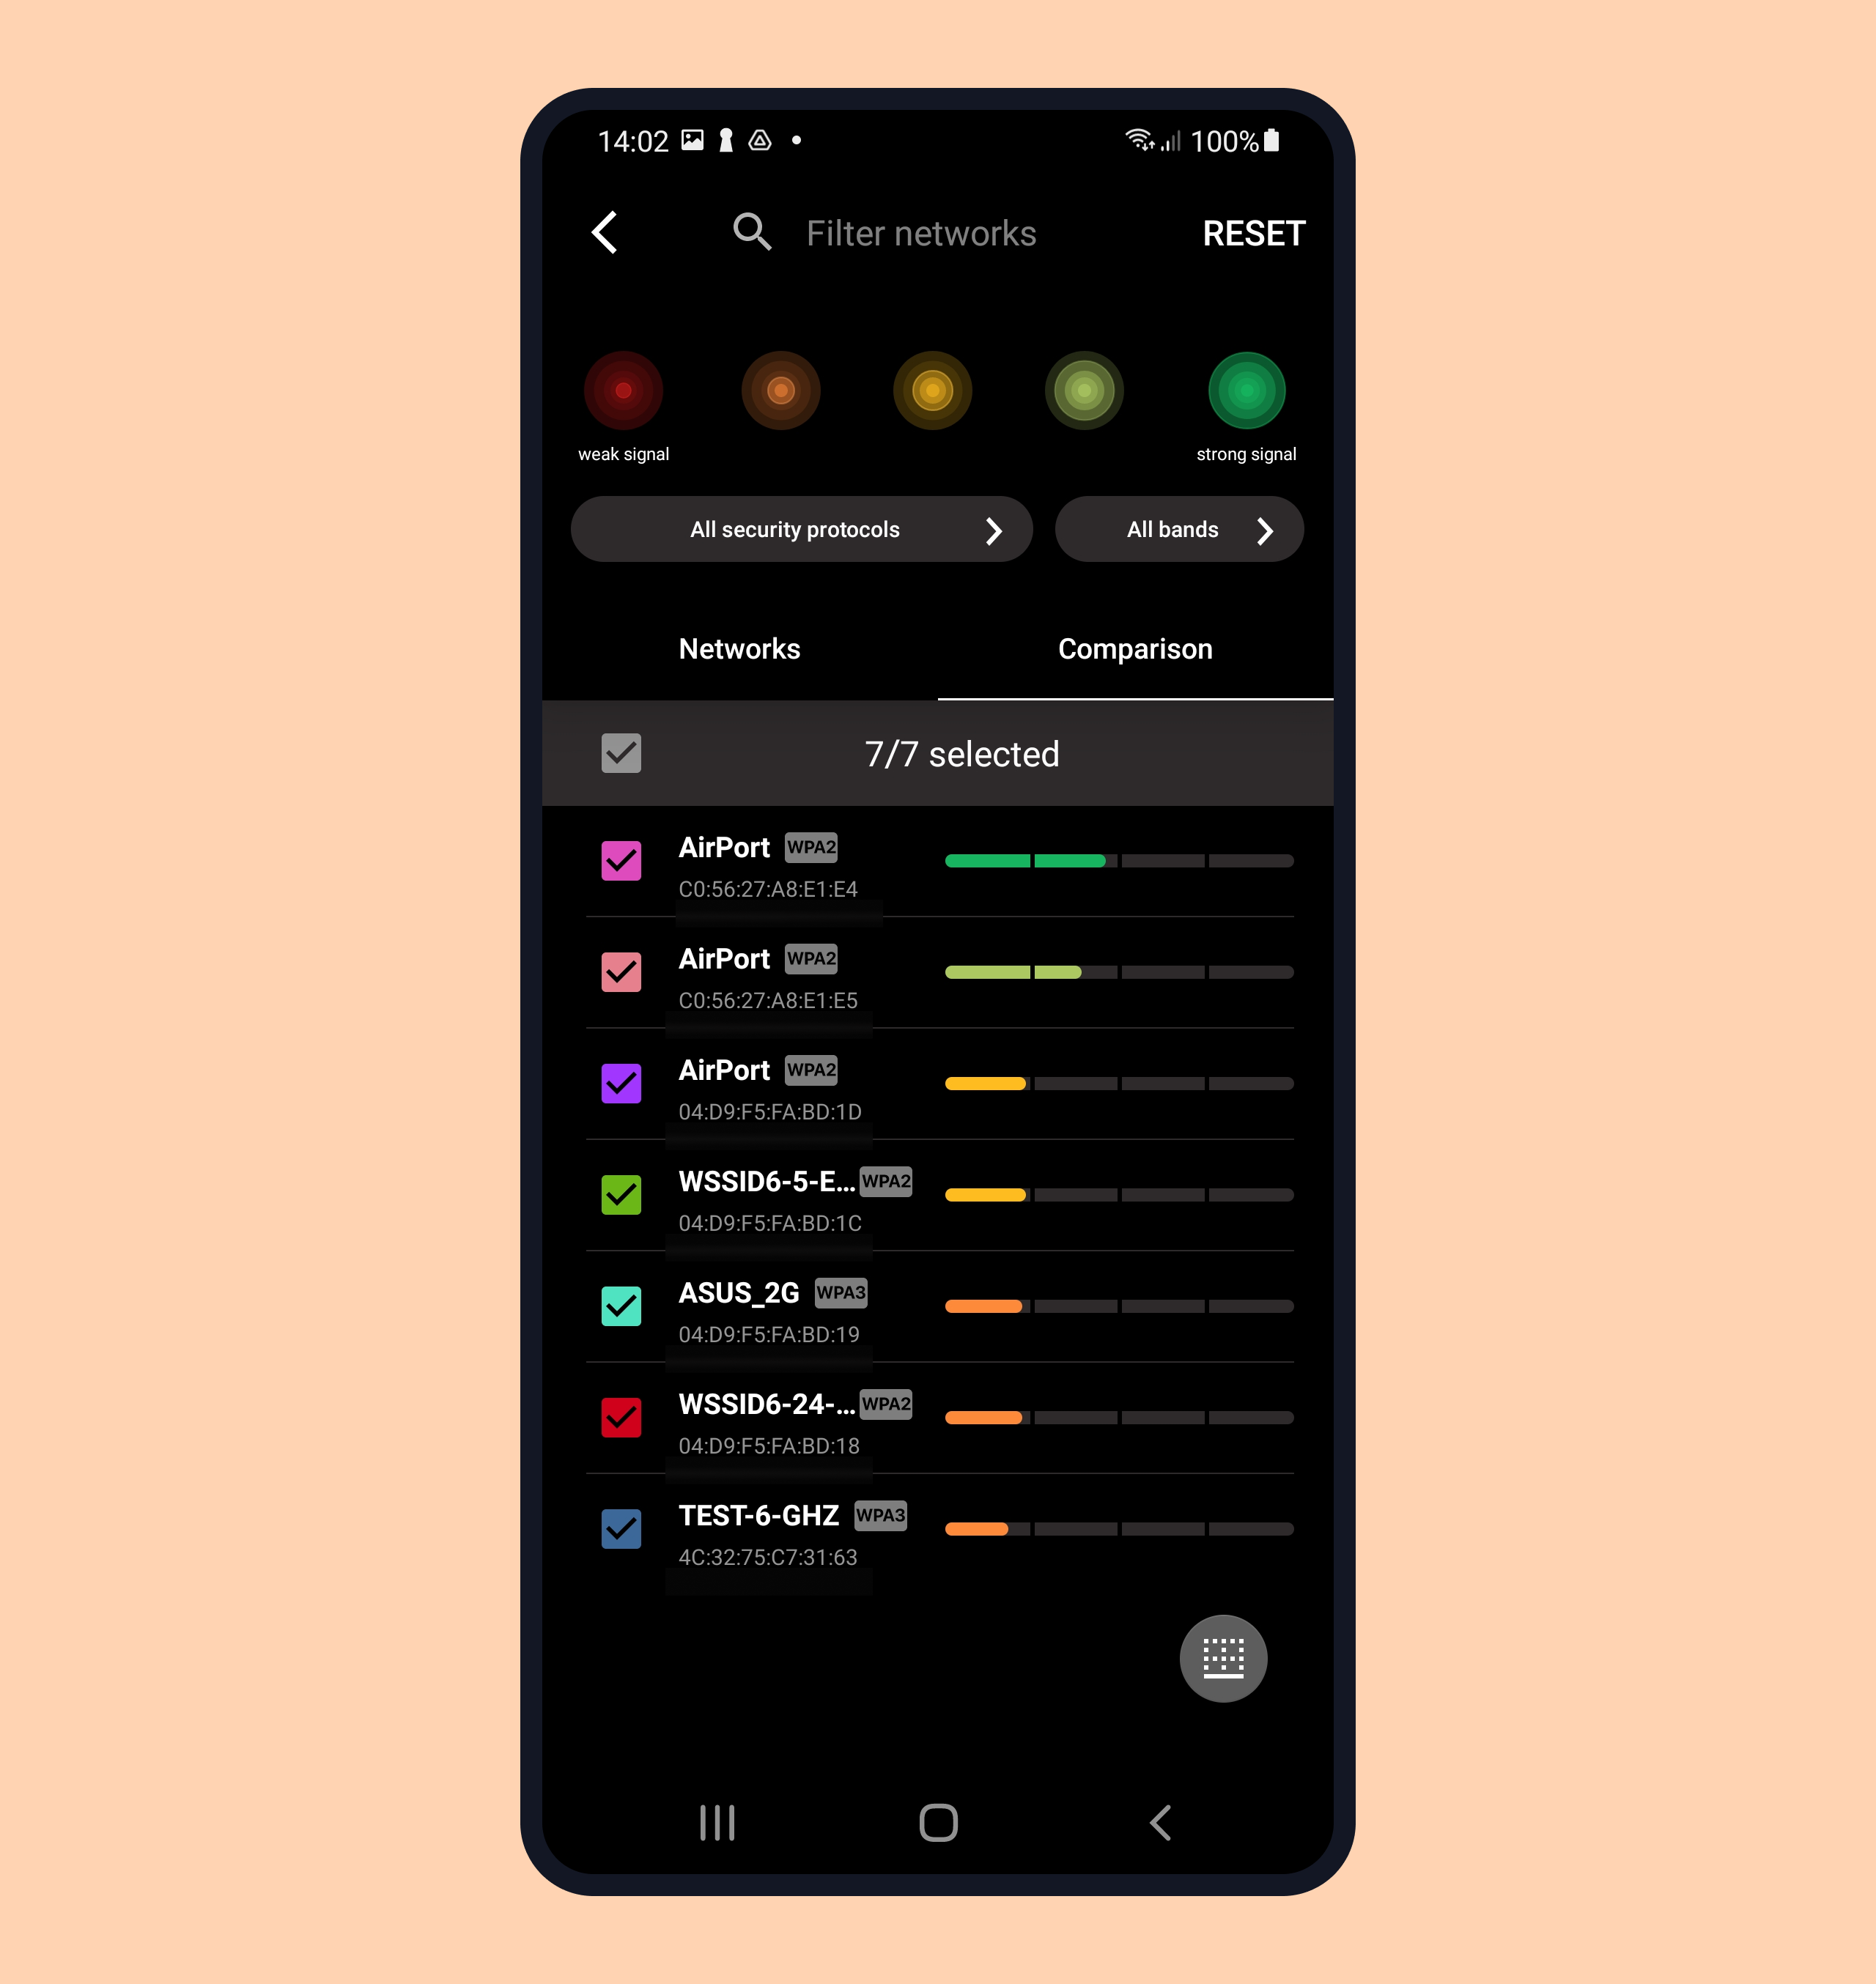
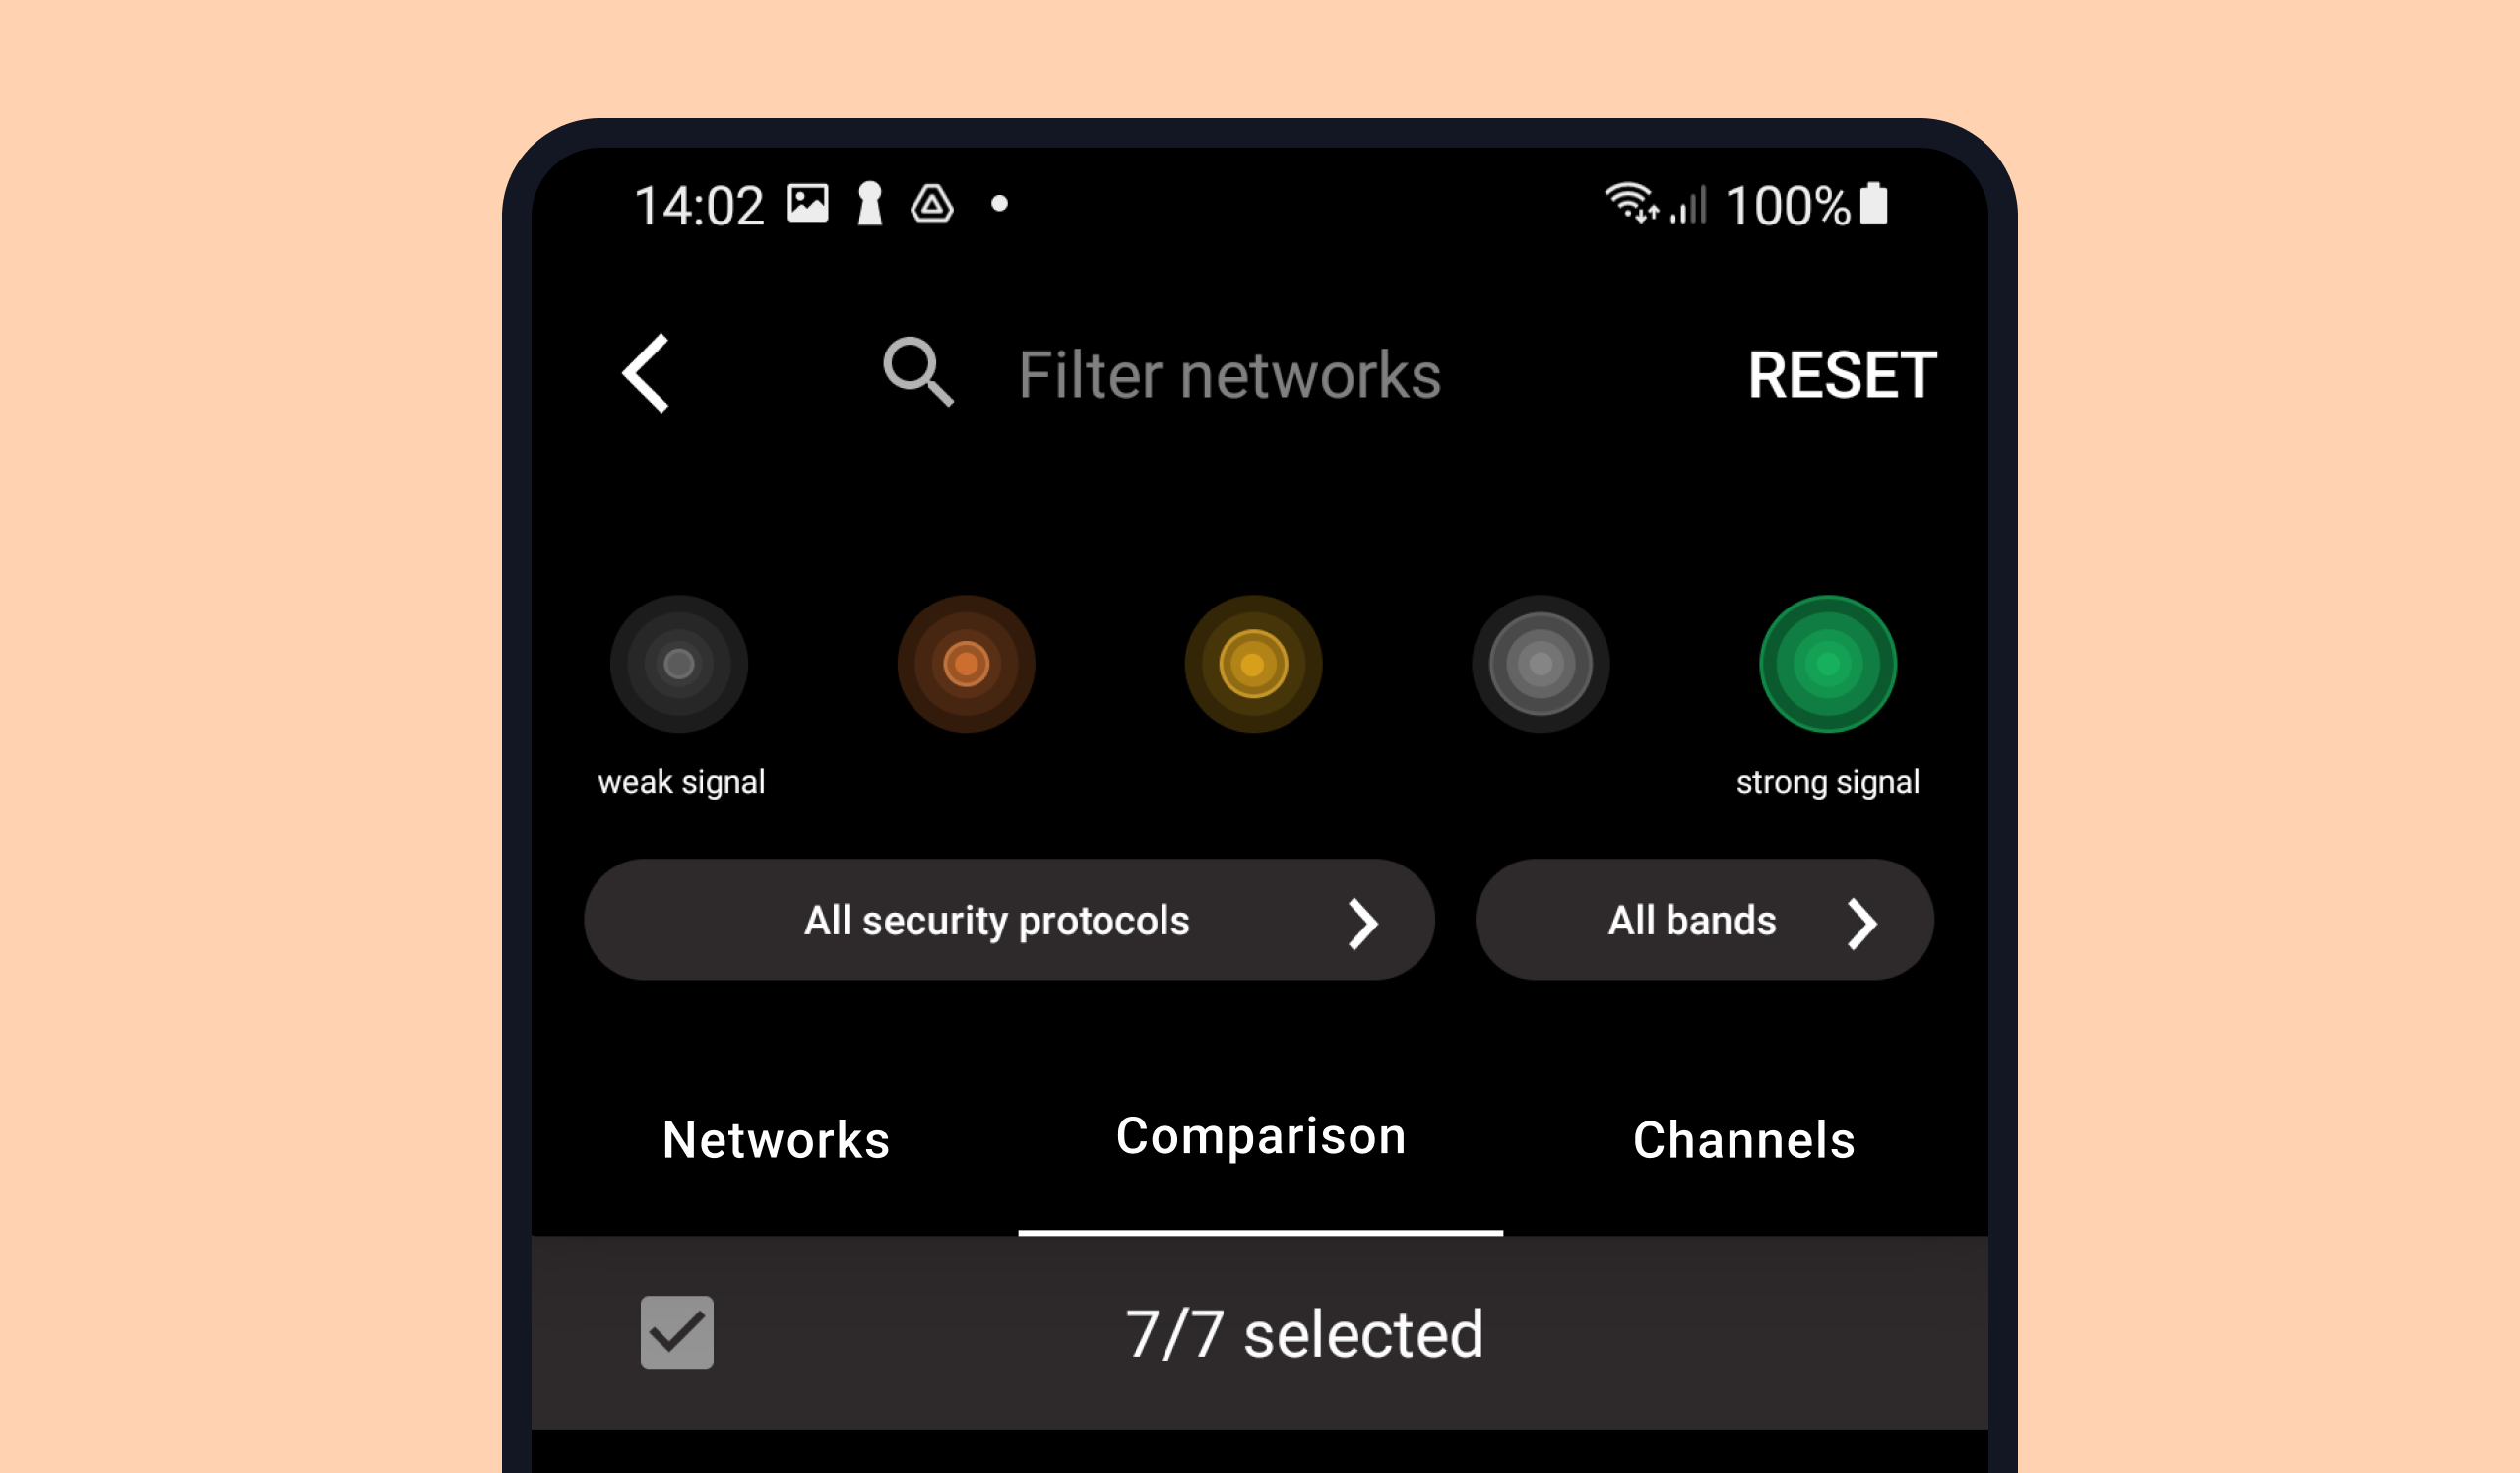
Filter by signal strength
To filter the detected networks by their signal strength, tap the circle icon at the top-right area of the app and choose the levels (they are conveniently colored for easier selection) you would like to see on the list. You can choose several signal strength levels at a time.
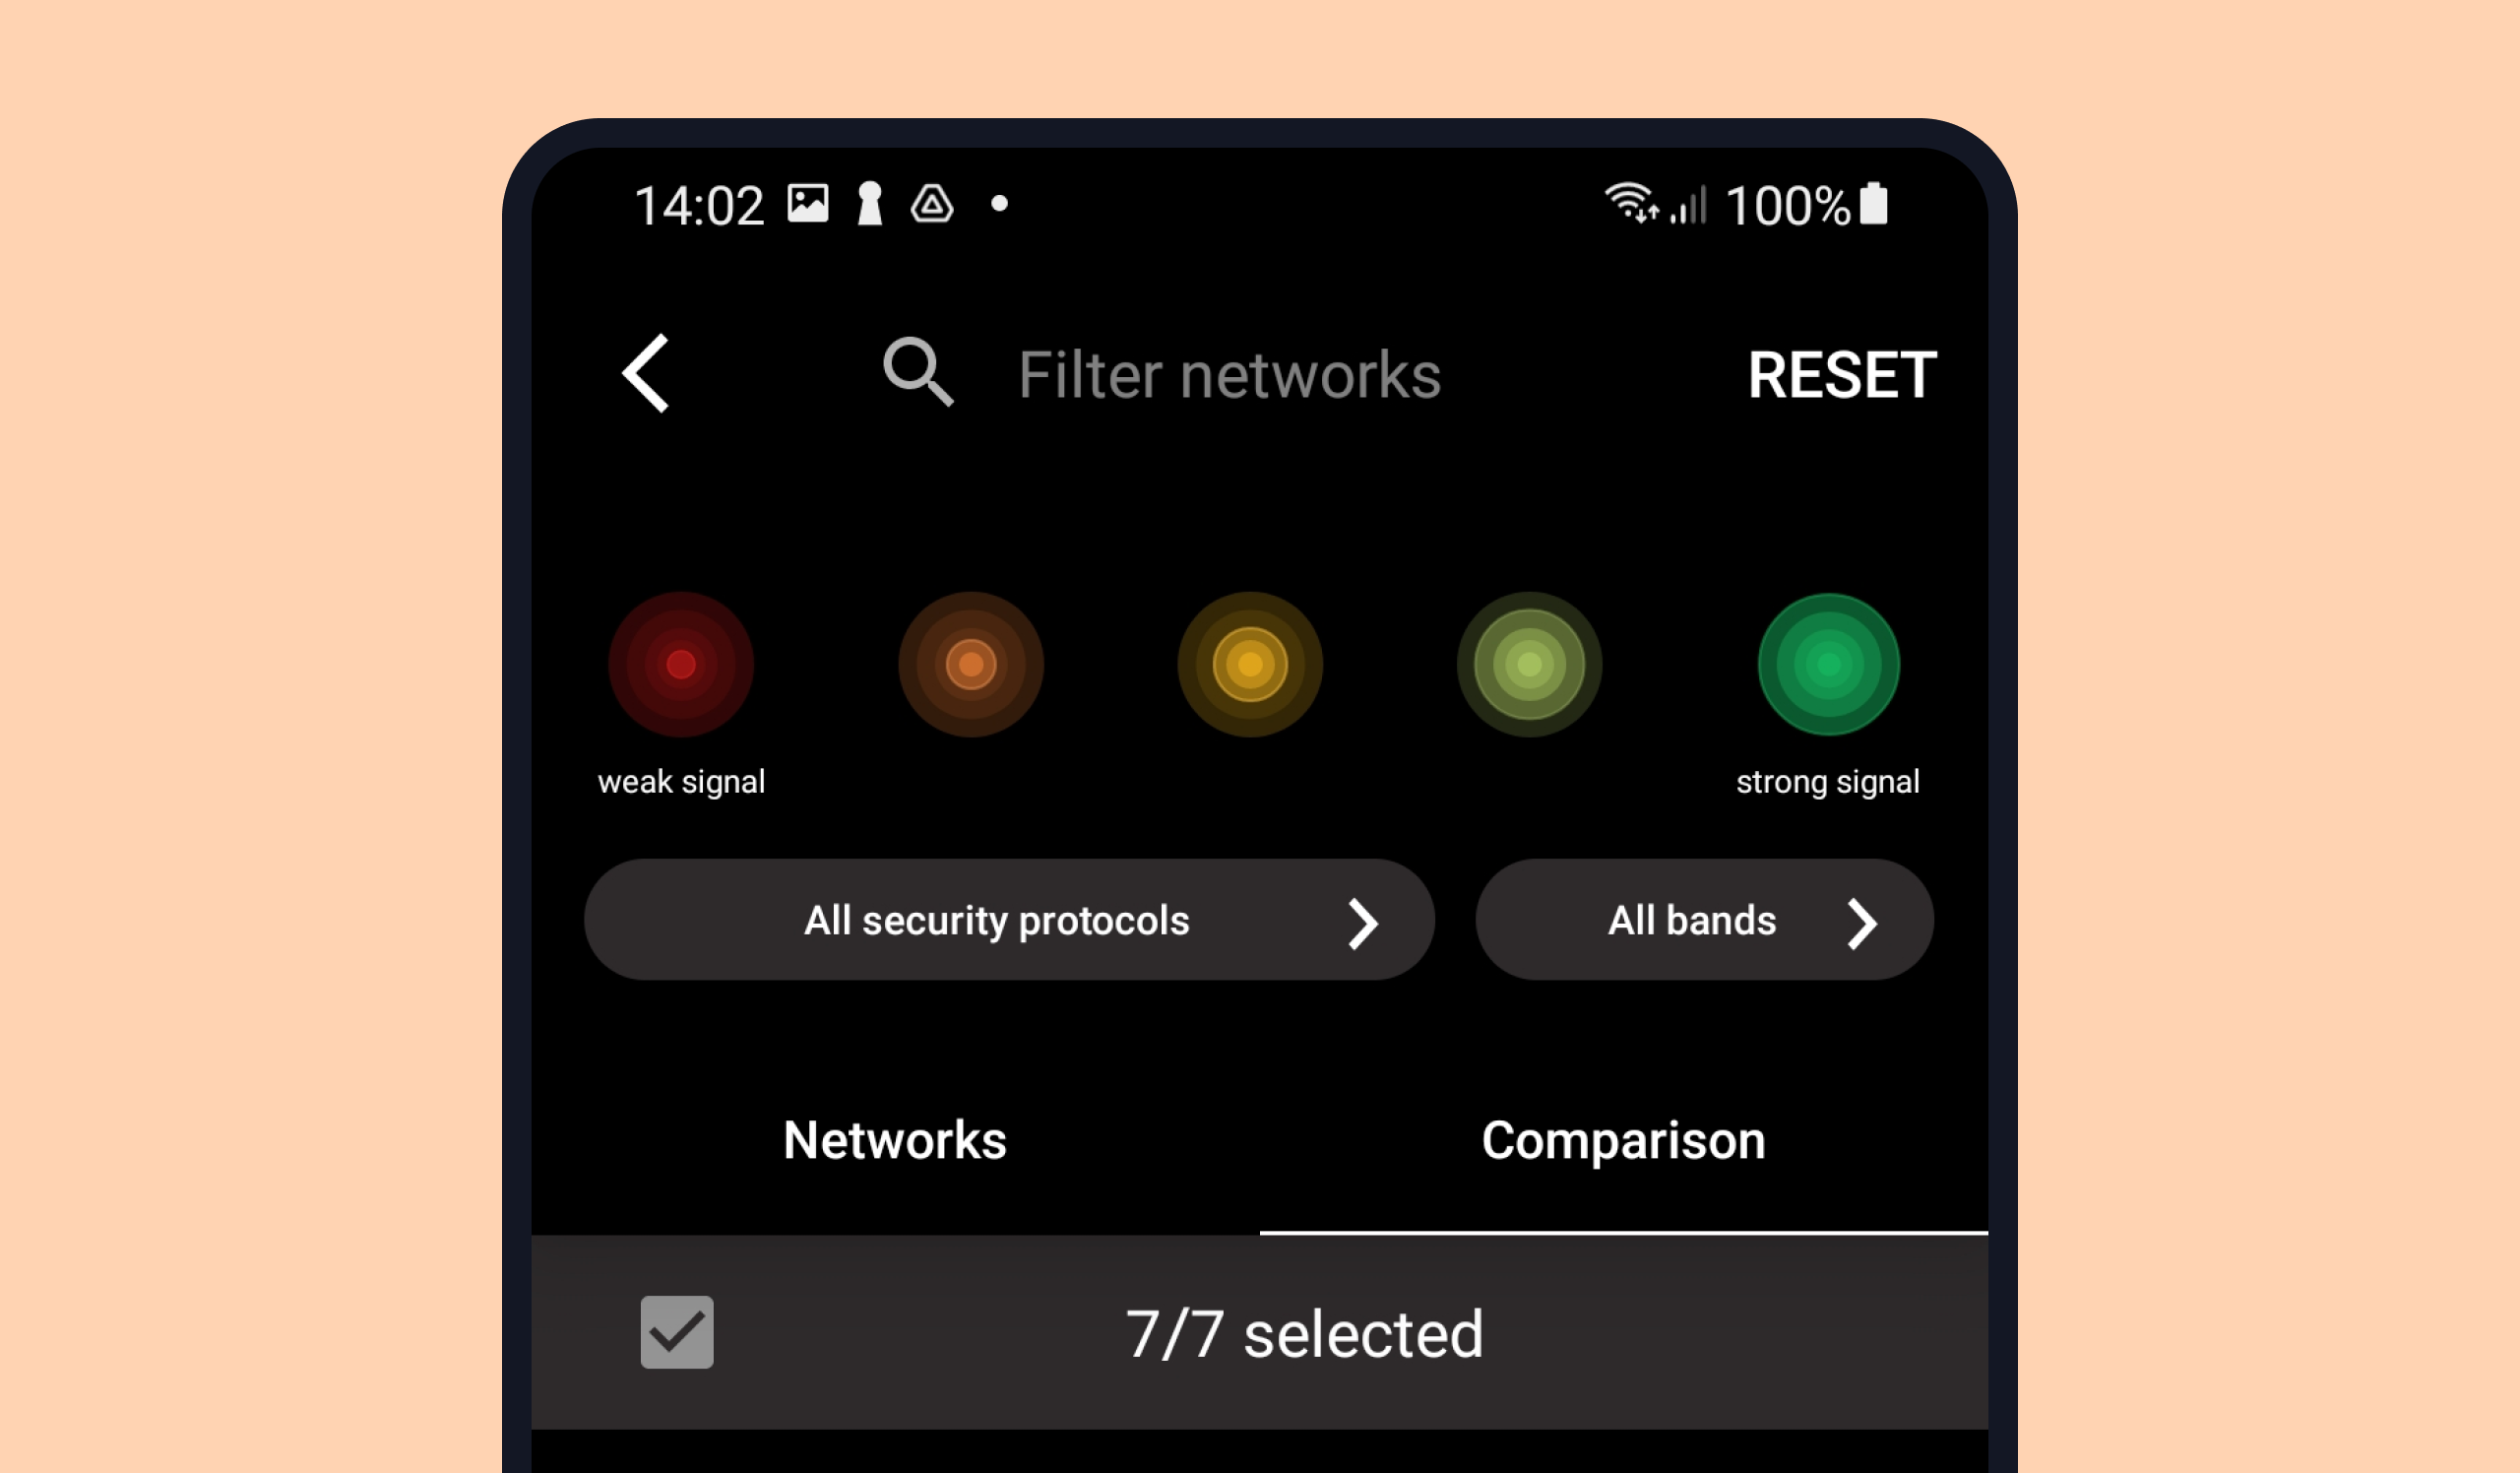
By default, the networks of all signal levels are listed. If you disable one of the signal level filters, it will turn gray. Tap it again to see the networks of this signal strength again.
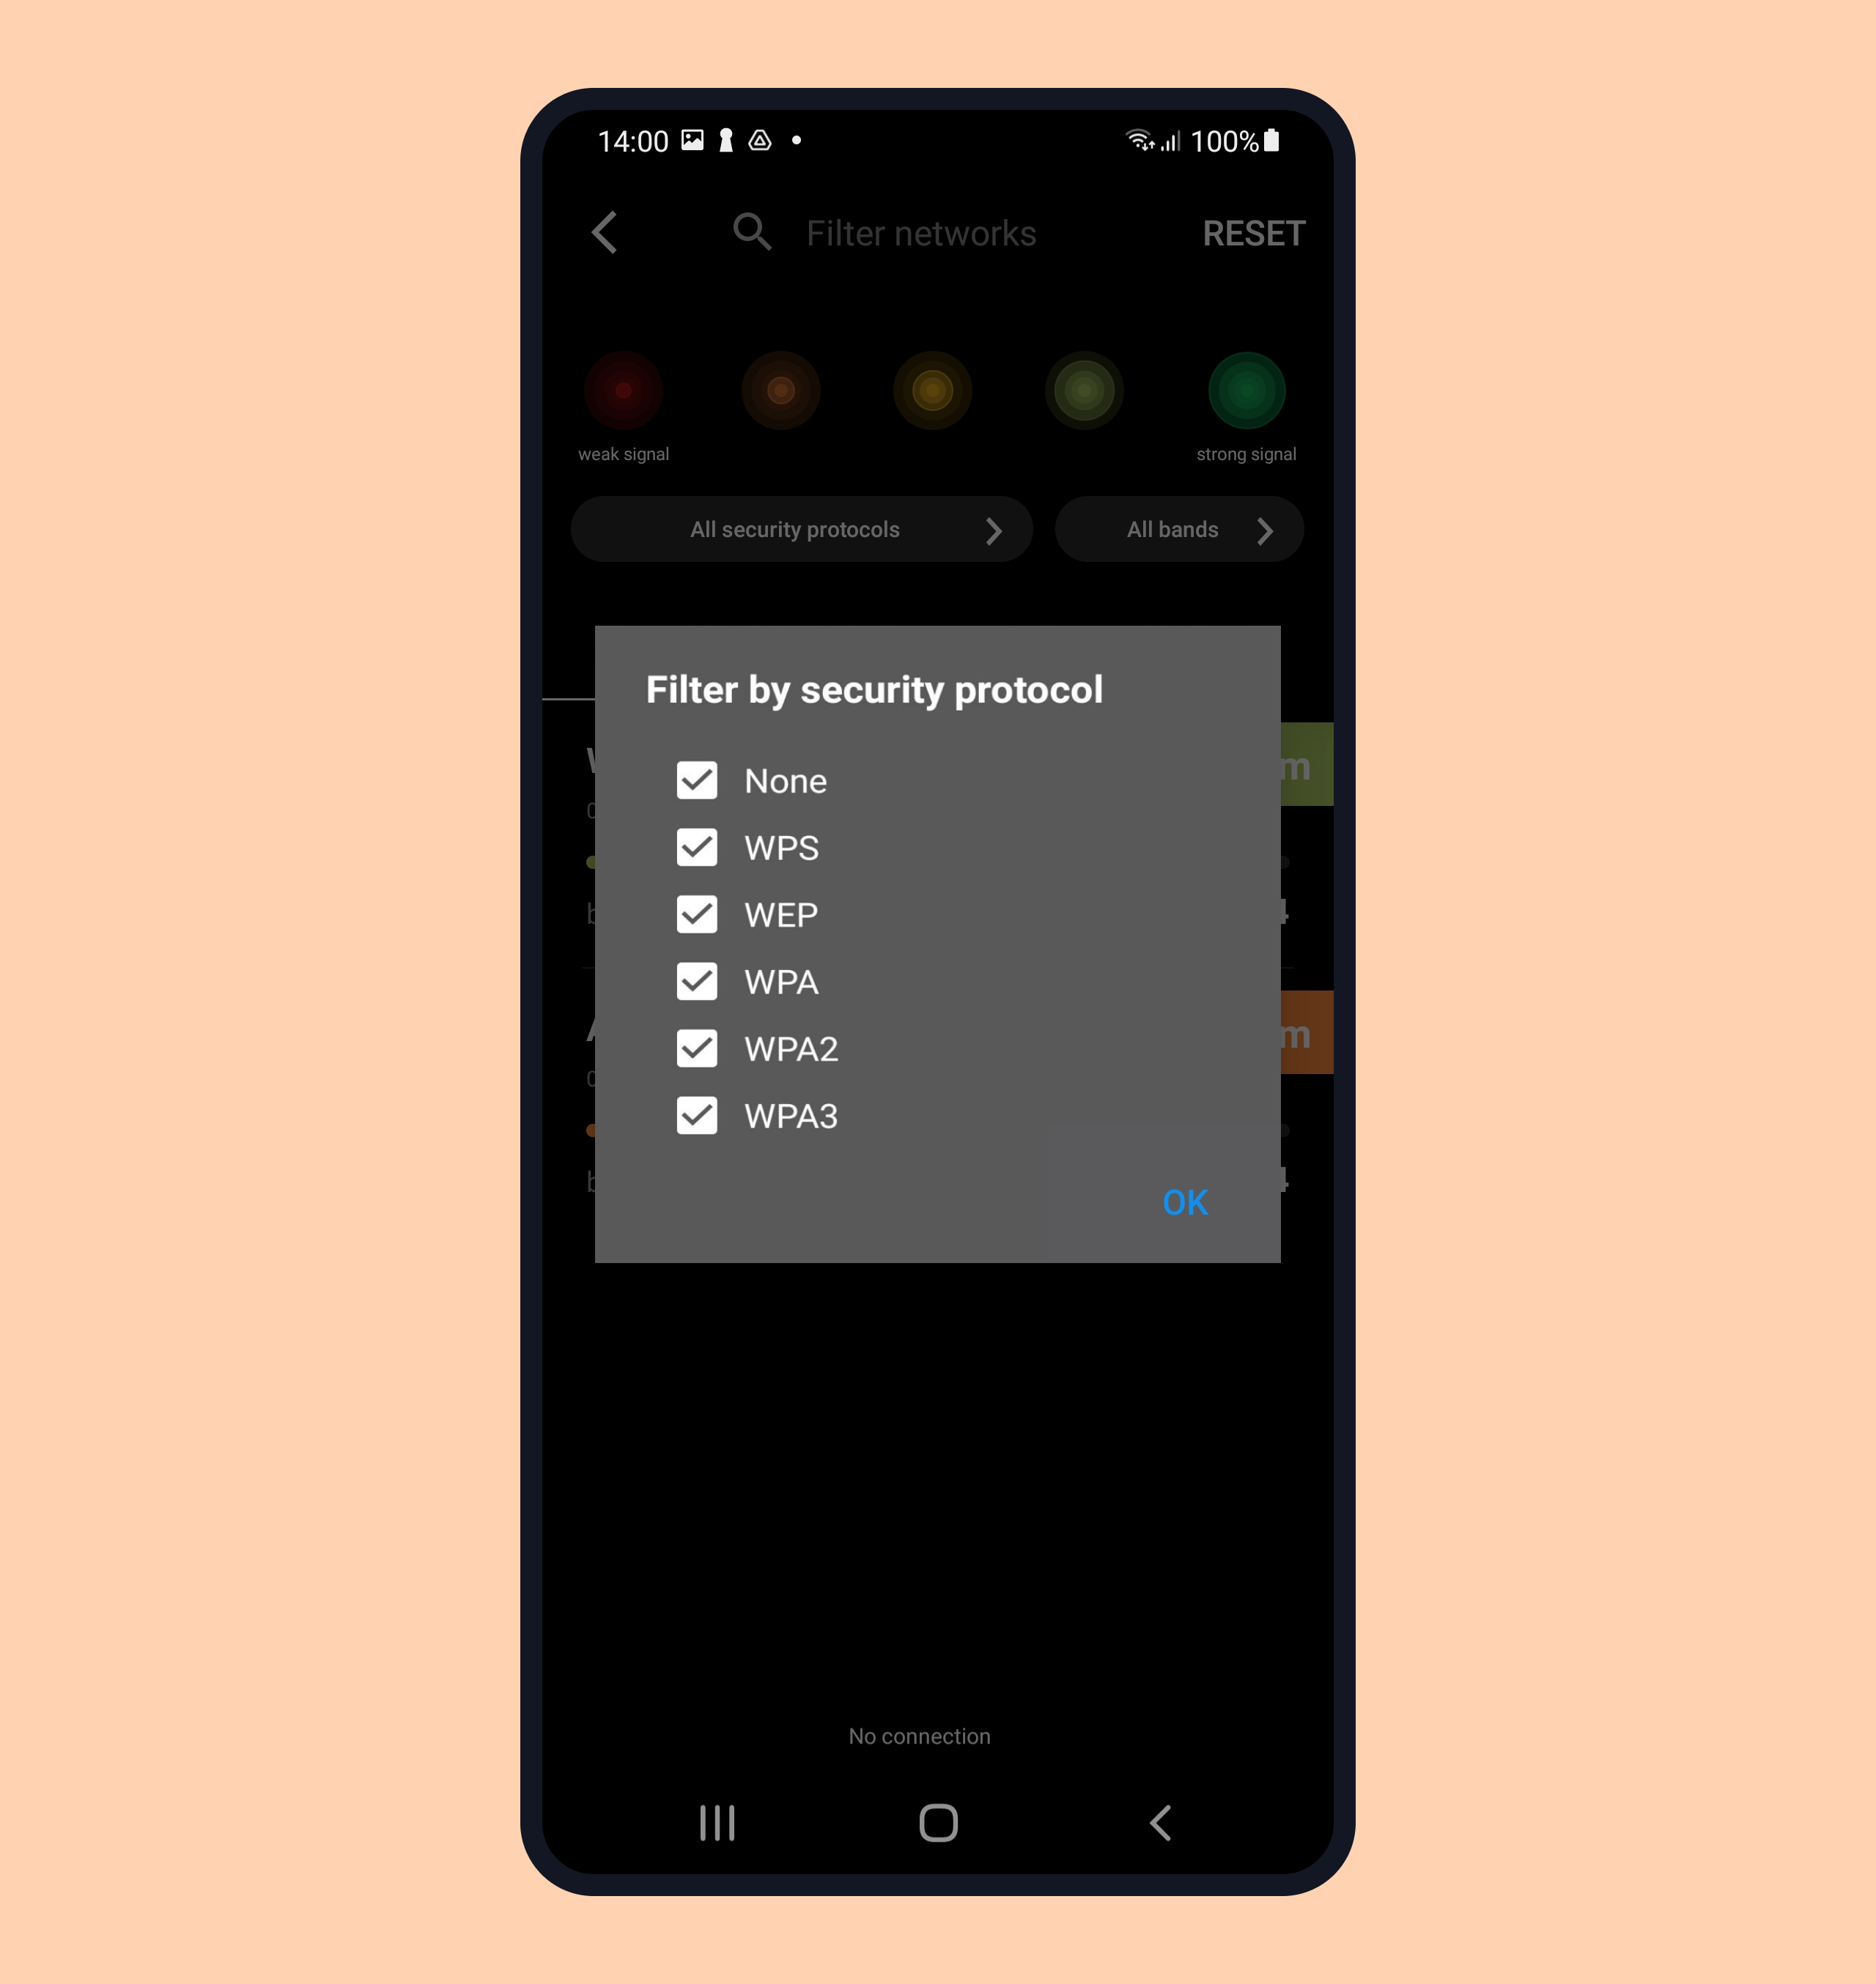
Filter by security protocol
To filter WiFi networks by their security protocols, choose one or several parameters from the list:
- ☑️ None
- ☑️ WPS
- ☑️ WEP
- ☑️ WPA
- ☑️ WPA2
- ☑️ WPA3
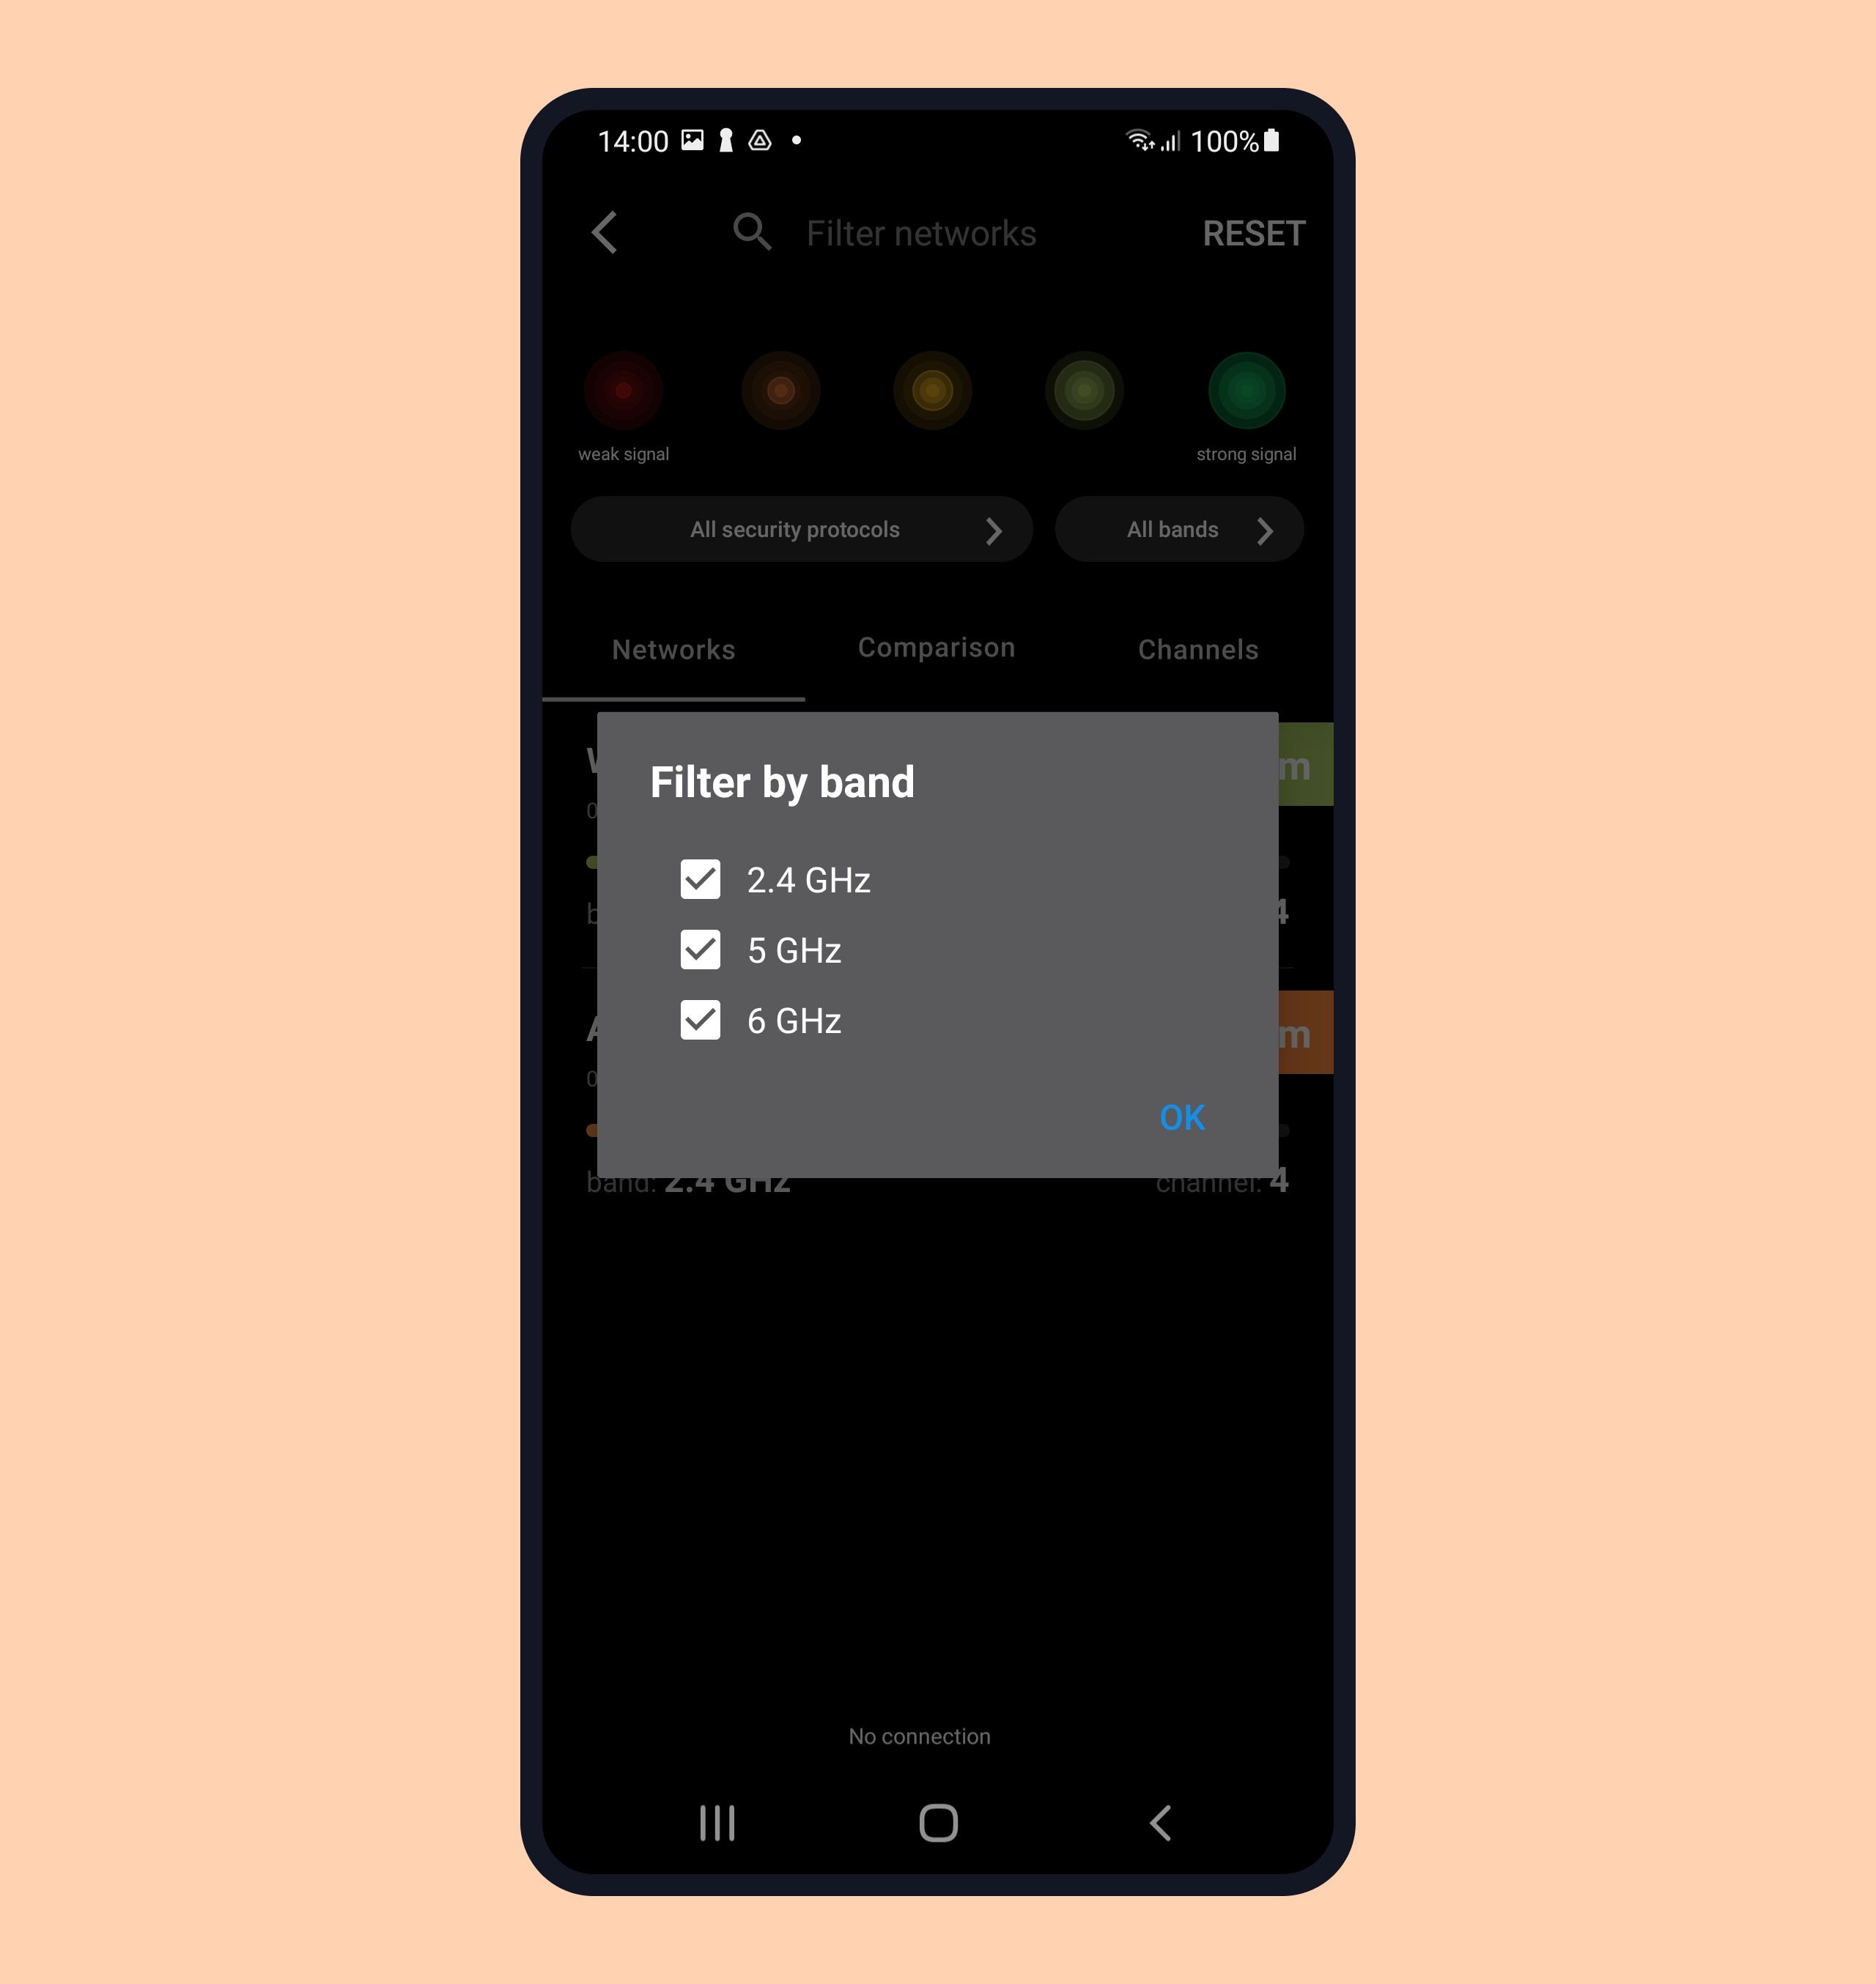
Filter by frequency band
To filter WiFi networks by frequency band, choose one or more bands from the list:
- ☑️ 2.4 GHz
- ☑️ 5 GHz
- ☑️ 6 GHz
Filter by name
In the search box at the top of the app (Filter networks), enter the name or a fragment of a network name to be able to see the networks containing this exact value in their names. Then tap the Search button on your device keyboard to see the filtered results.
Tip 1. You can enter several name fragments at once – separate them with space.
Tip 2. You can combine various filters together.
Comparison graphs can be minimized as well as maximized by tapping or swiping up/down.
Performing a Wireless Network Survey with NetSpot for Android
NetSpot helps you build solid WiFi coverage throughout your designated area with the help of a wireless network survey. It is easy to perform and provides you with great visual tools needed to tune your wireless setup to perfection.
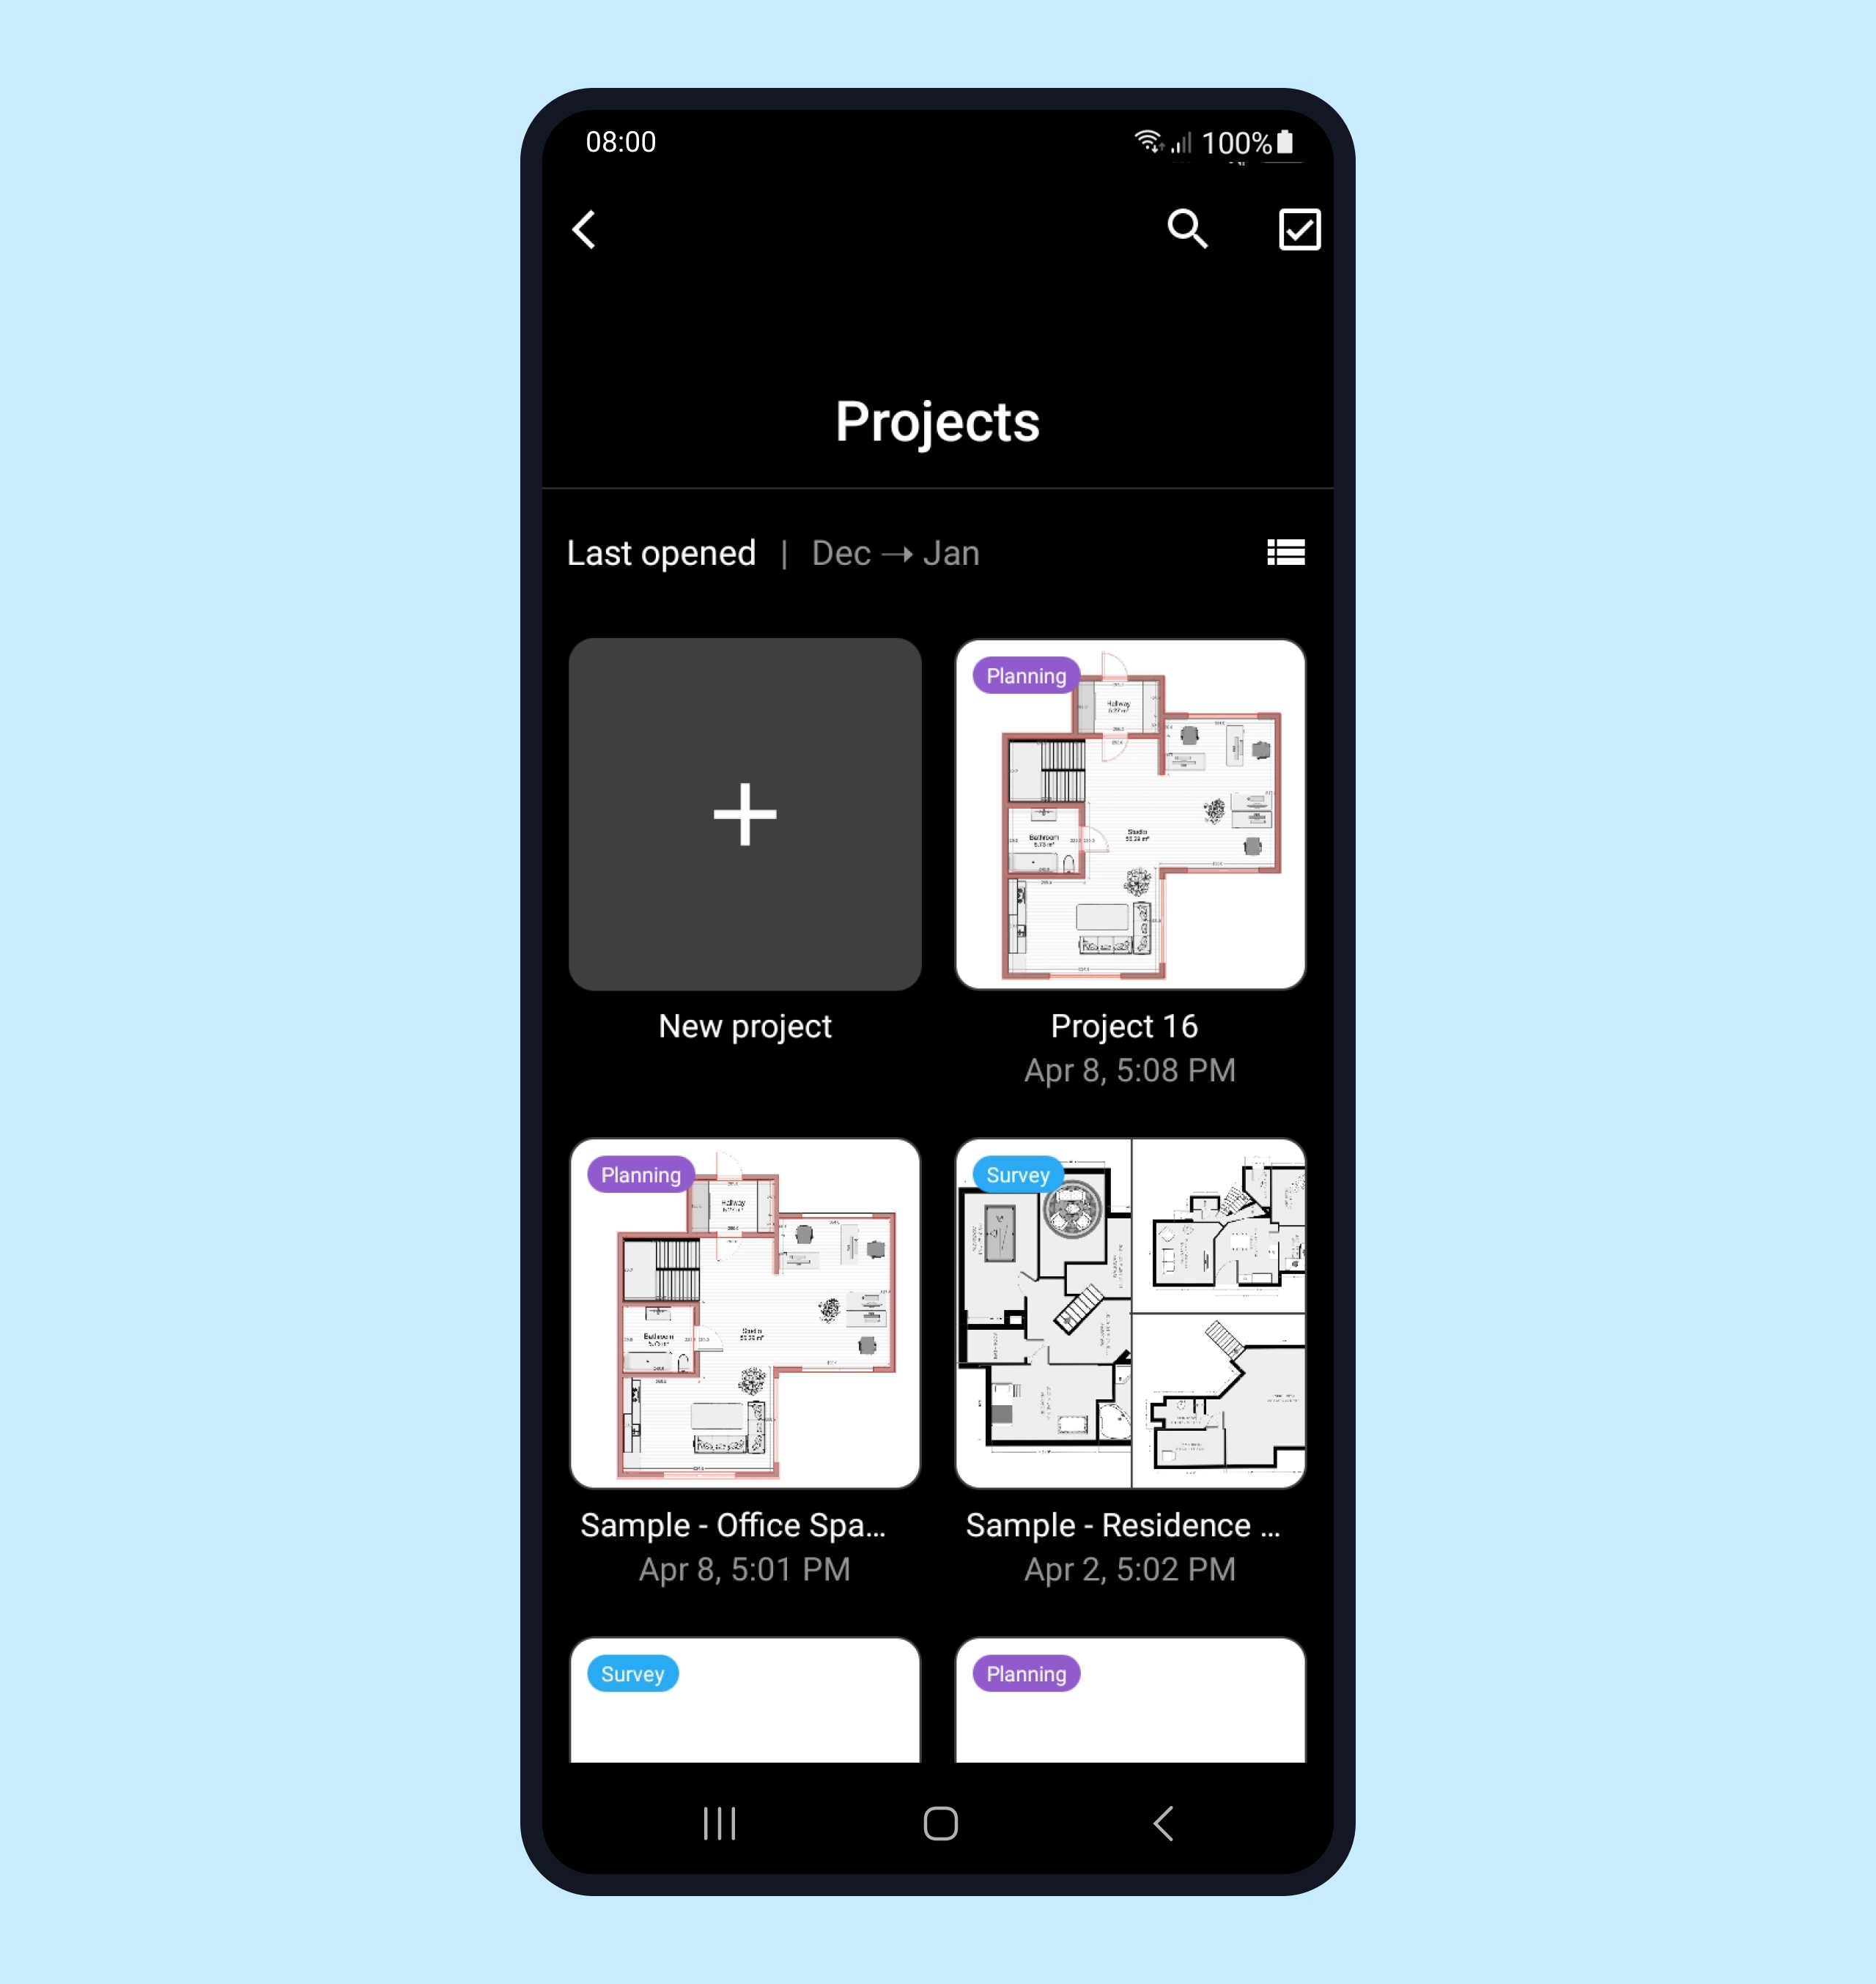
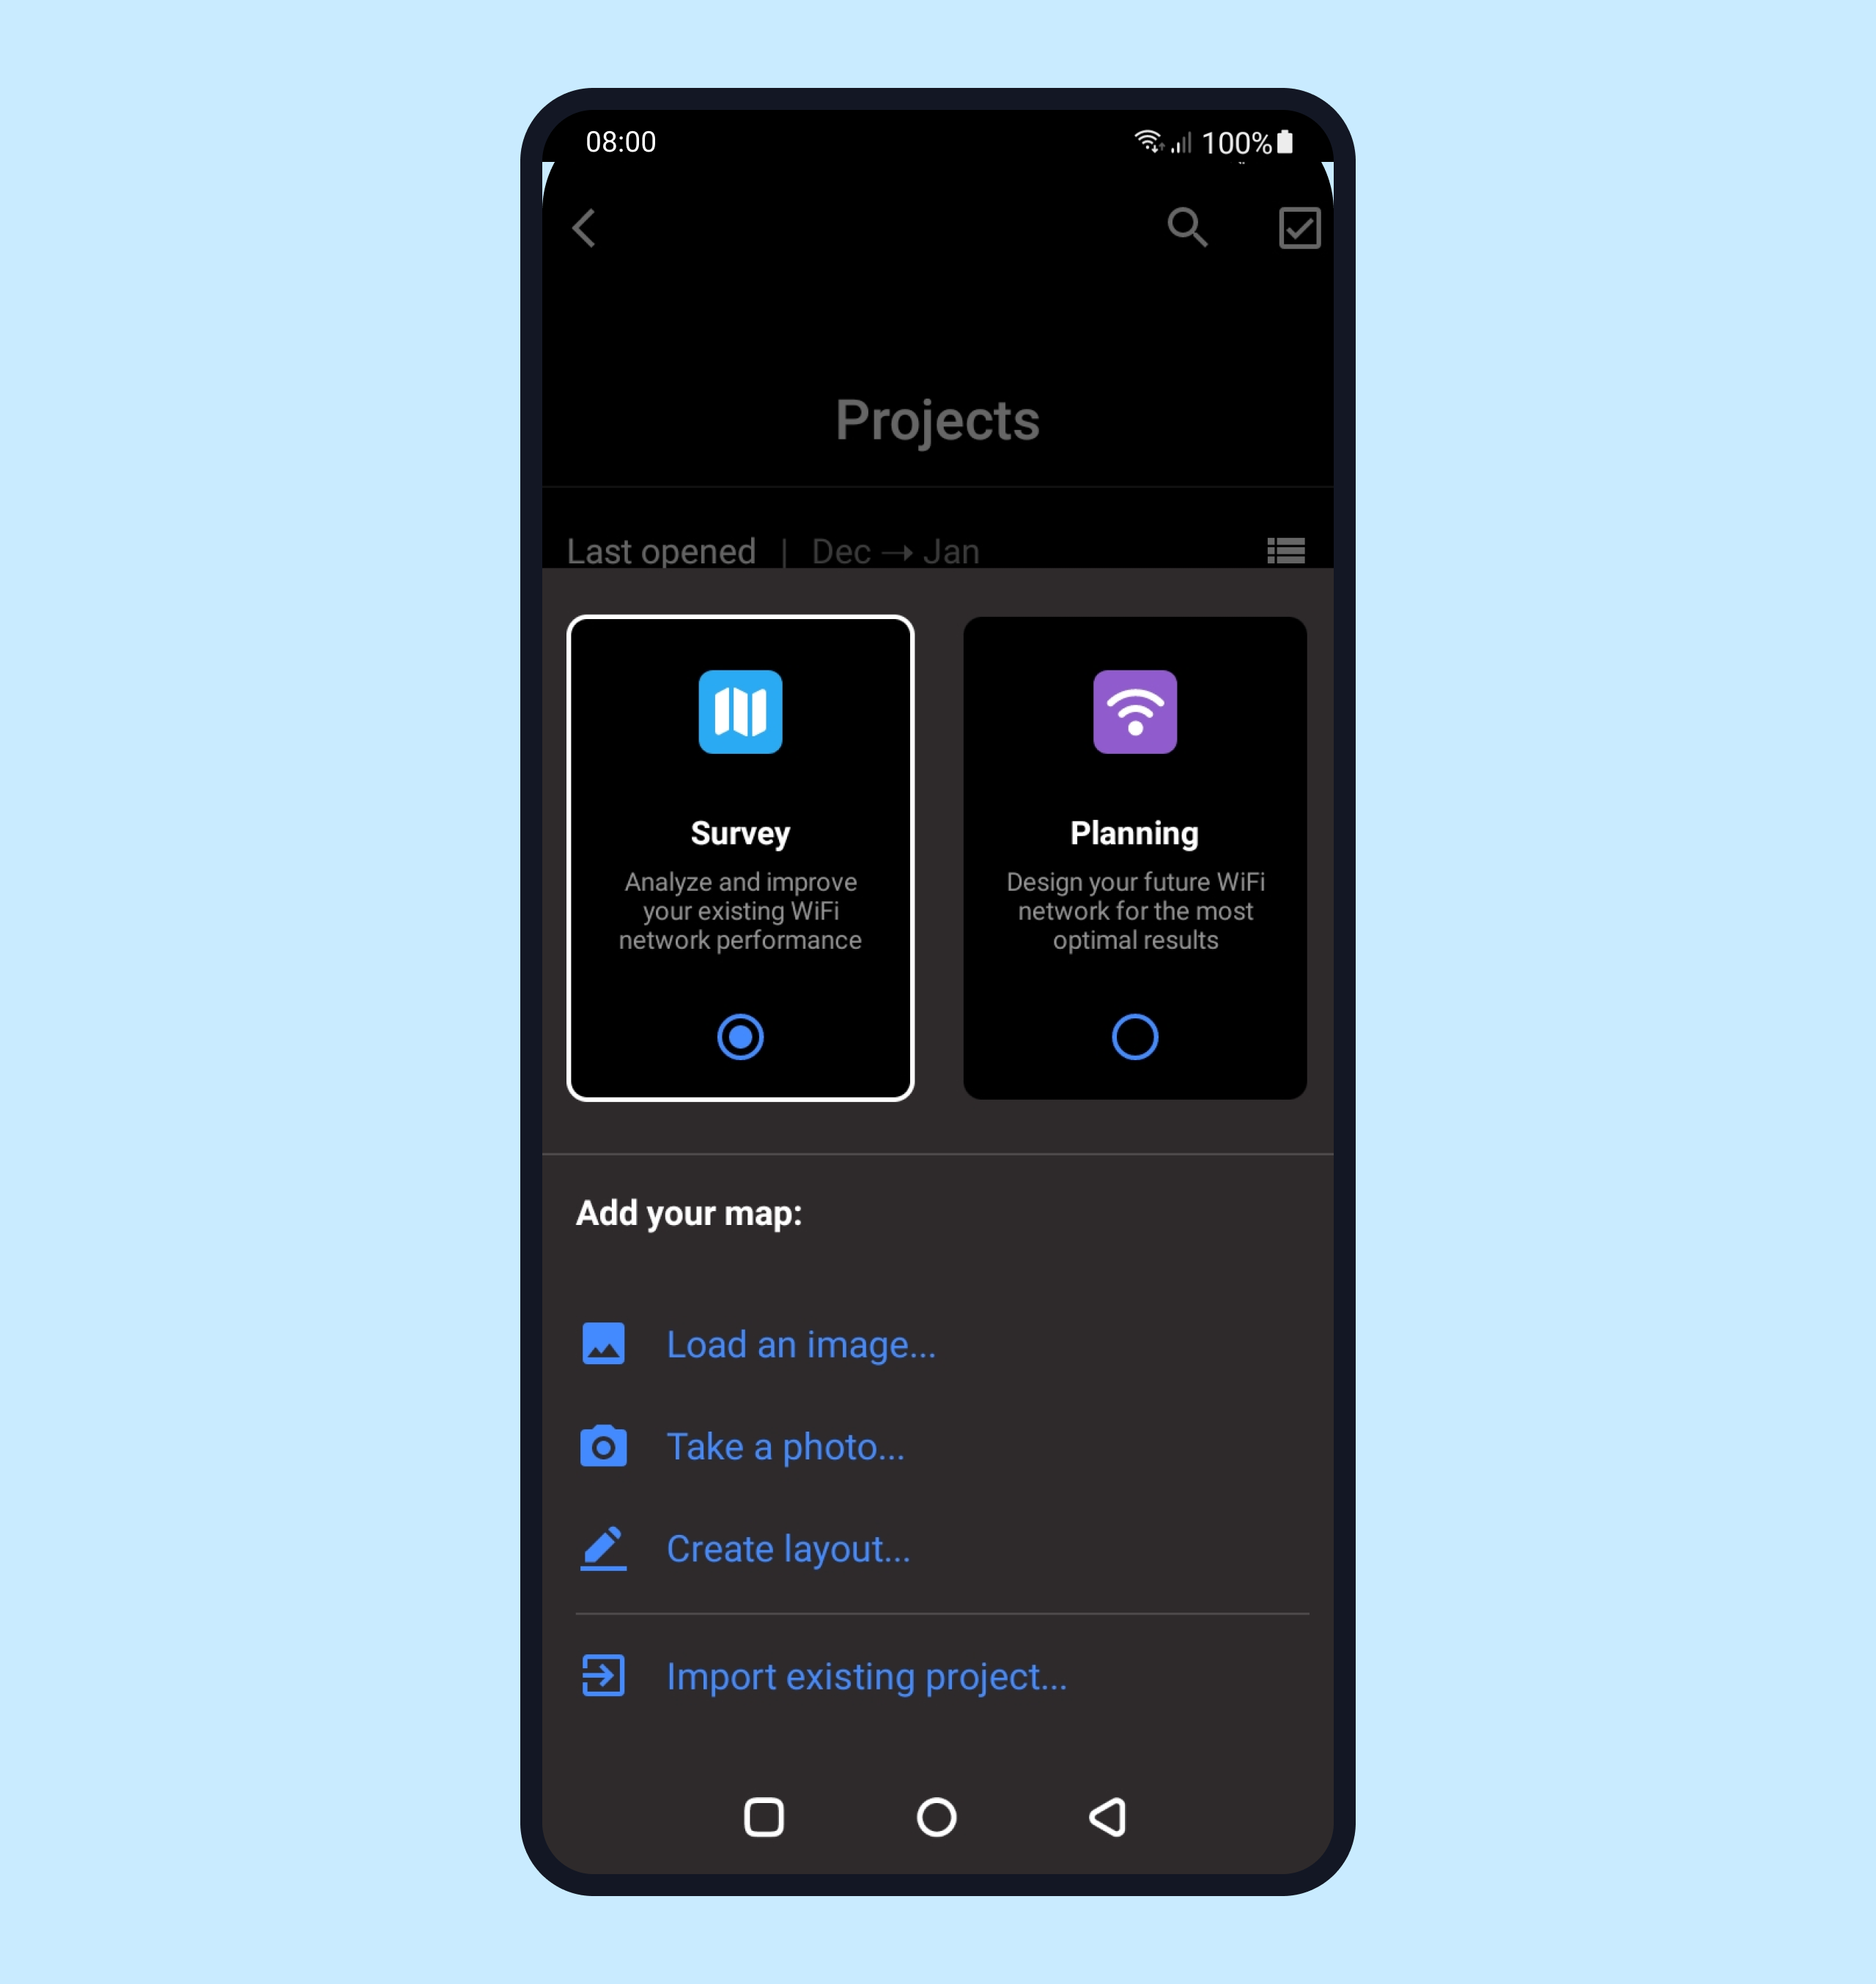
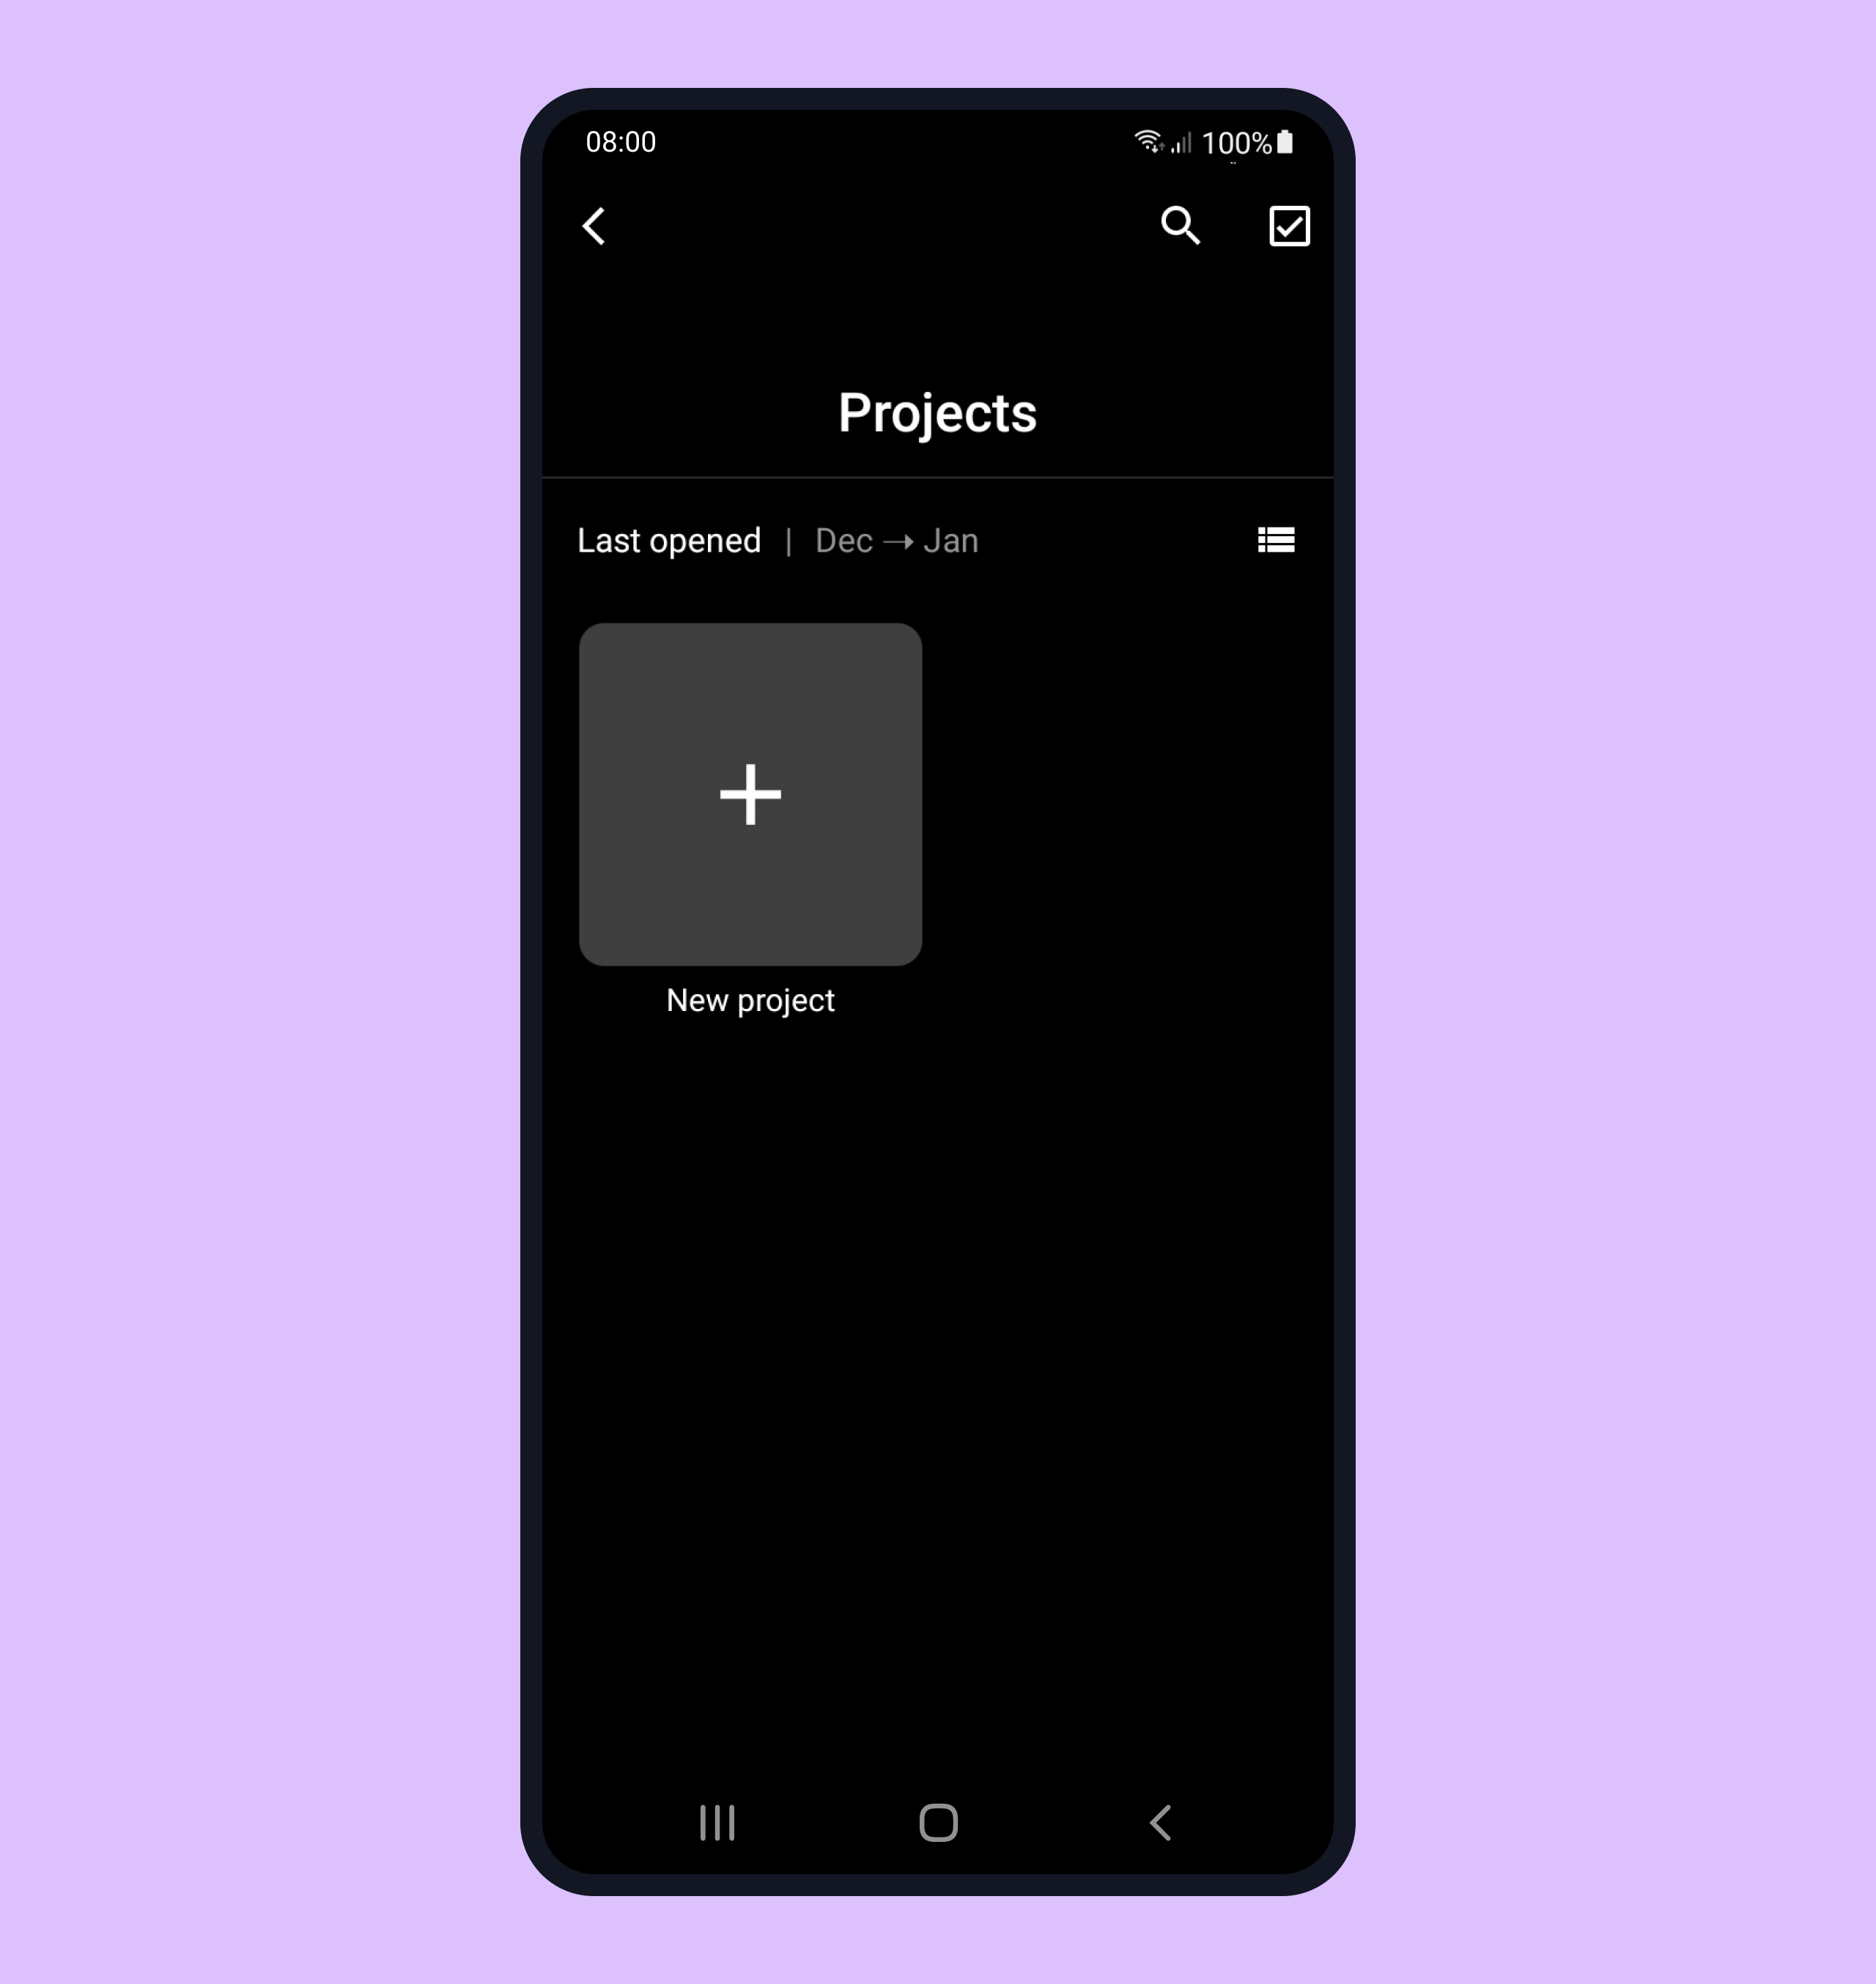
Step 1. Create a new project by tapping the + button.
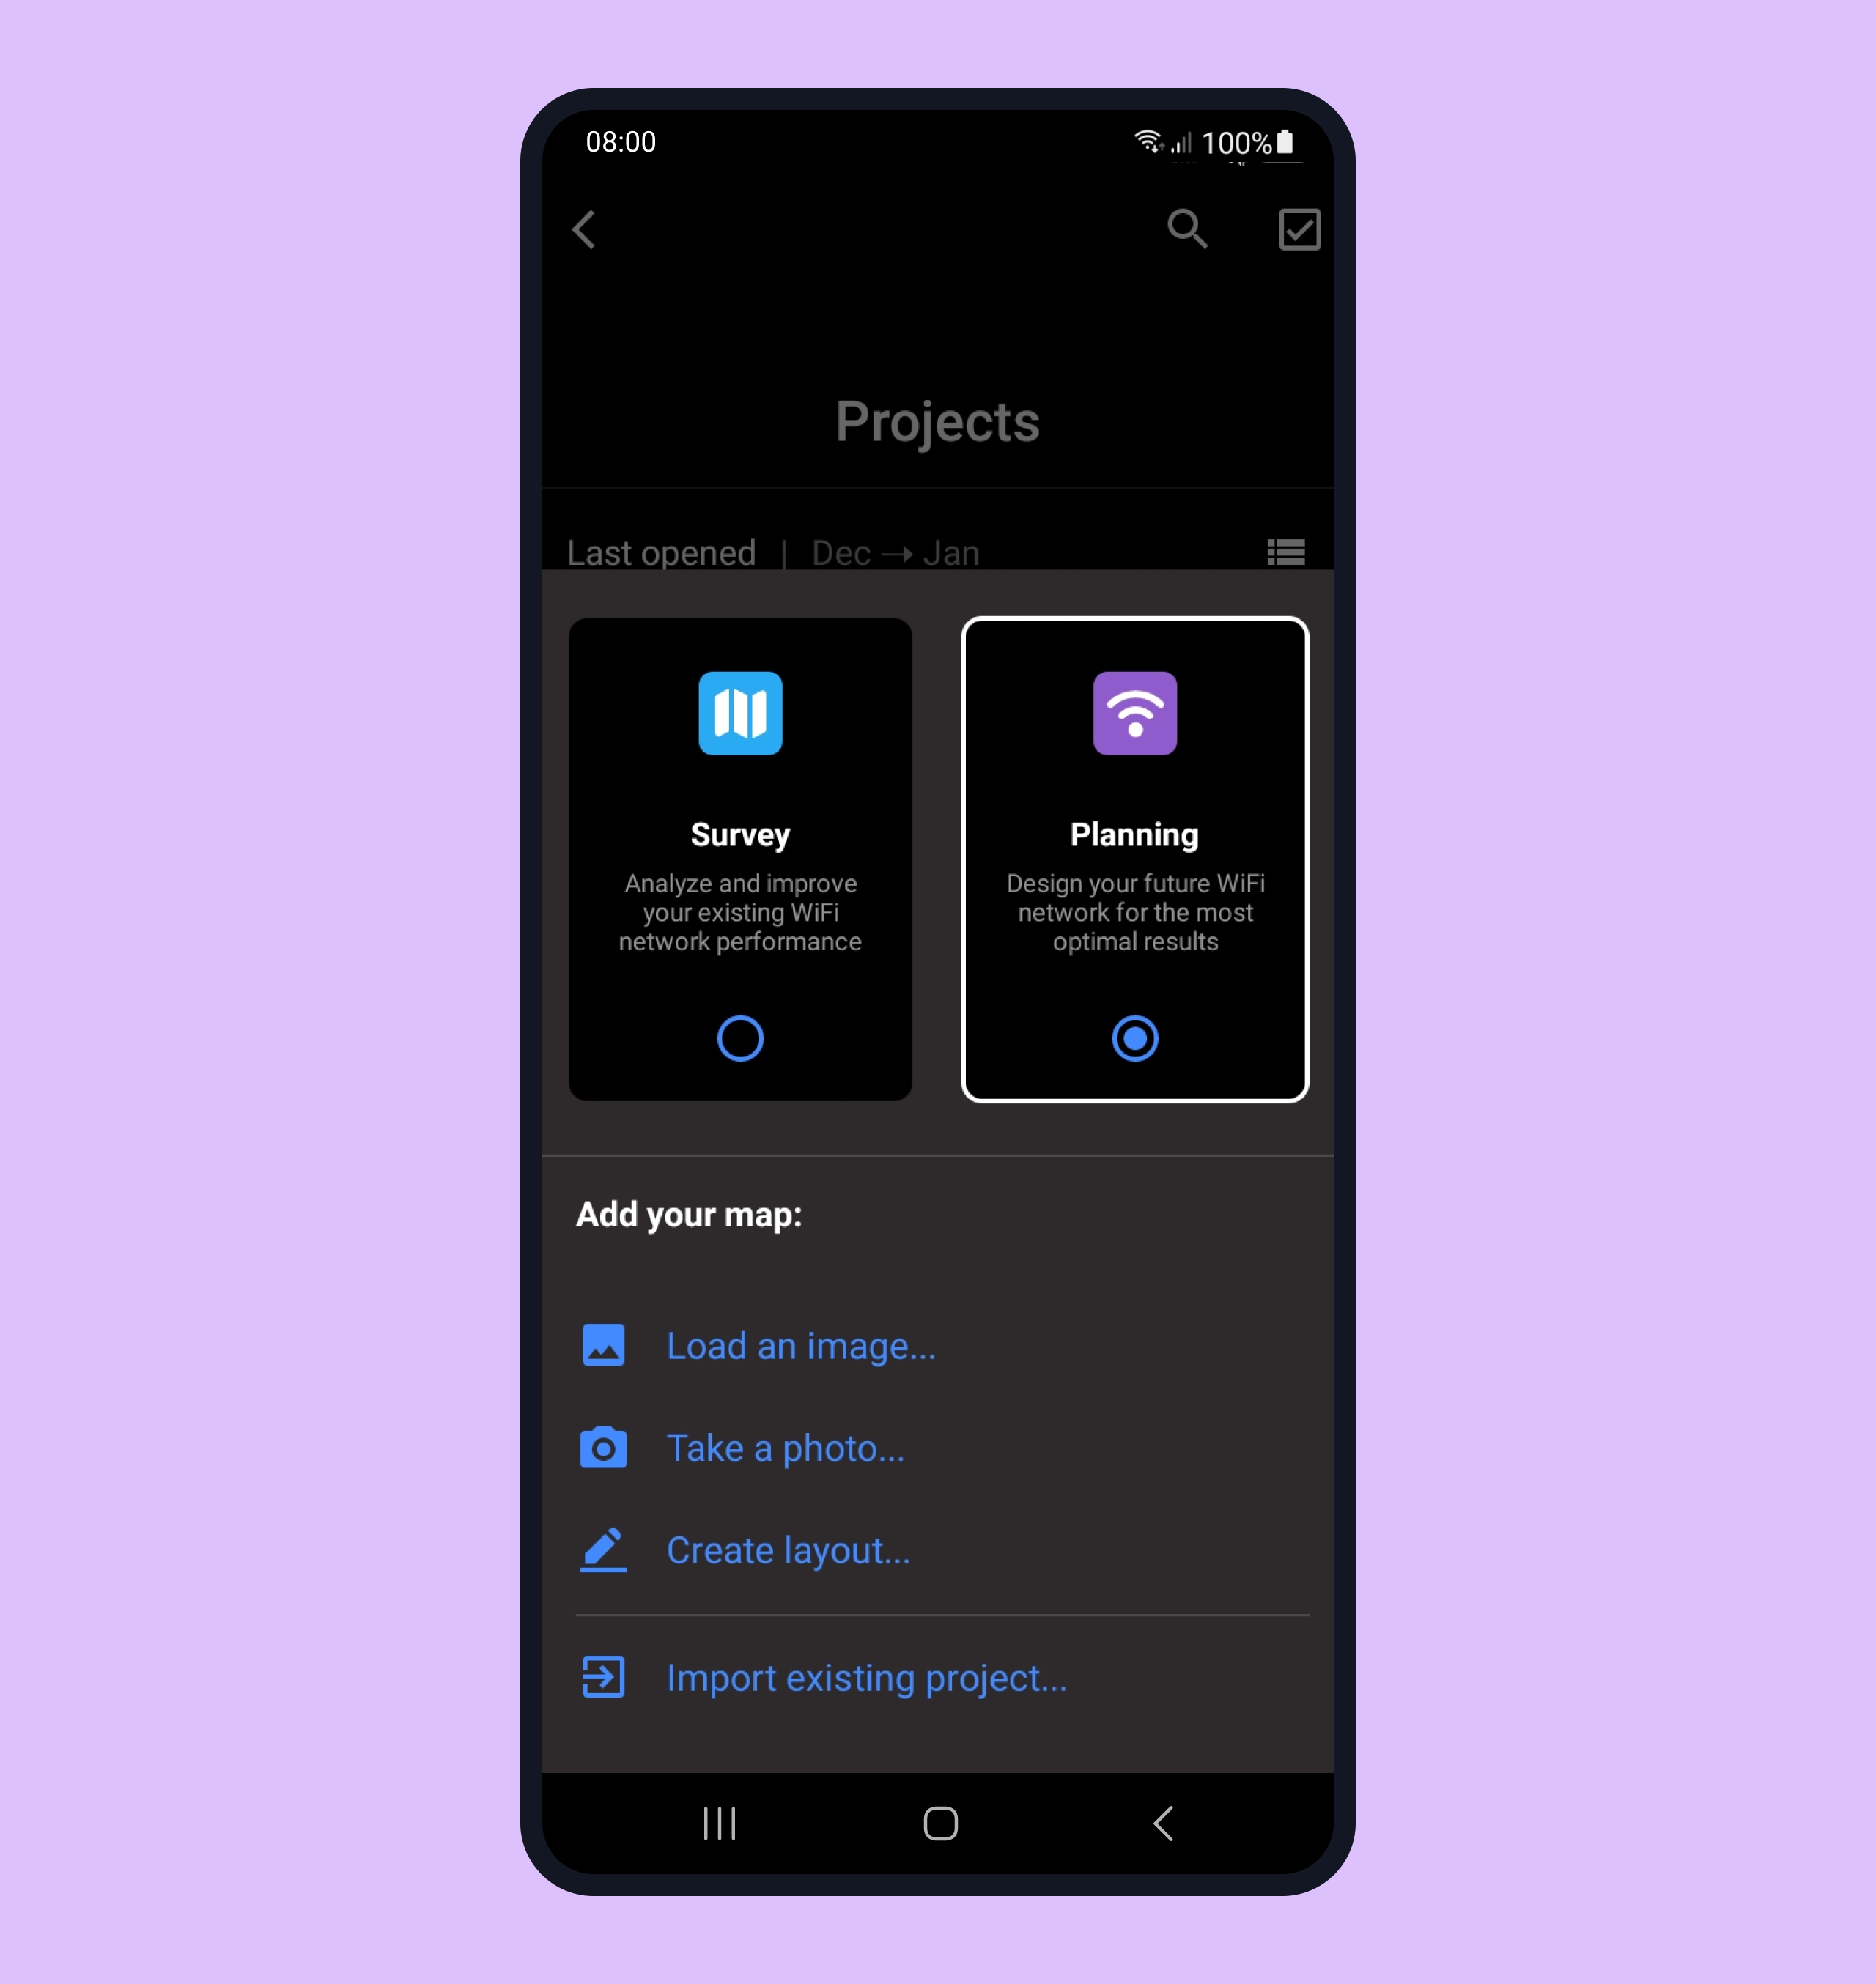
Step 2. Select the Survey option. Load a file with the map of your surveyed area from your photo library, take a photo or start with a blank canvas (currently no drawing tools are available if you use blank canvas. Stay tuned for the next update).
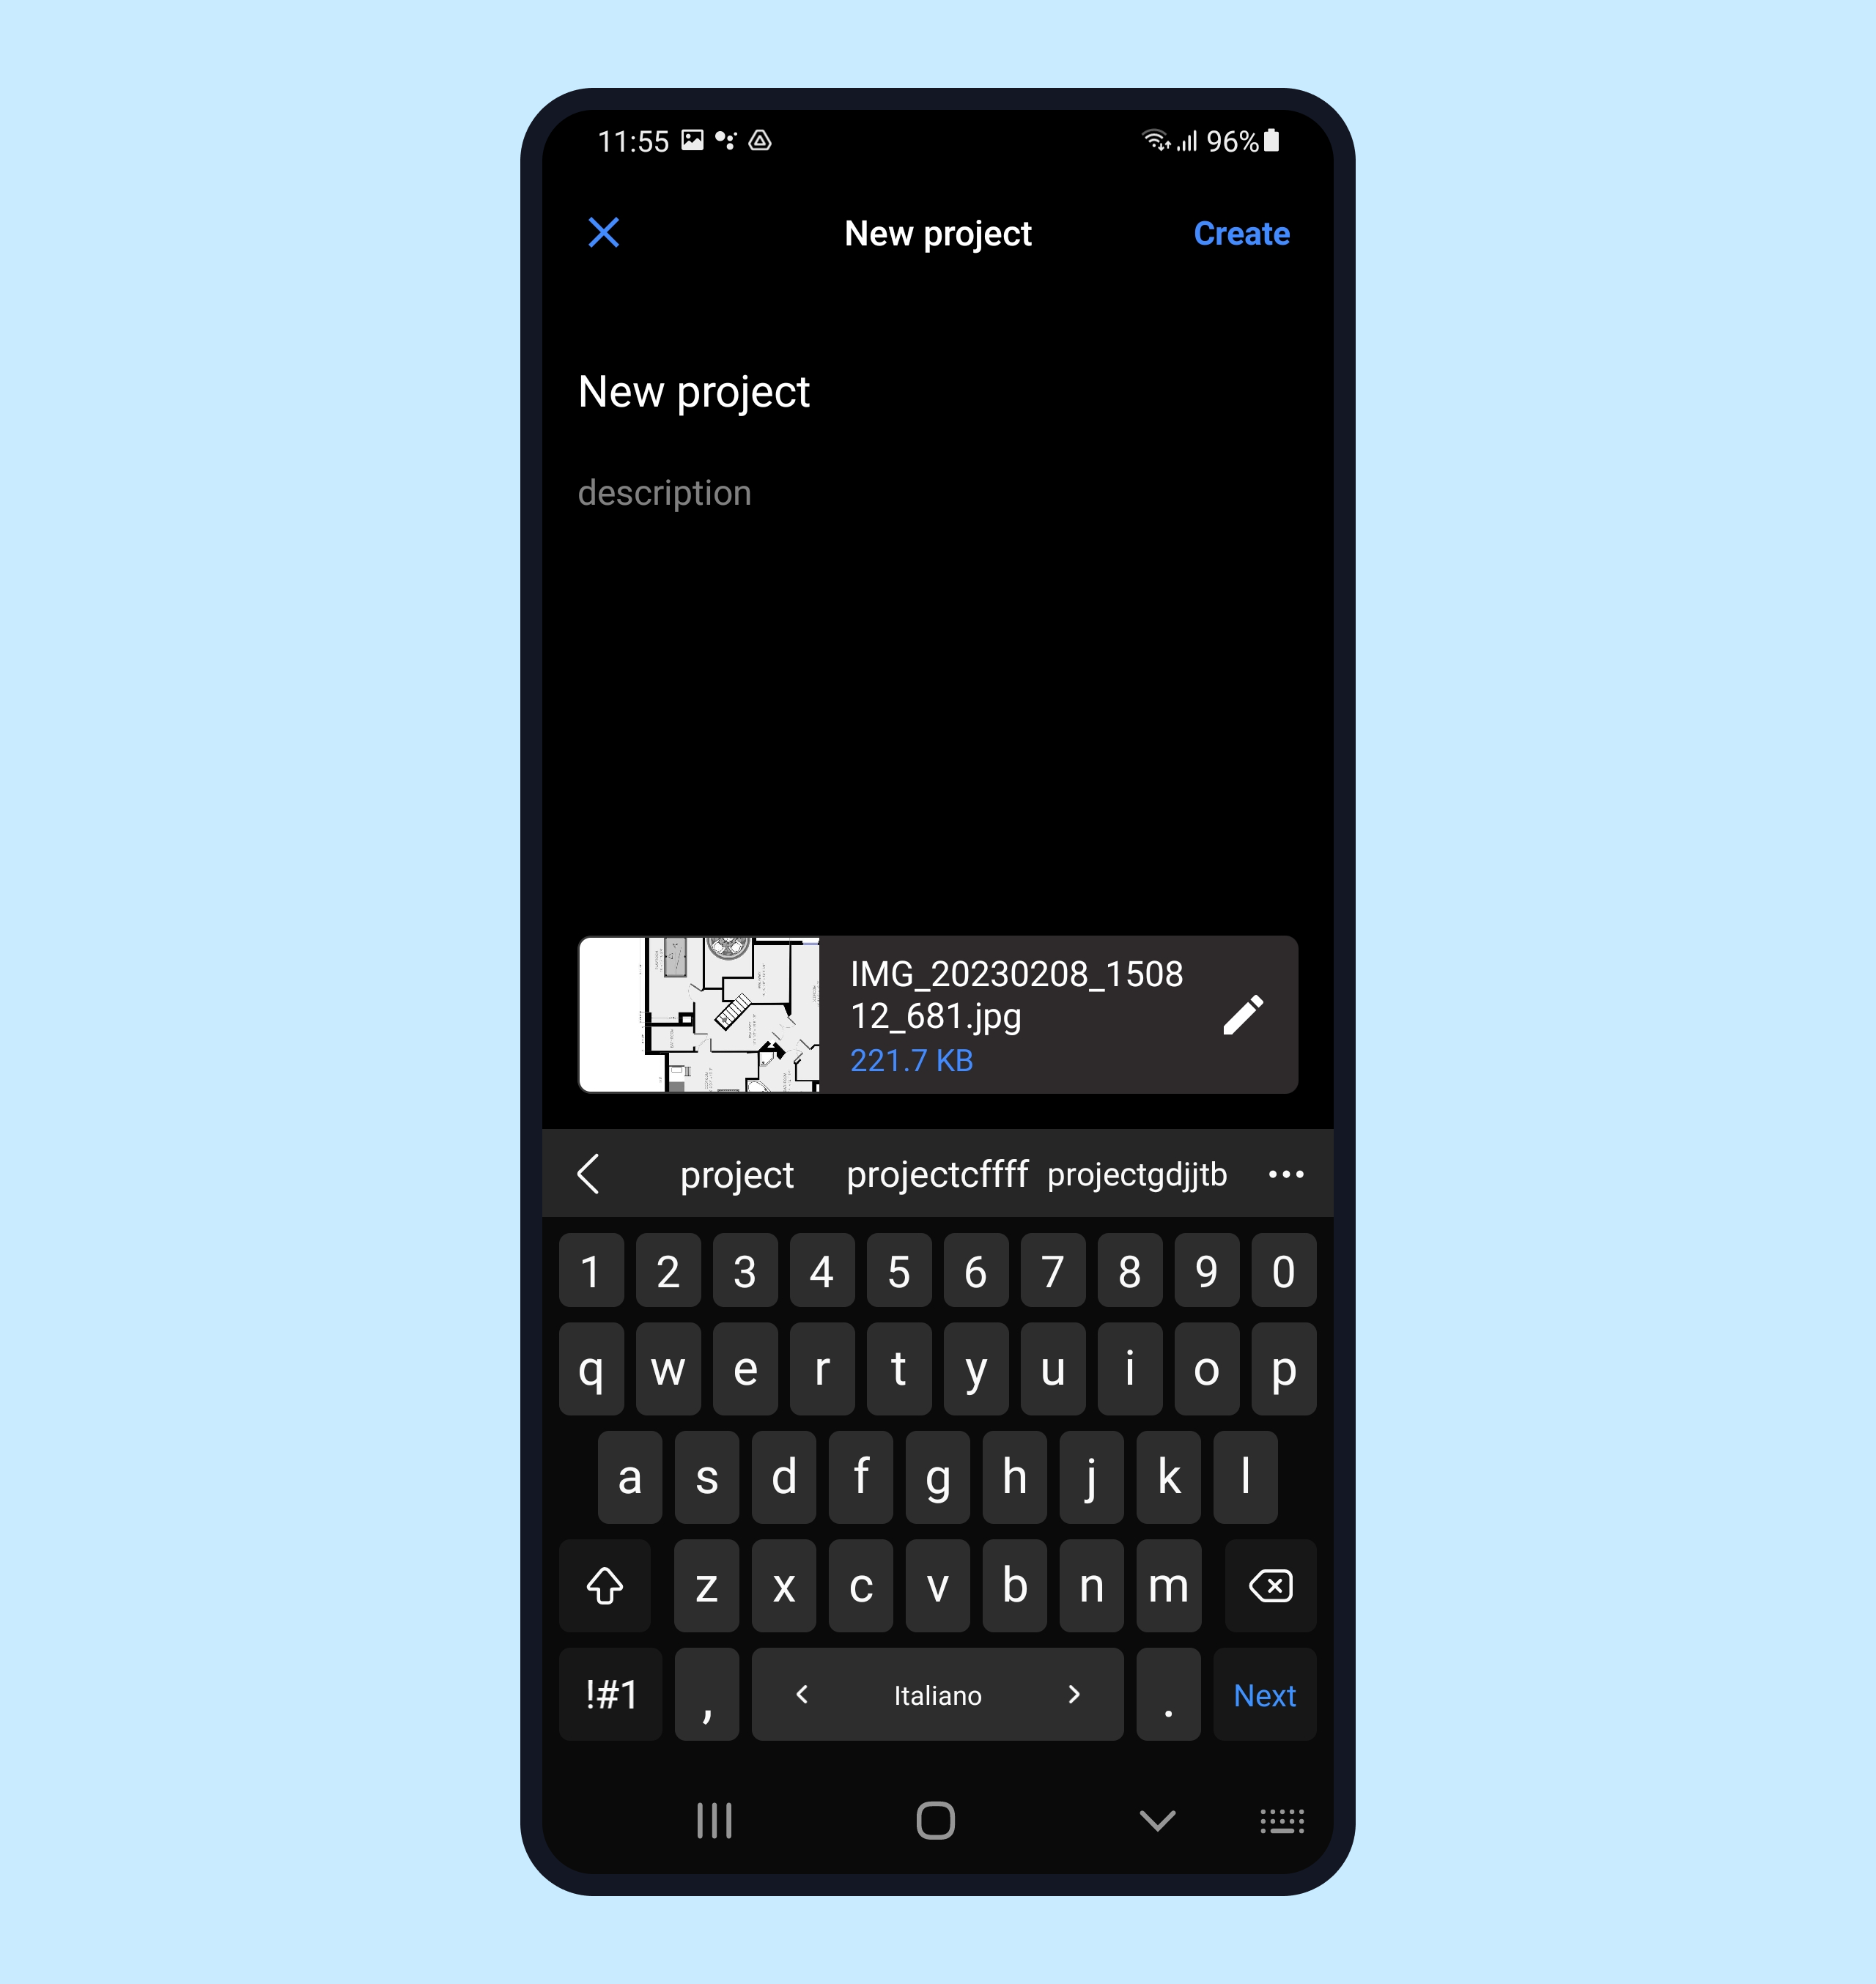
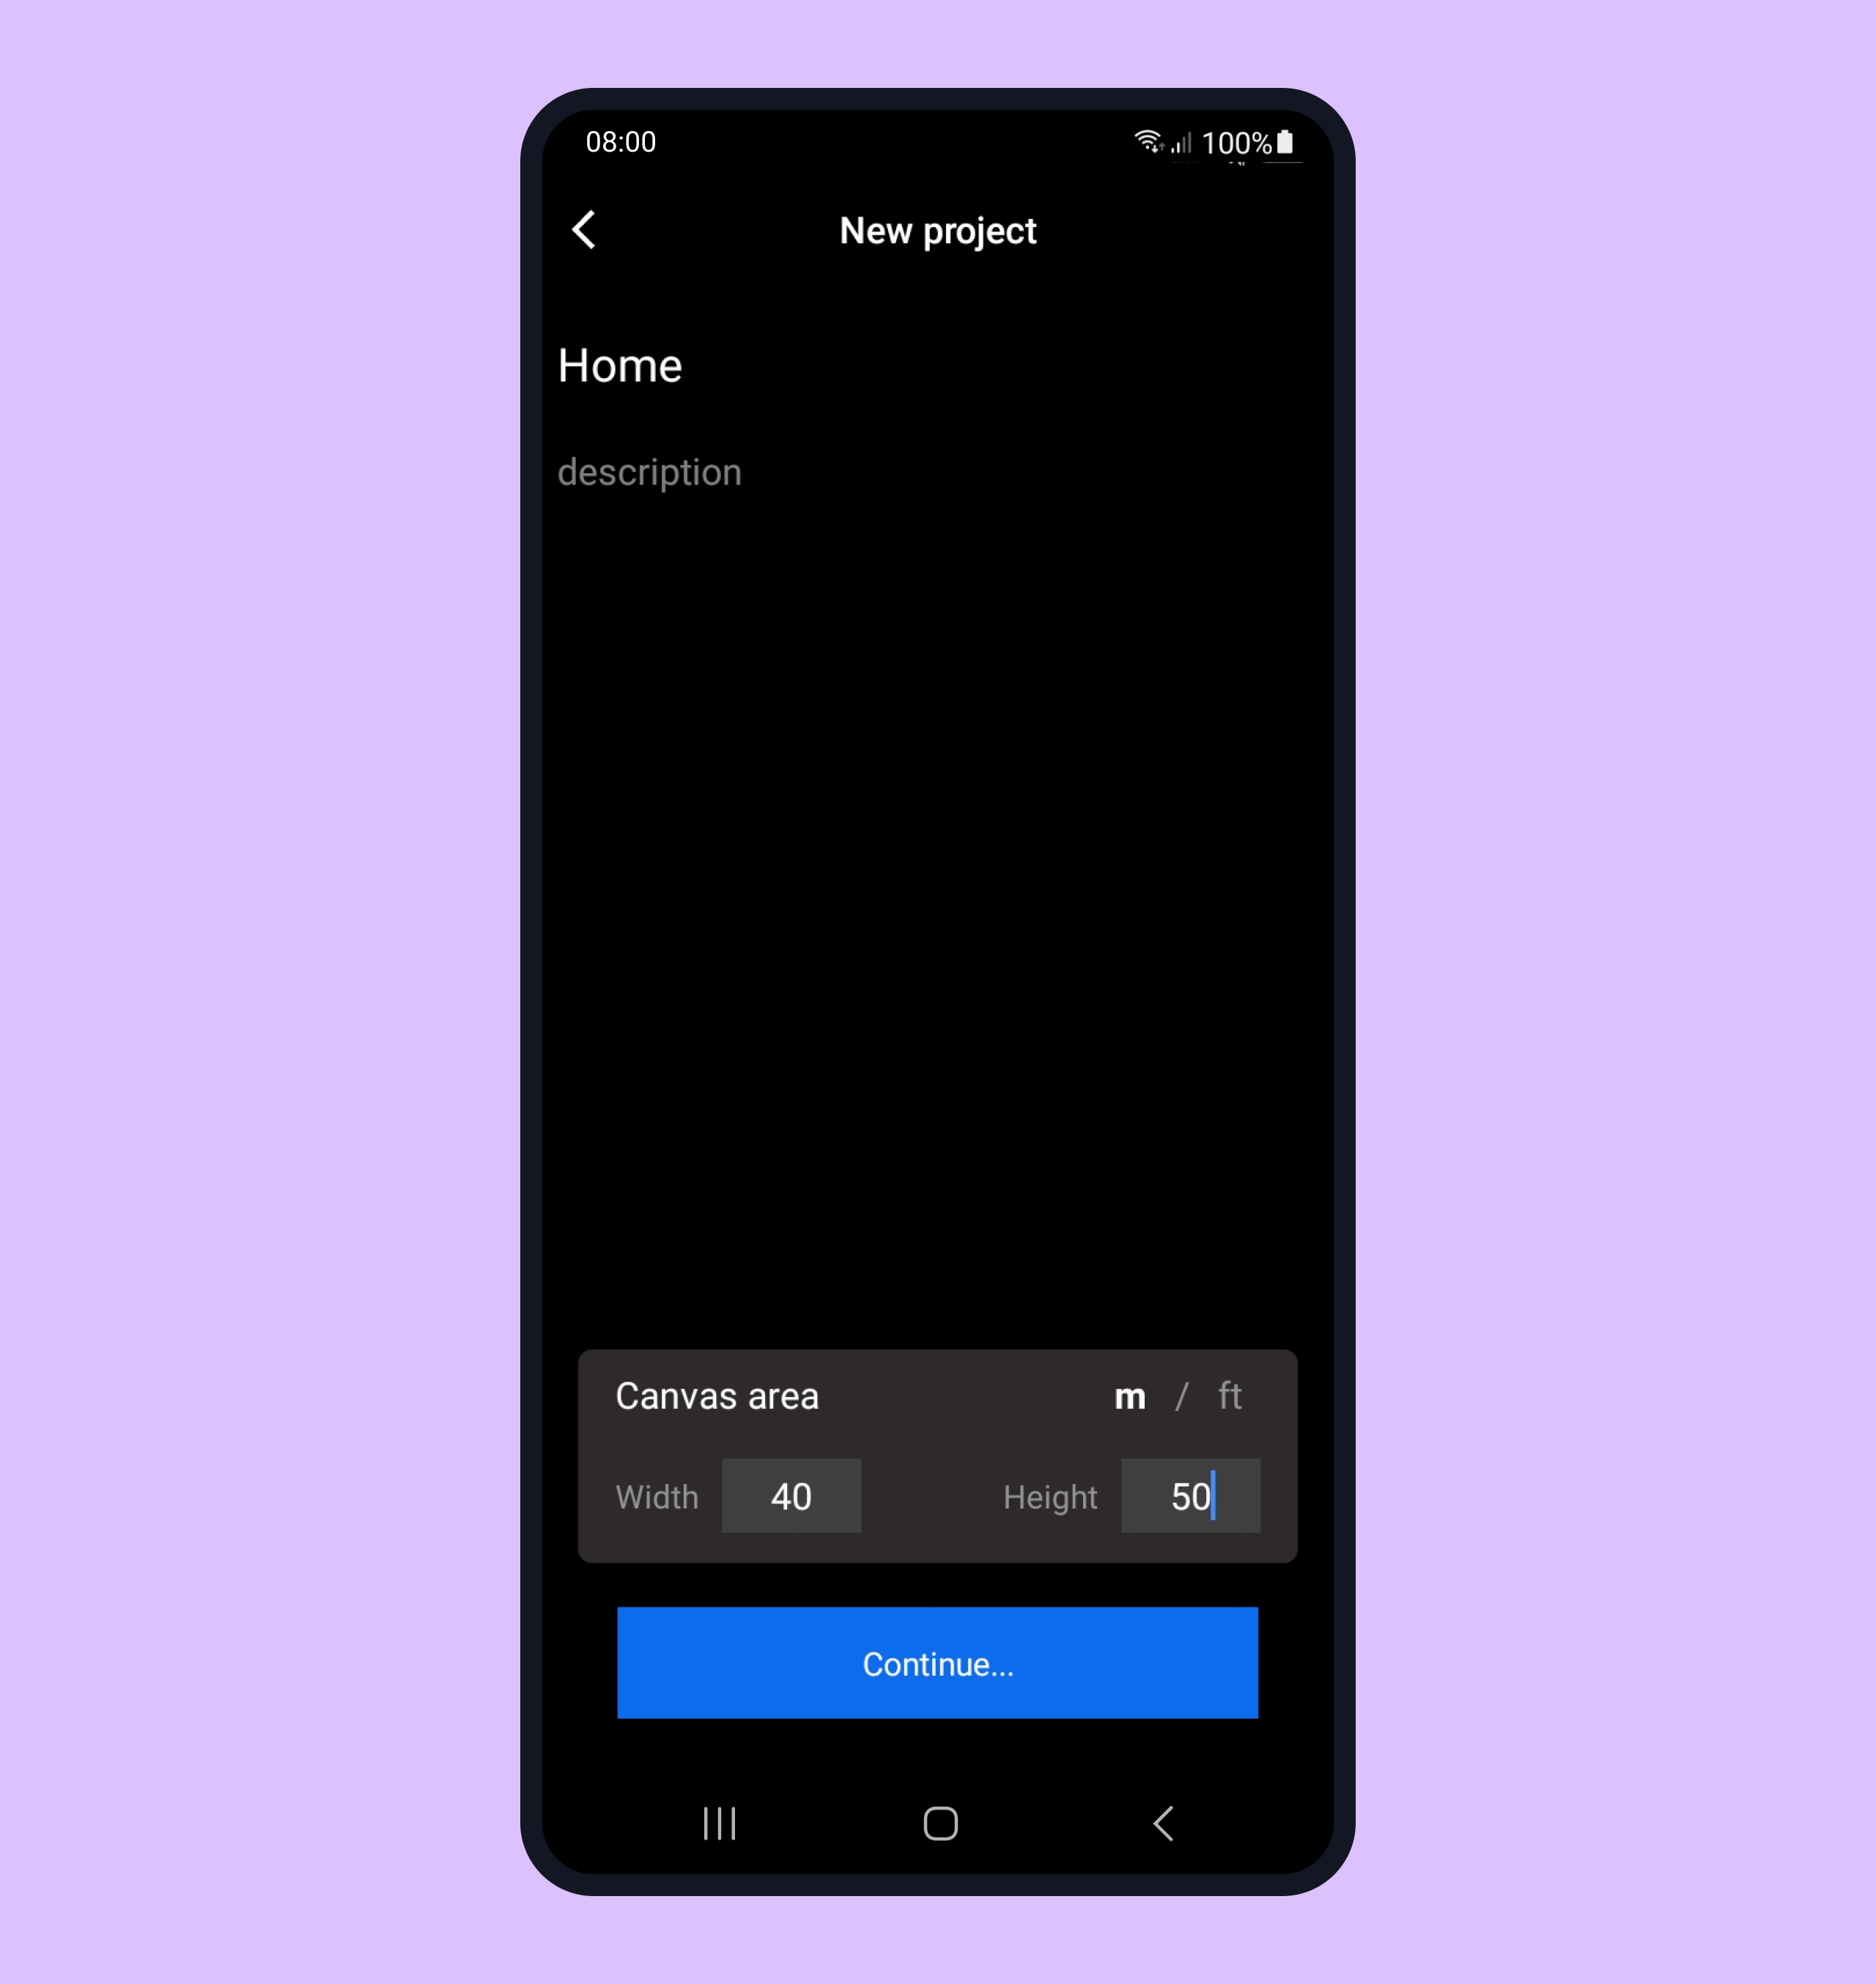
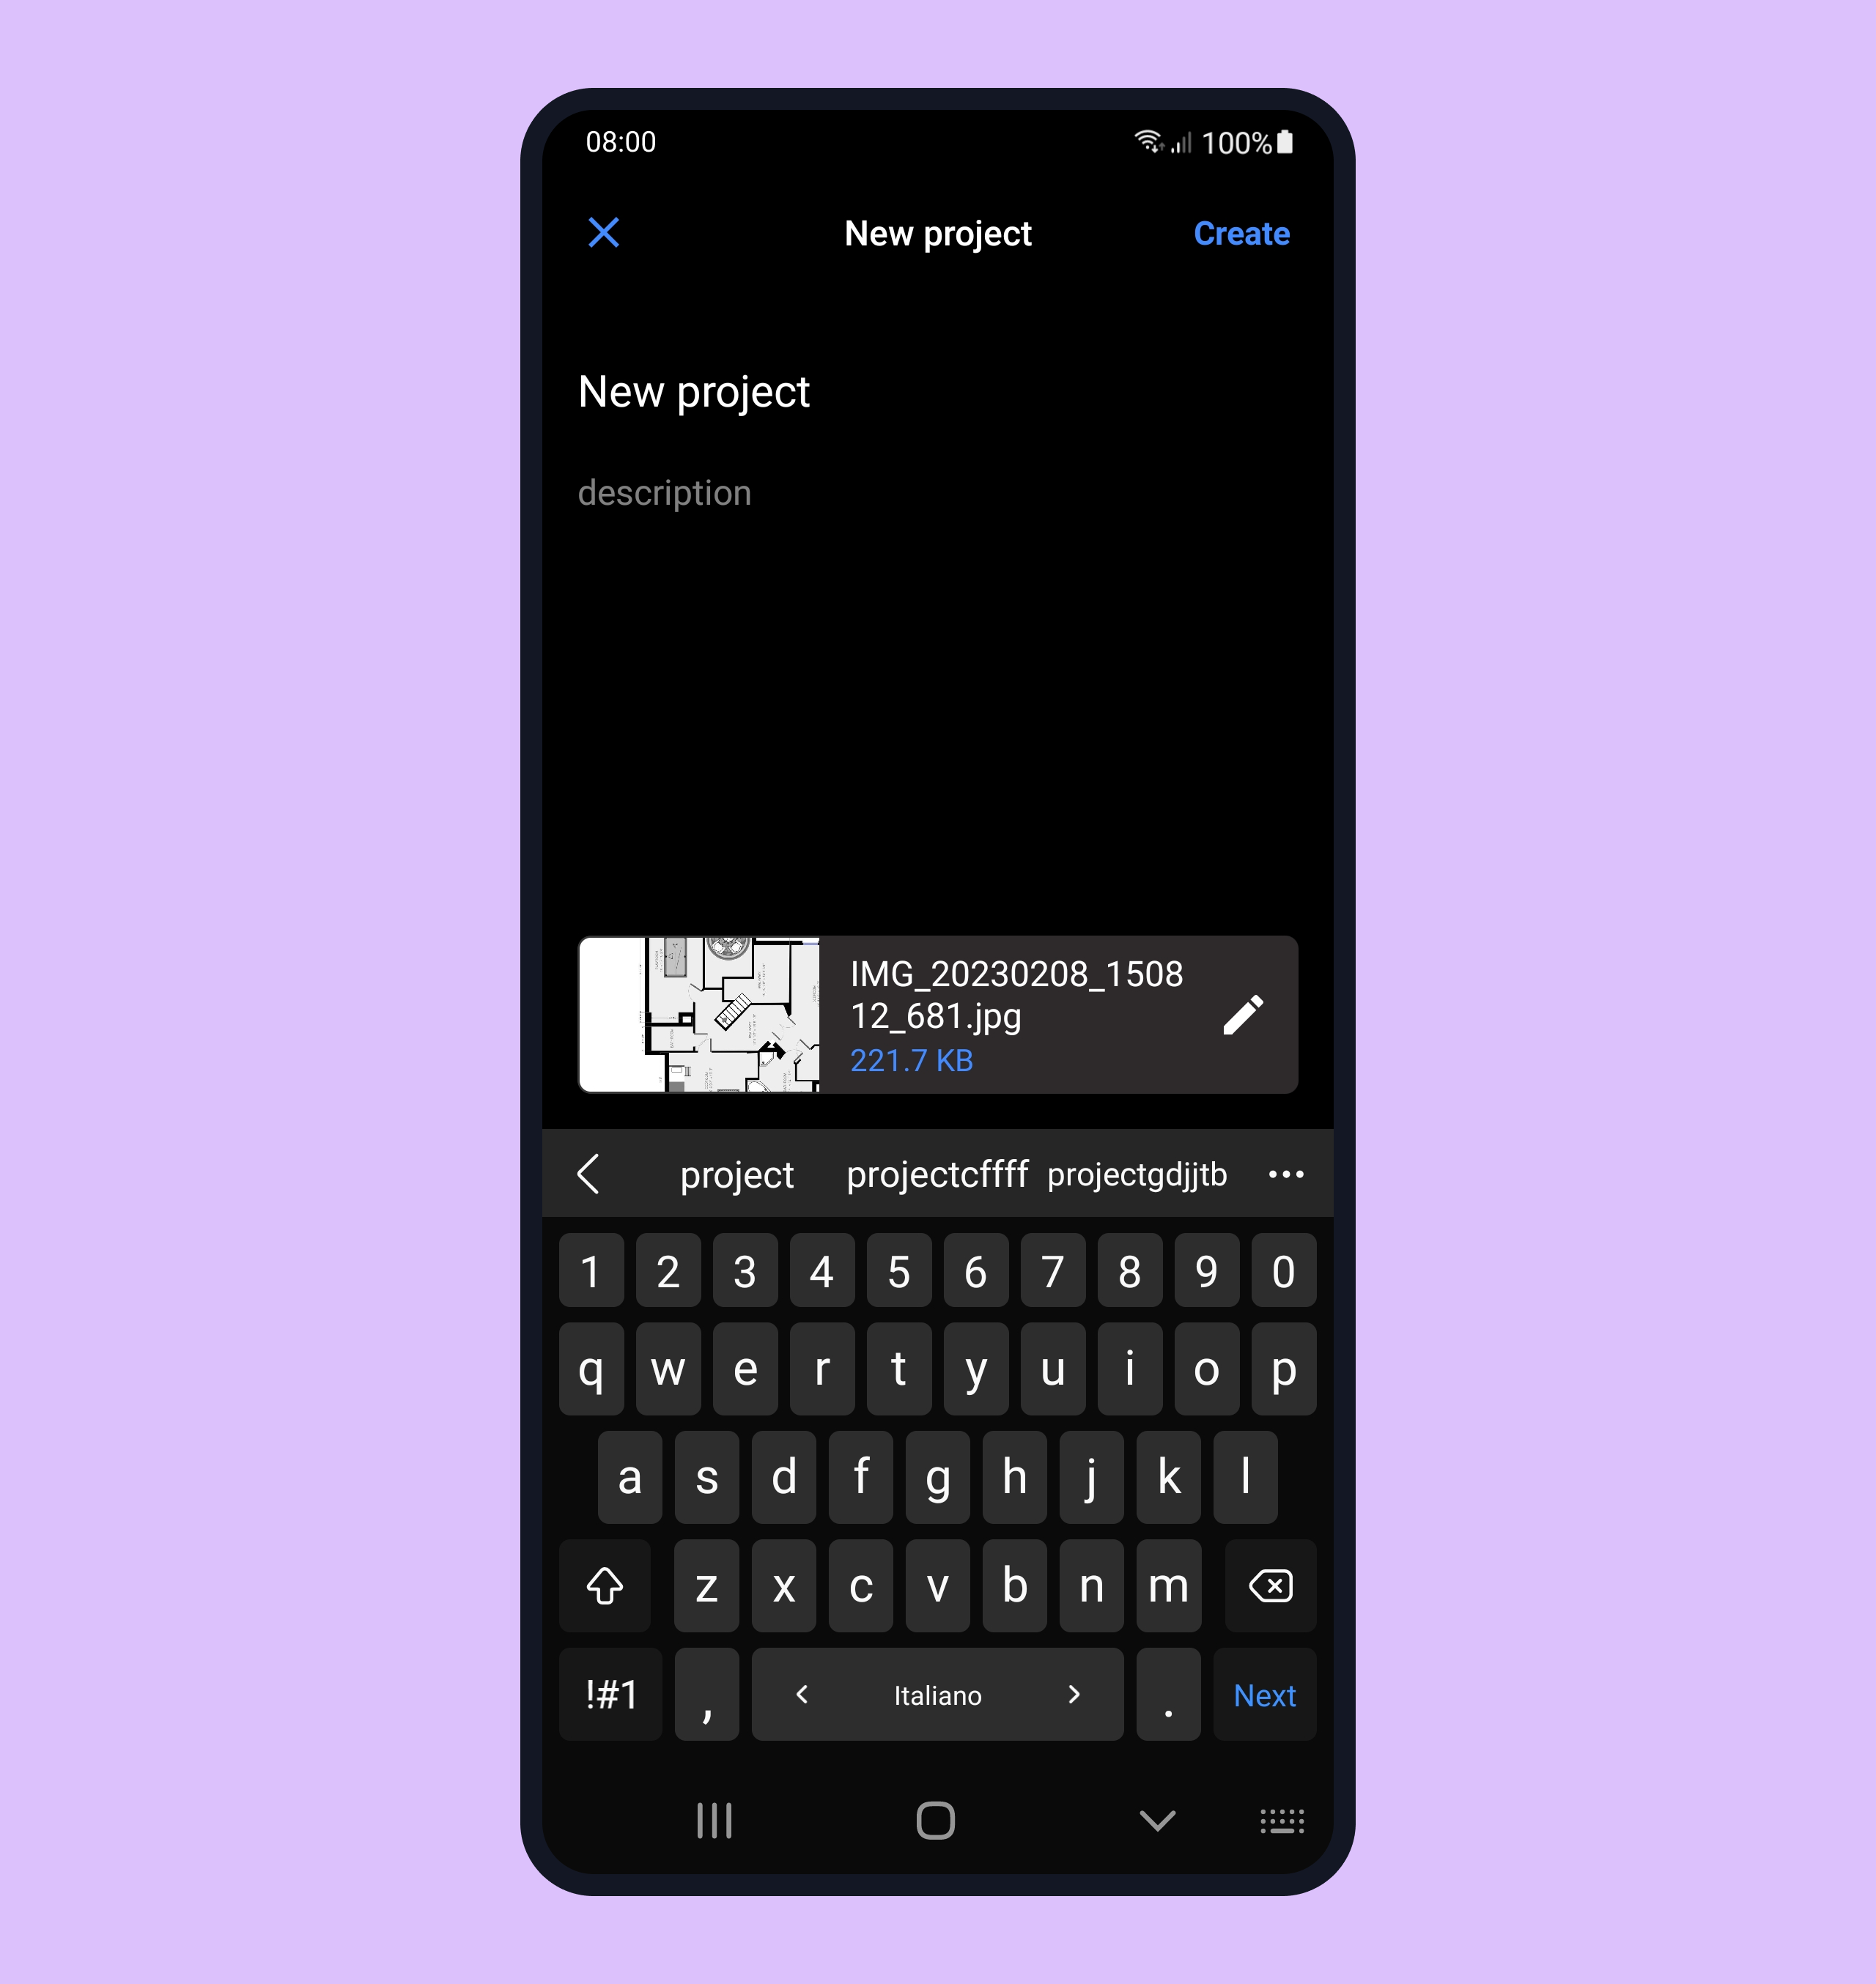
Step 3. Name your project and add description if required.
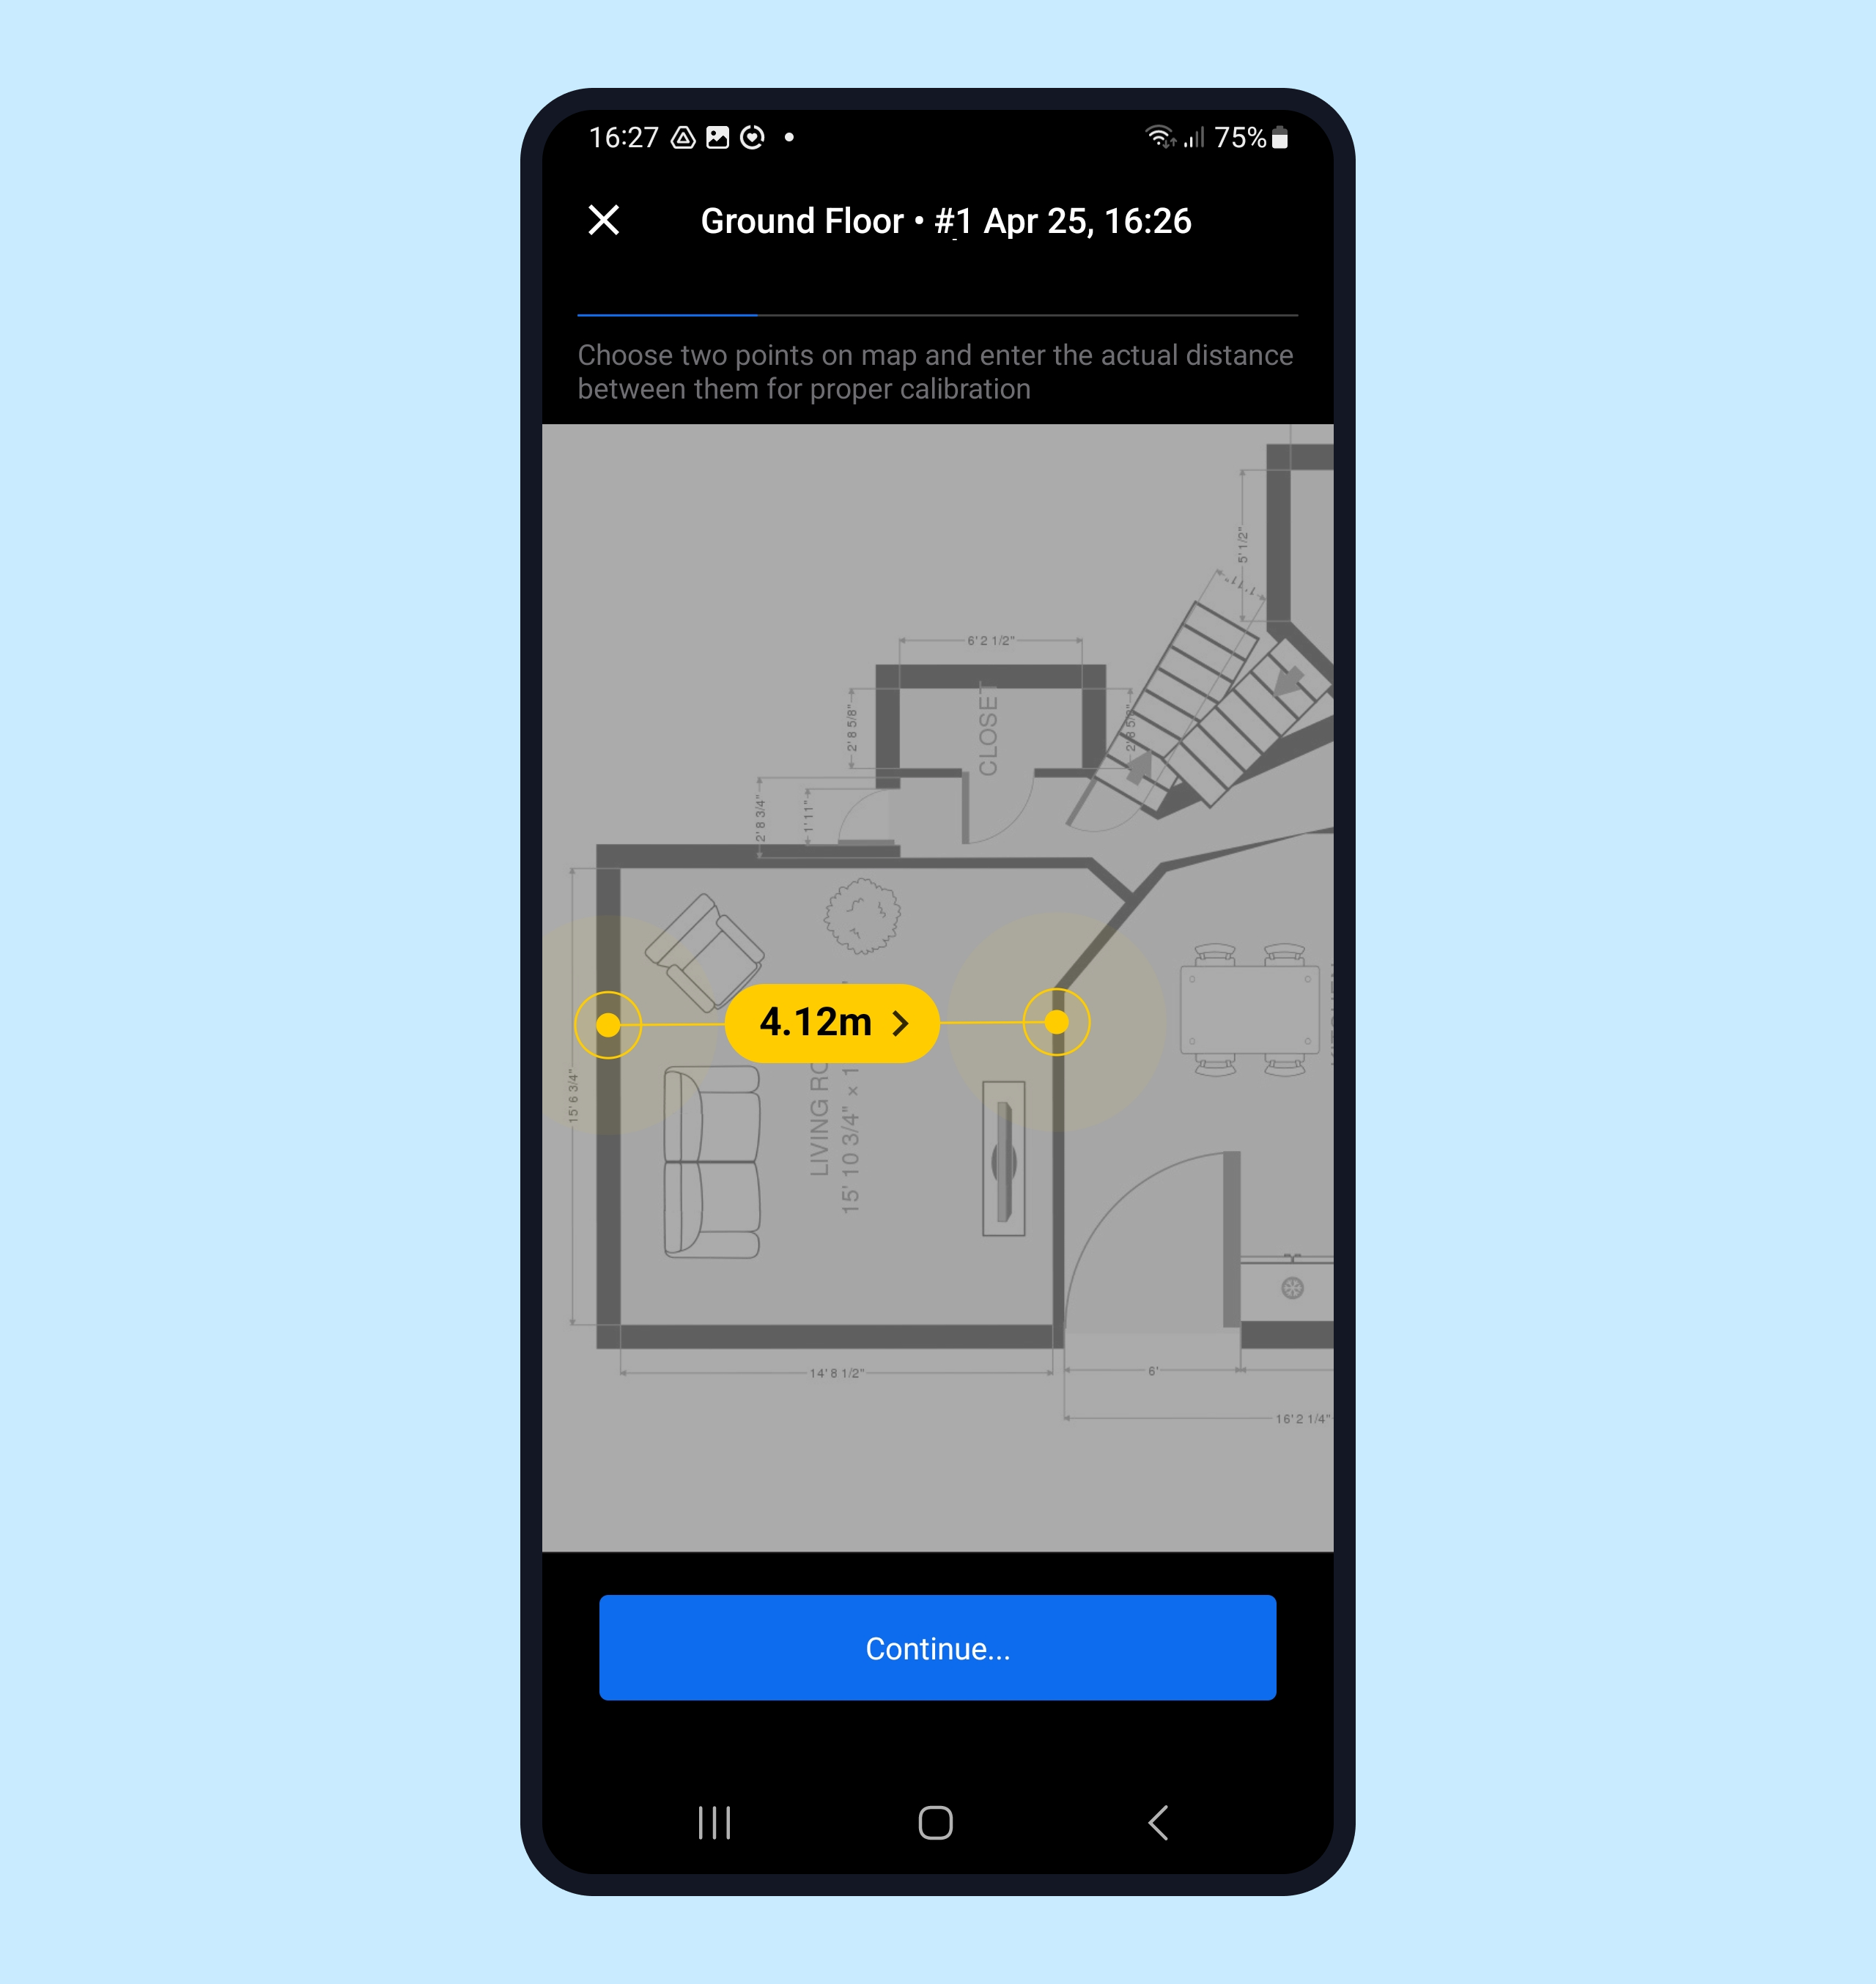
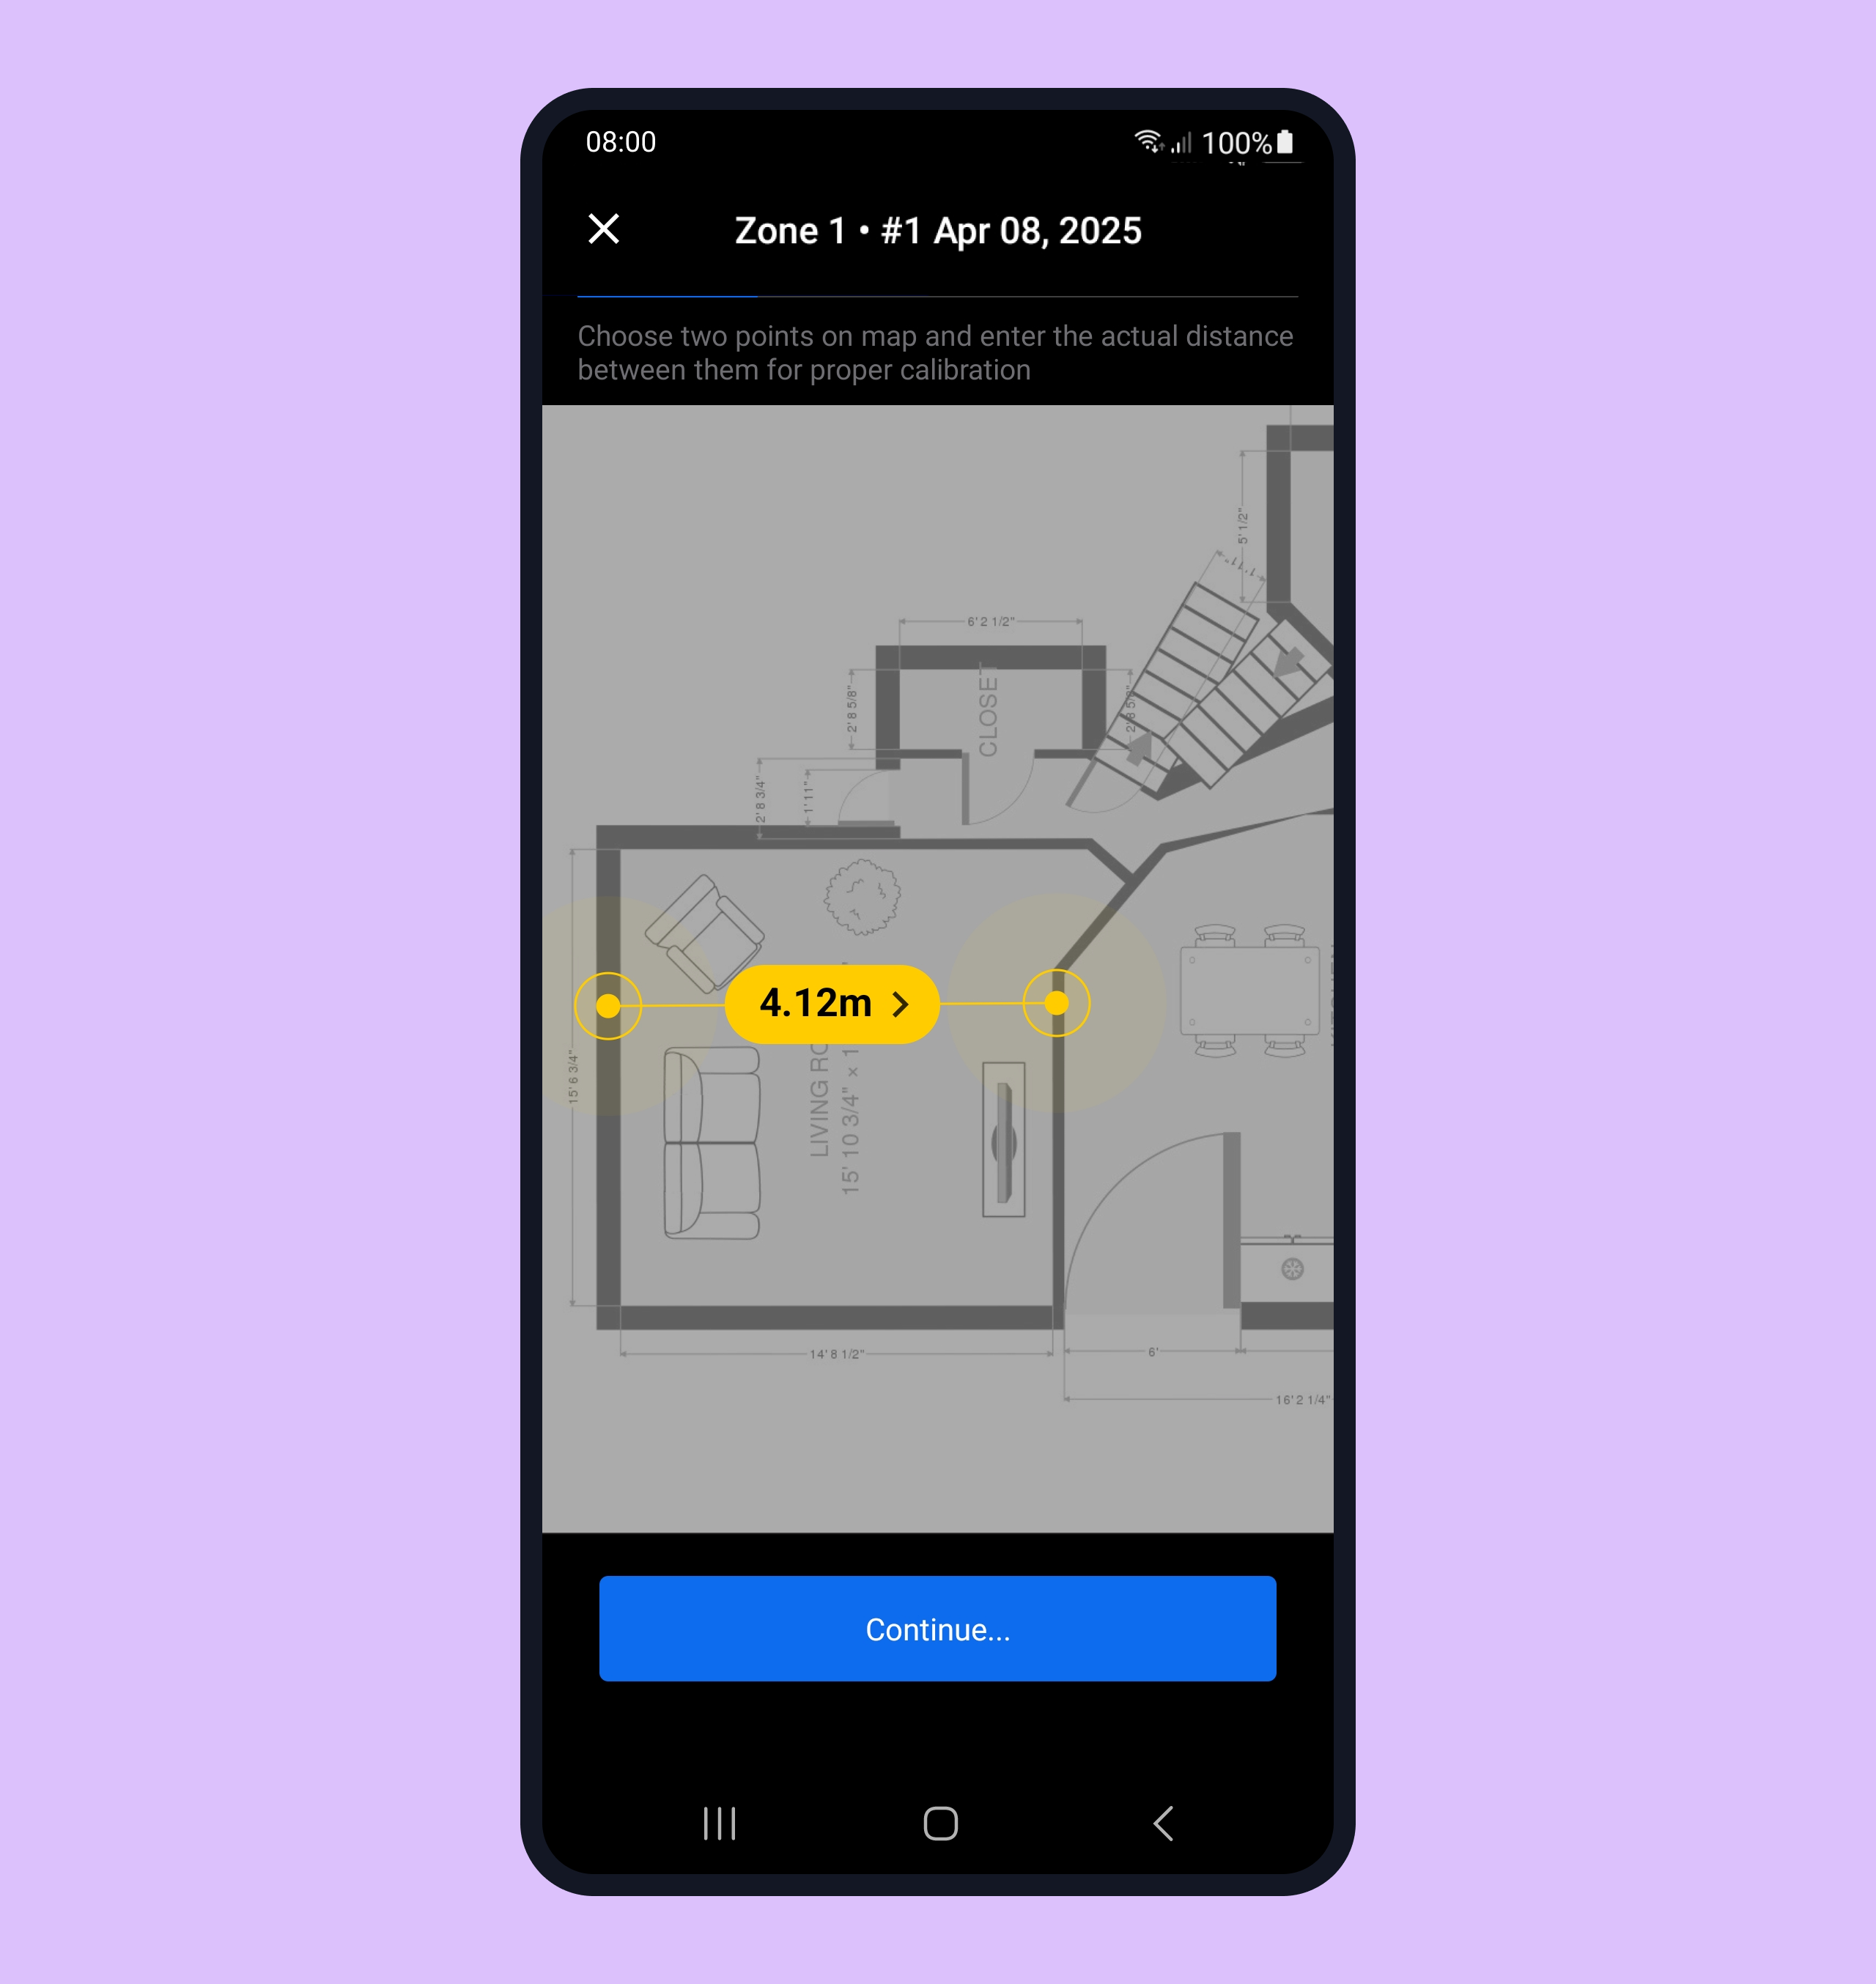
Step 4. In case you are creating a layout, you’ll set the canvas size before clicking Select. In case of an uploaded file, you’ll need to calibrate your map for correct scaling after clicking Select. To calibrate the map, use a known real distance between any two points for the most accurate measurements.
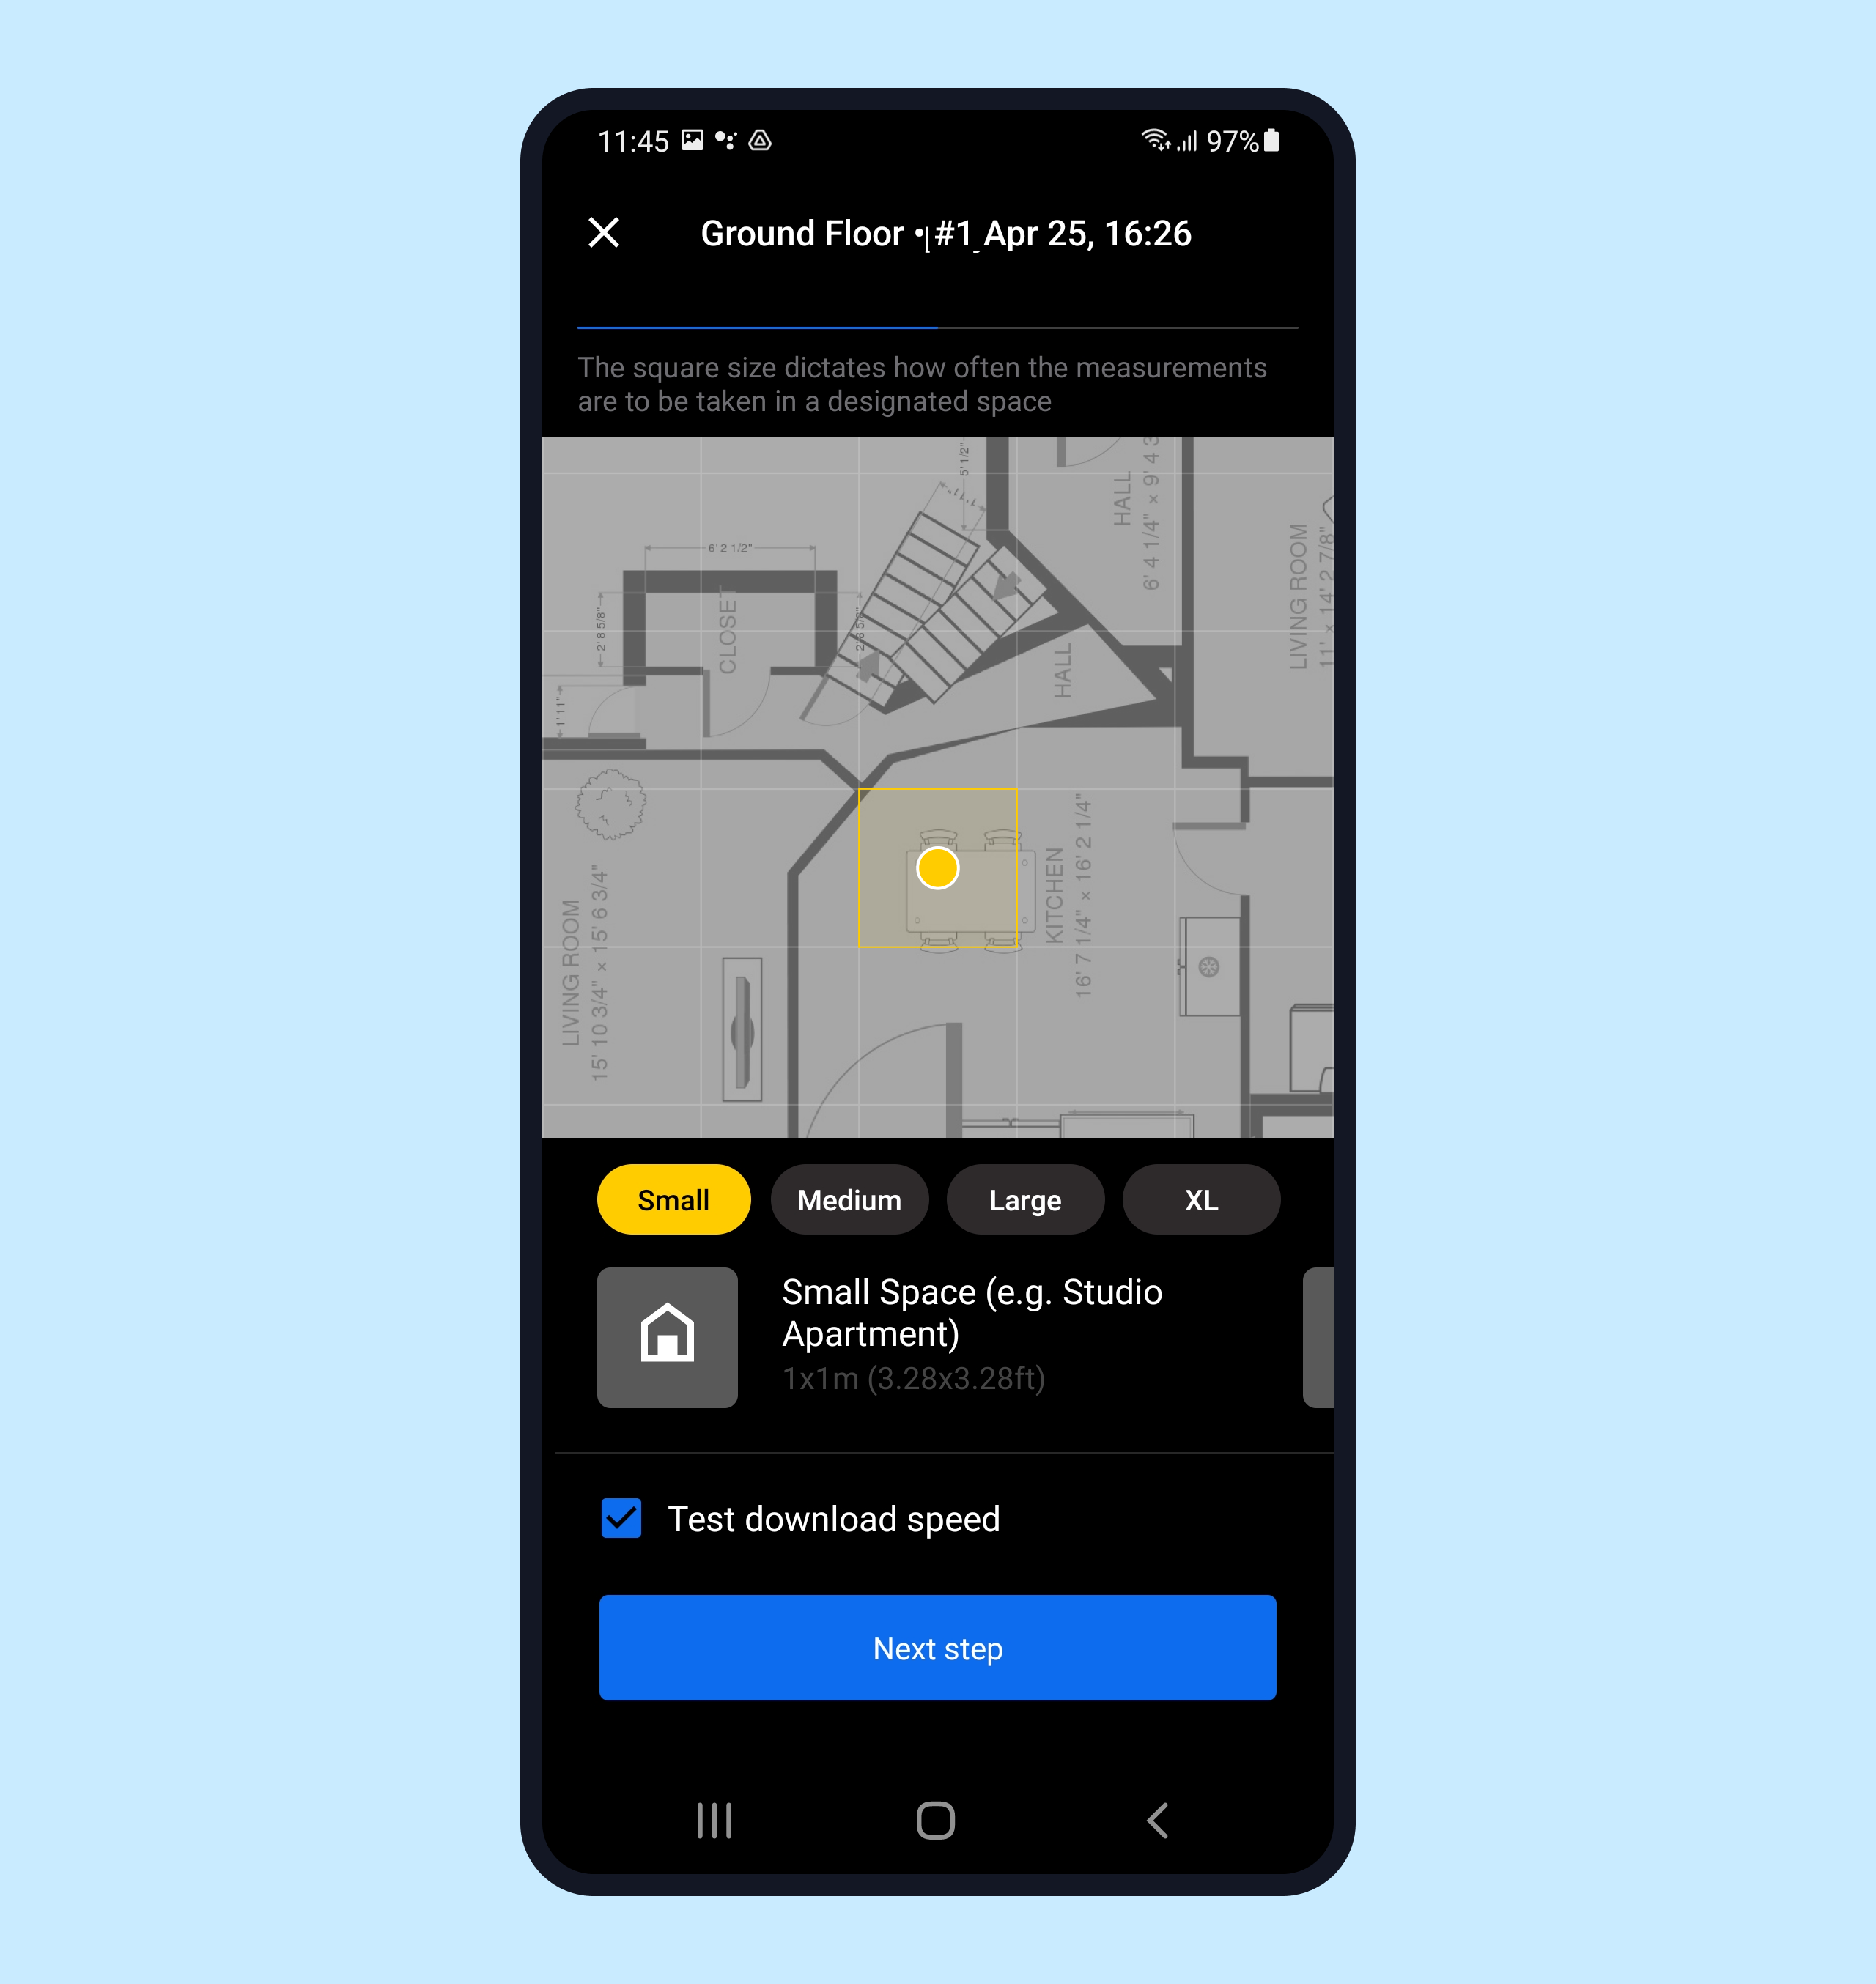
Step 5. Size your space (small, medium, large, x-large) to help NetSpot determine how often the measurements will need to be taken.
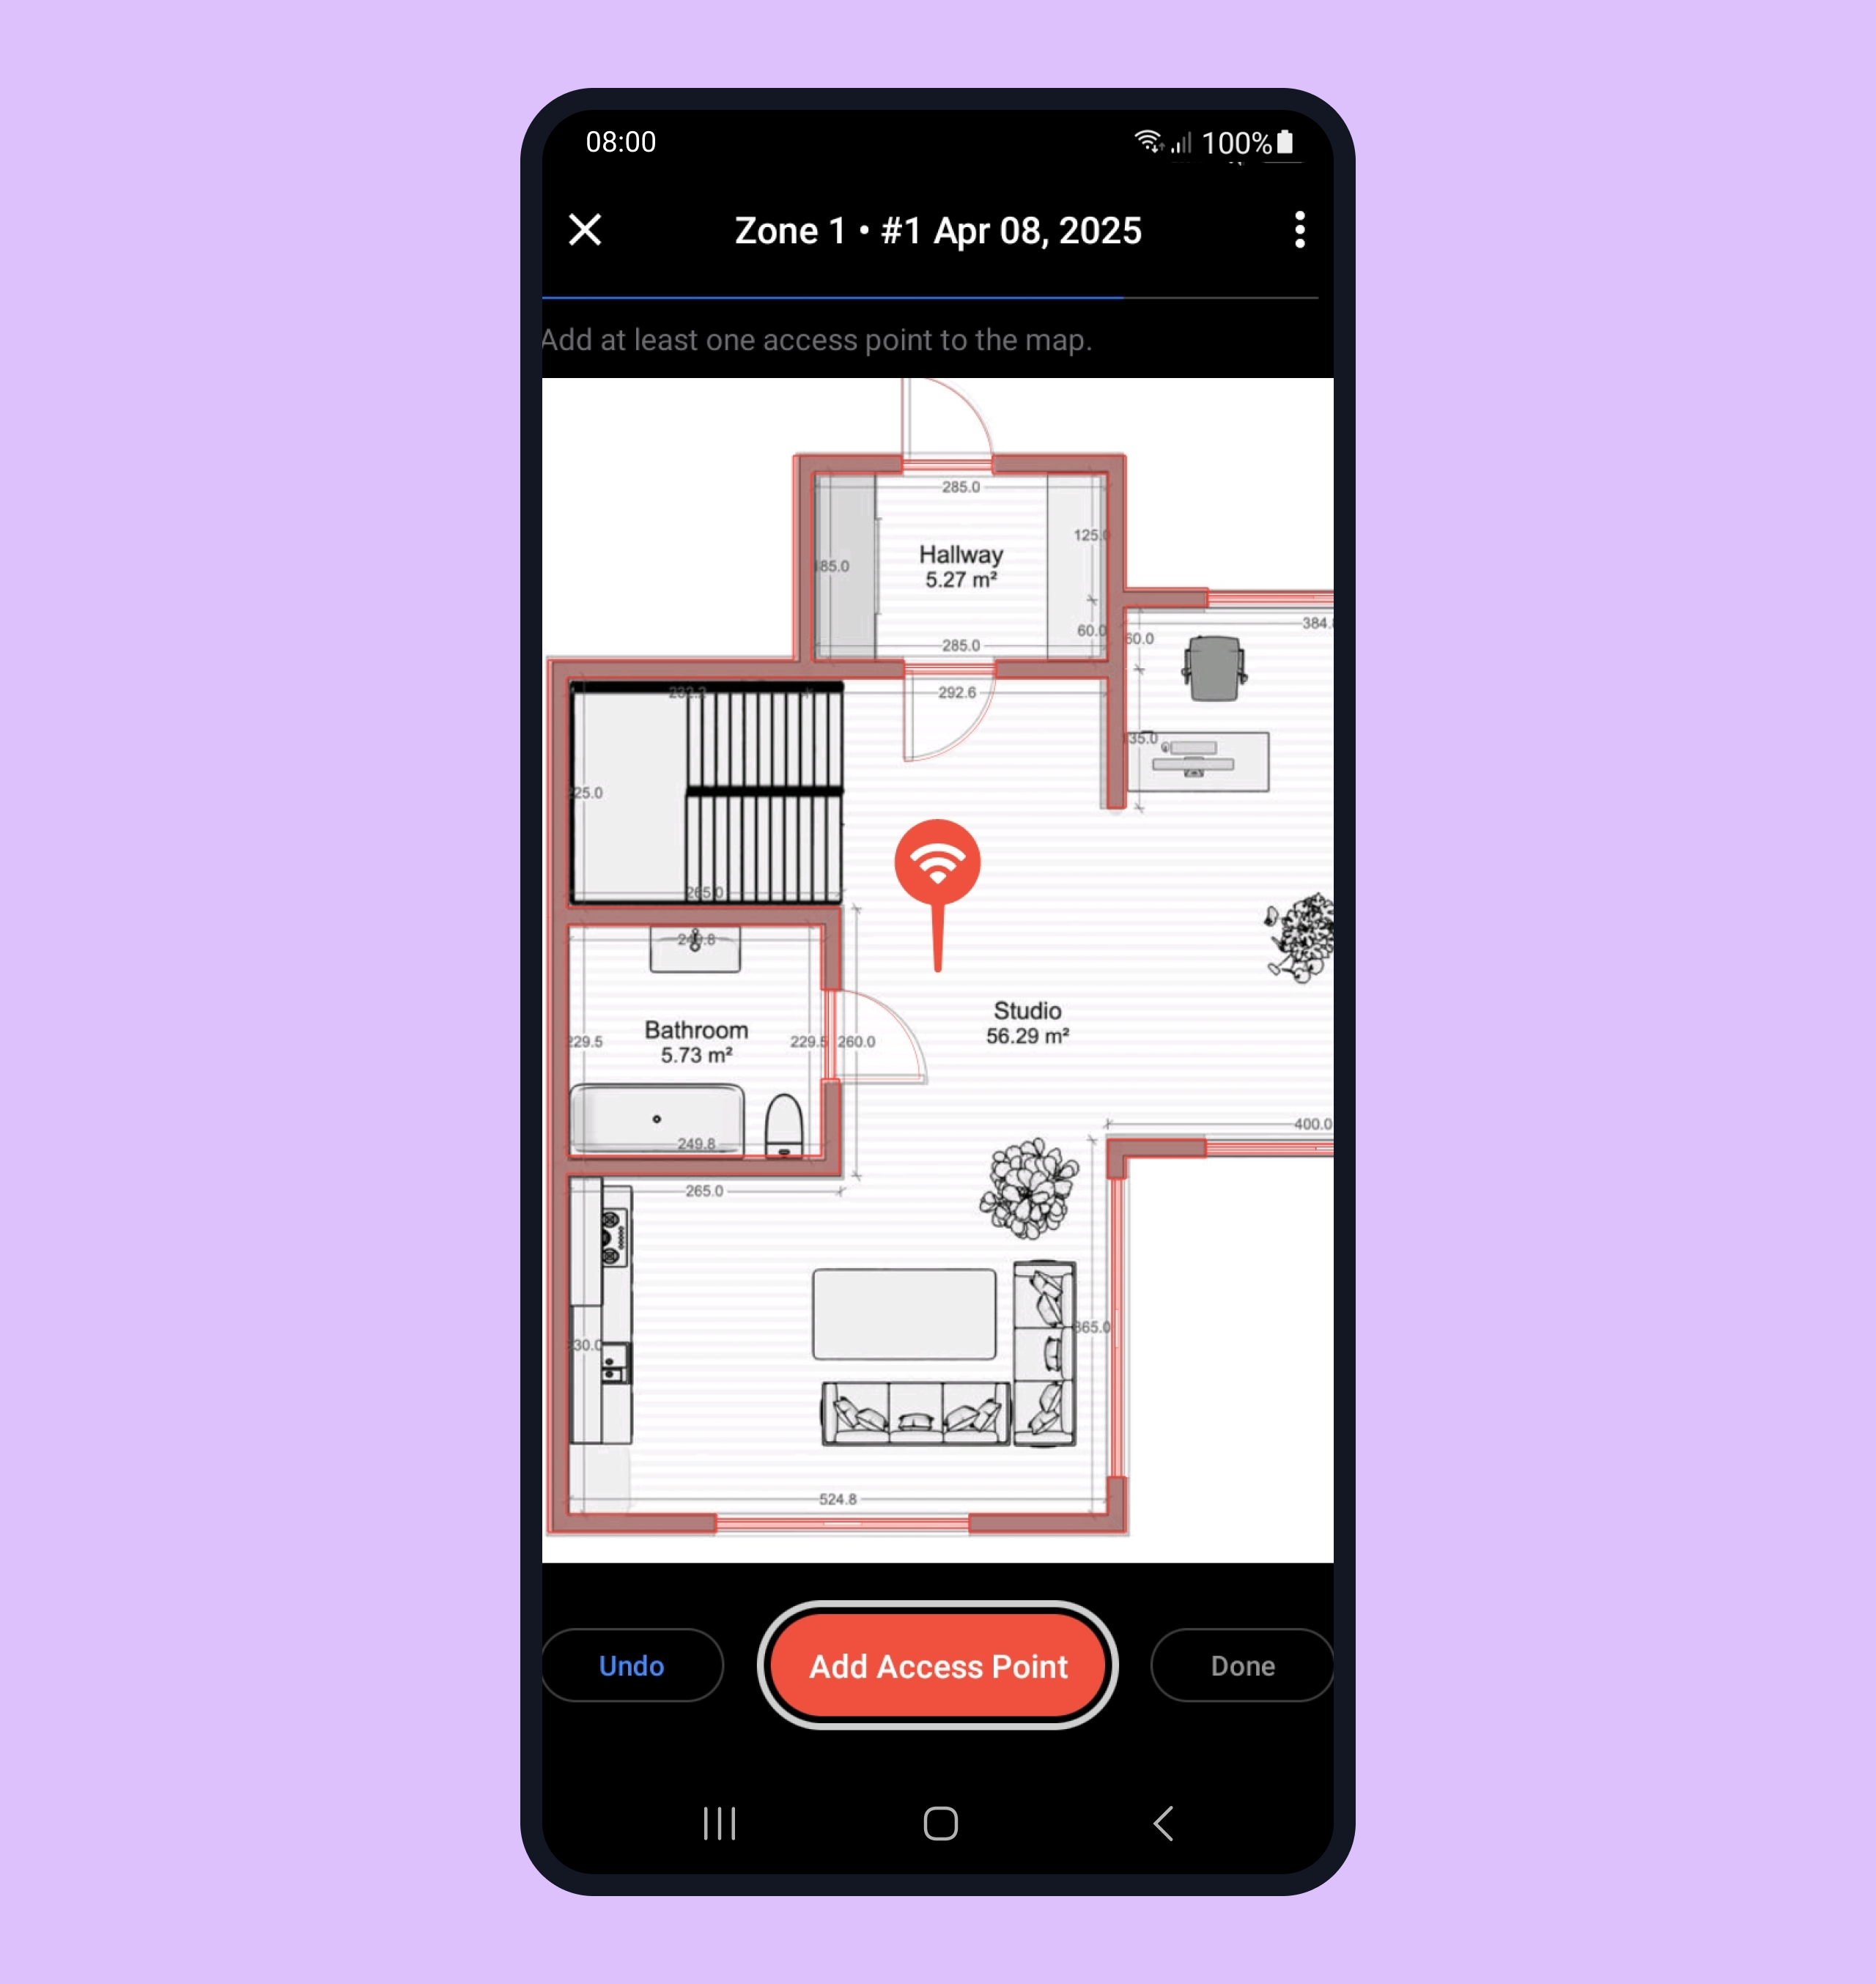
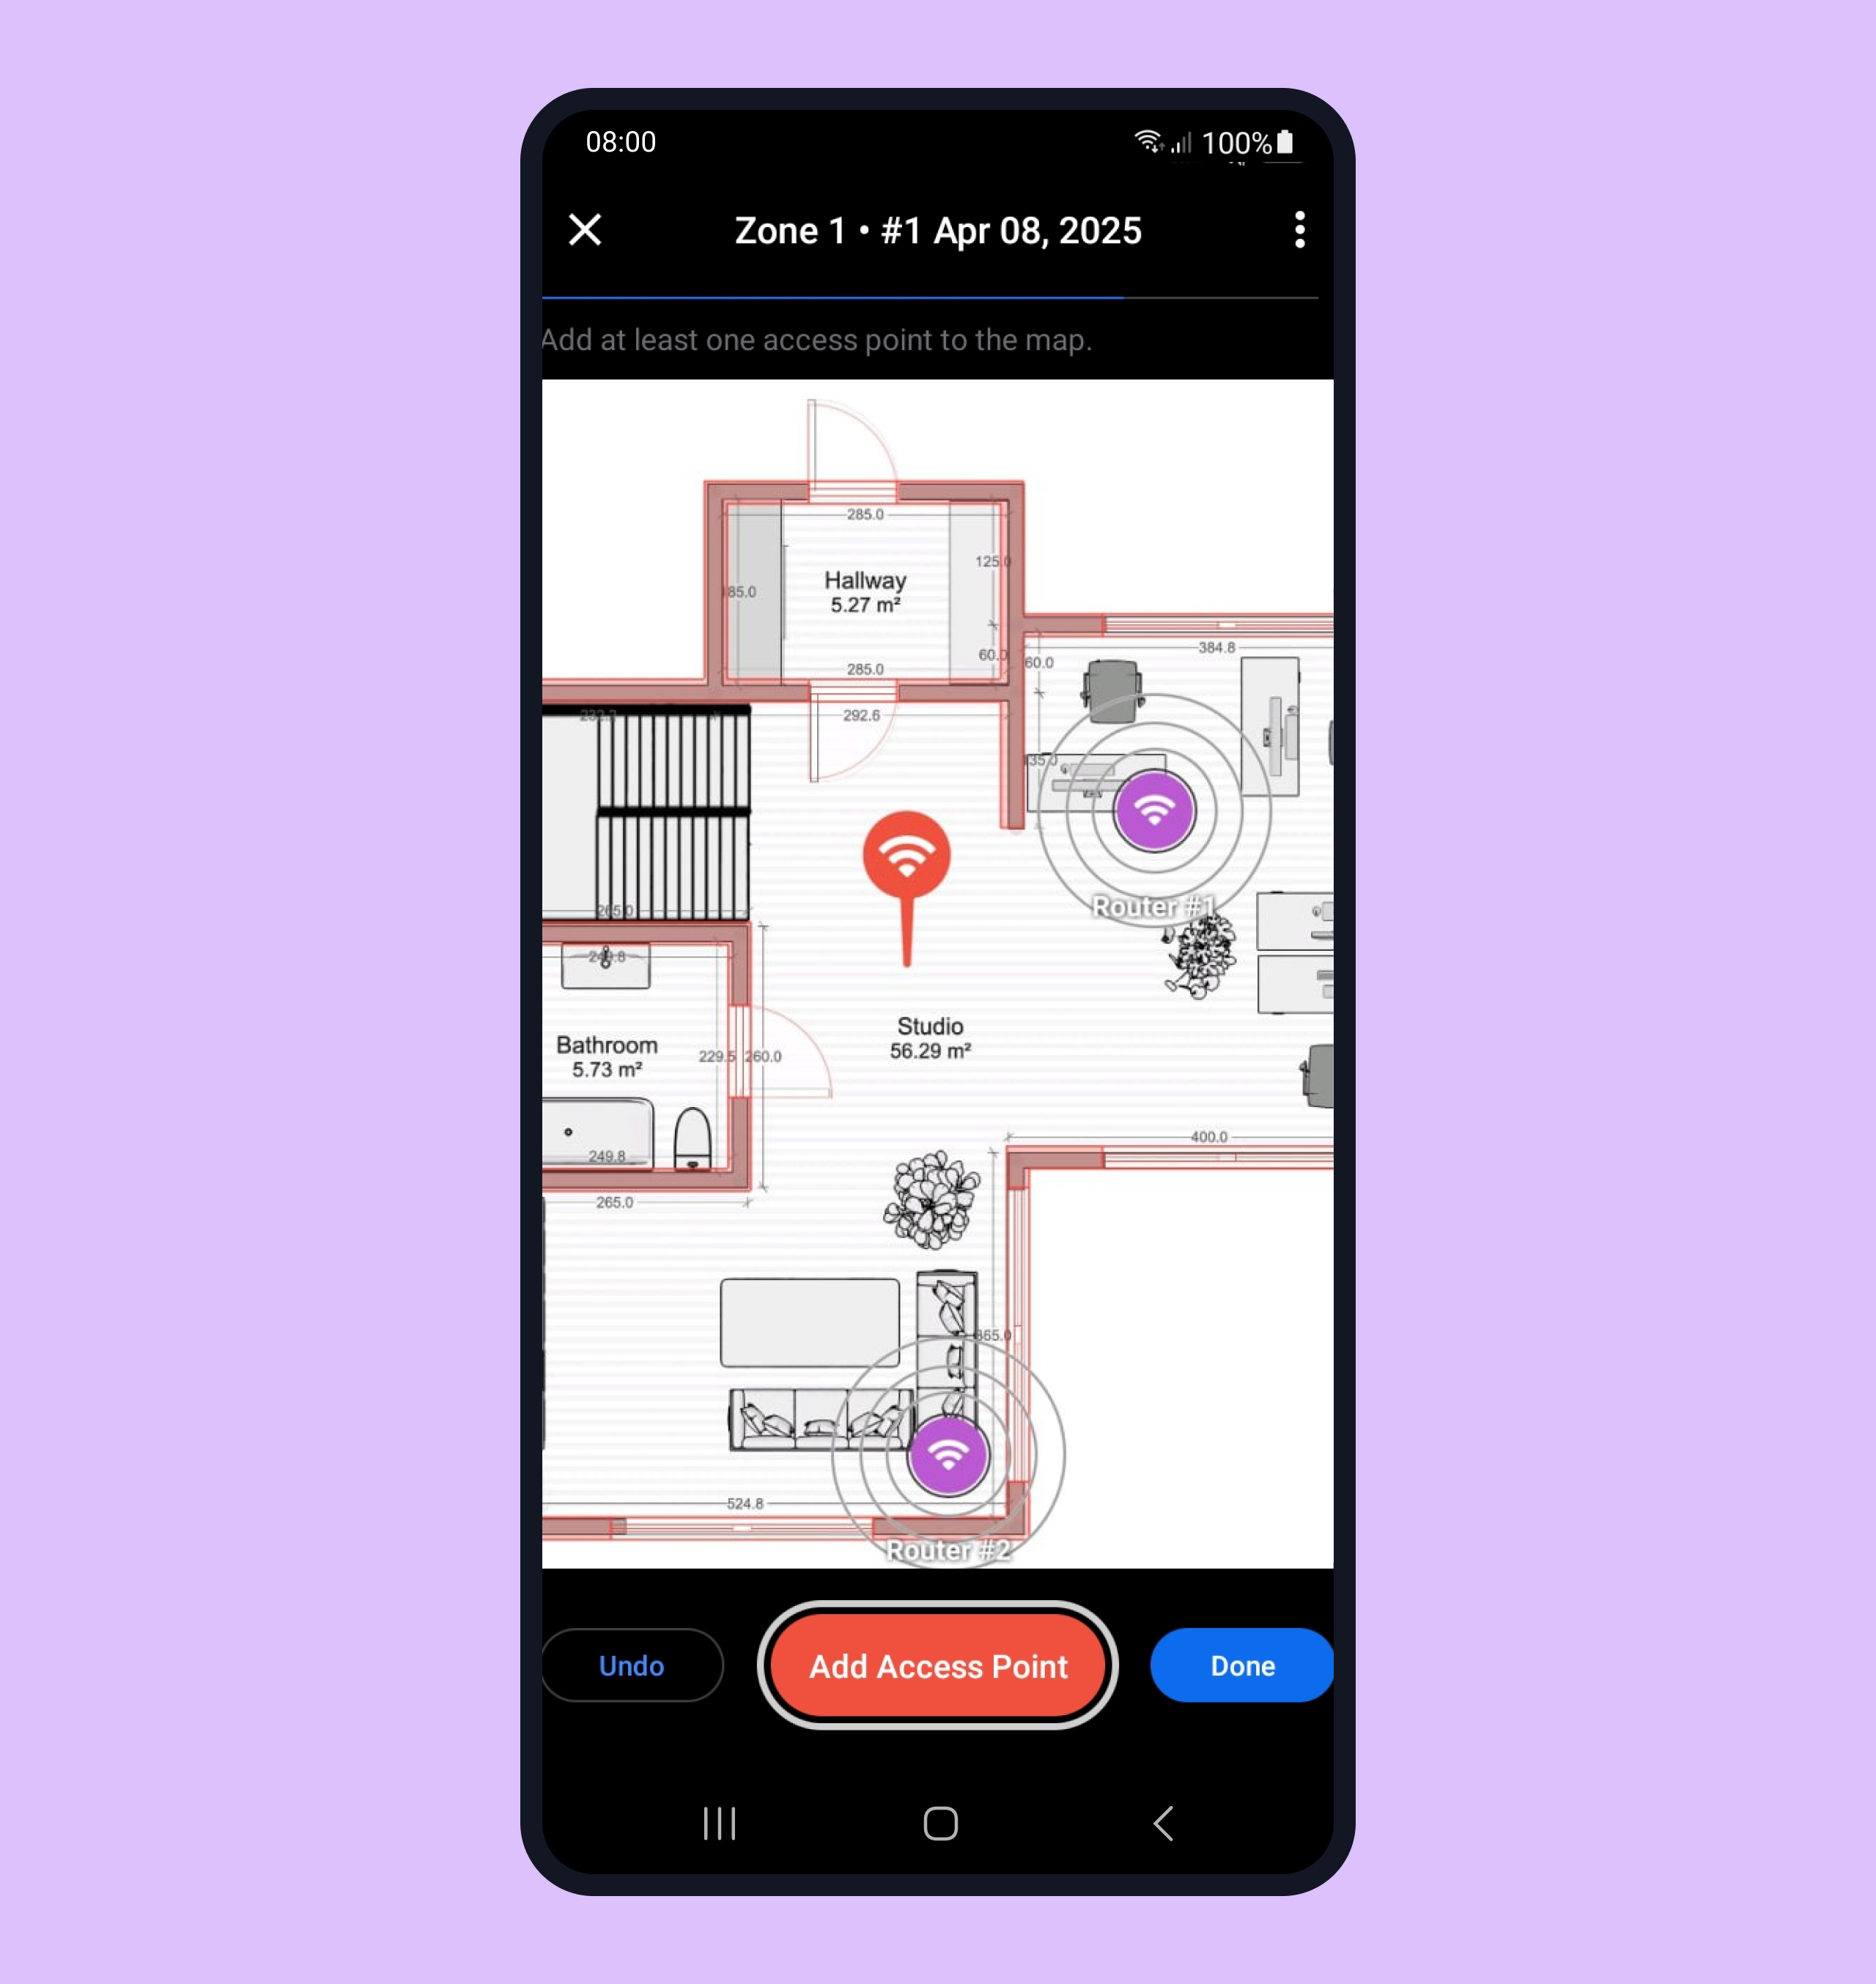
Step 6. Start taking measurements. Once you tap “Scan” you might need to wait for a little bit (it might take from 10 seconds to a couple of minutes). Please don’t move until you see the blue circle icon to ensure accuracy.
Note: A minimum of 3 (three) measurements in three different points is needed, however, the more measurements you take the more precise picture you get.
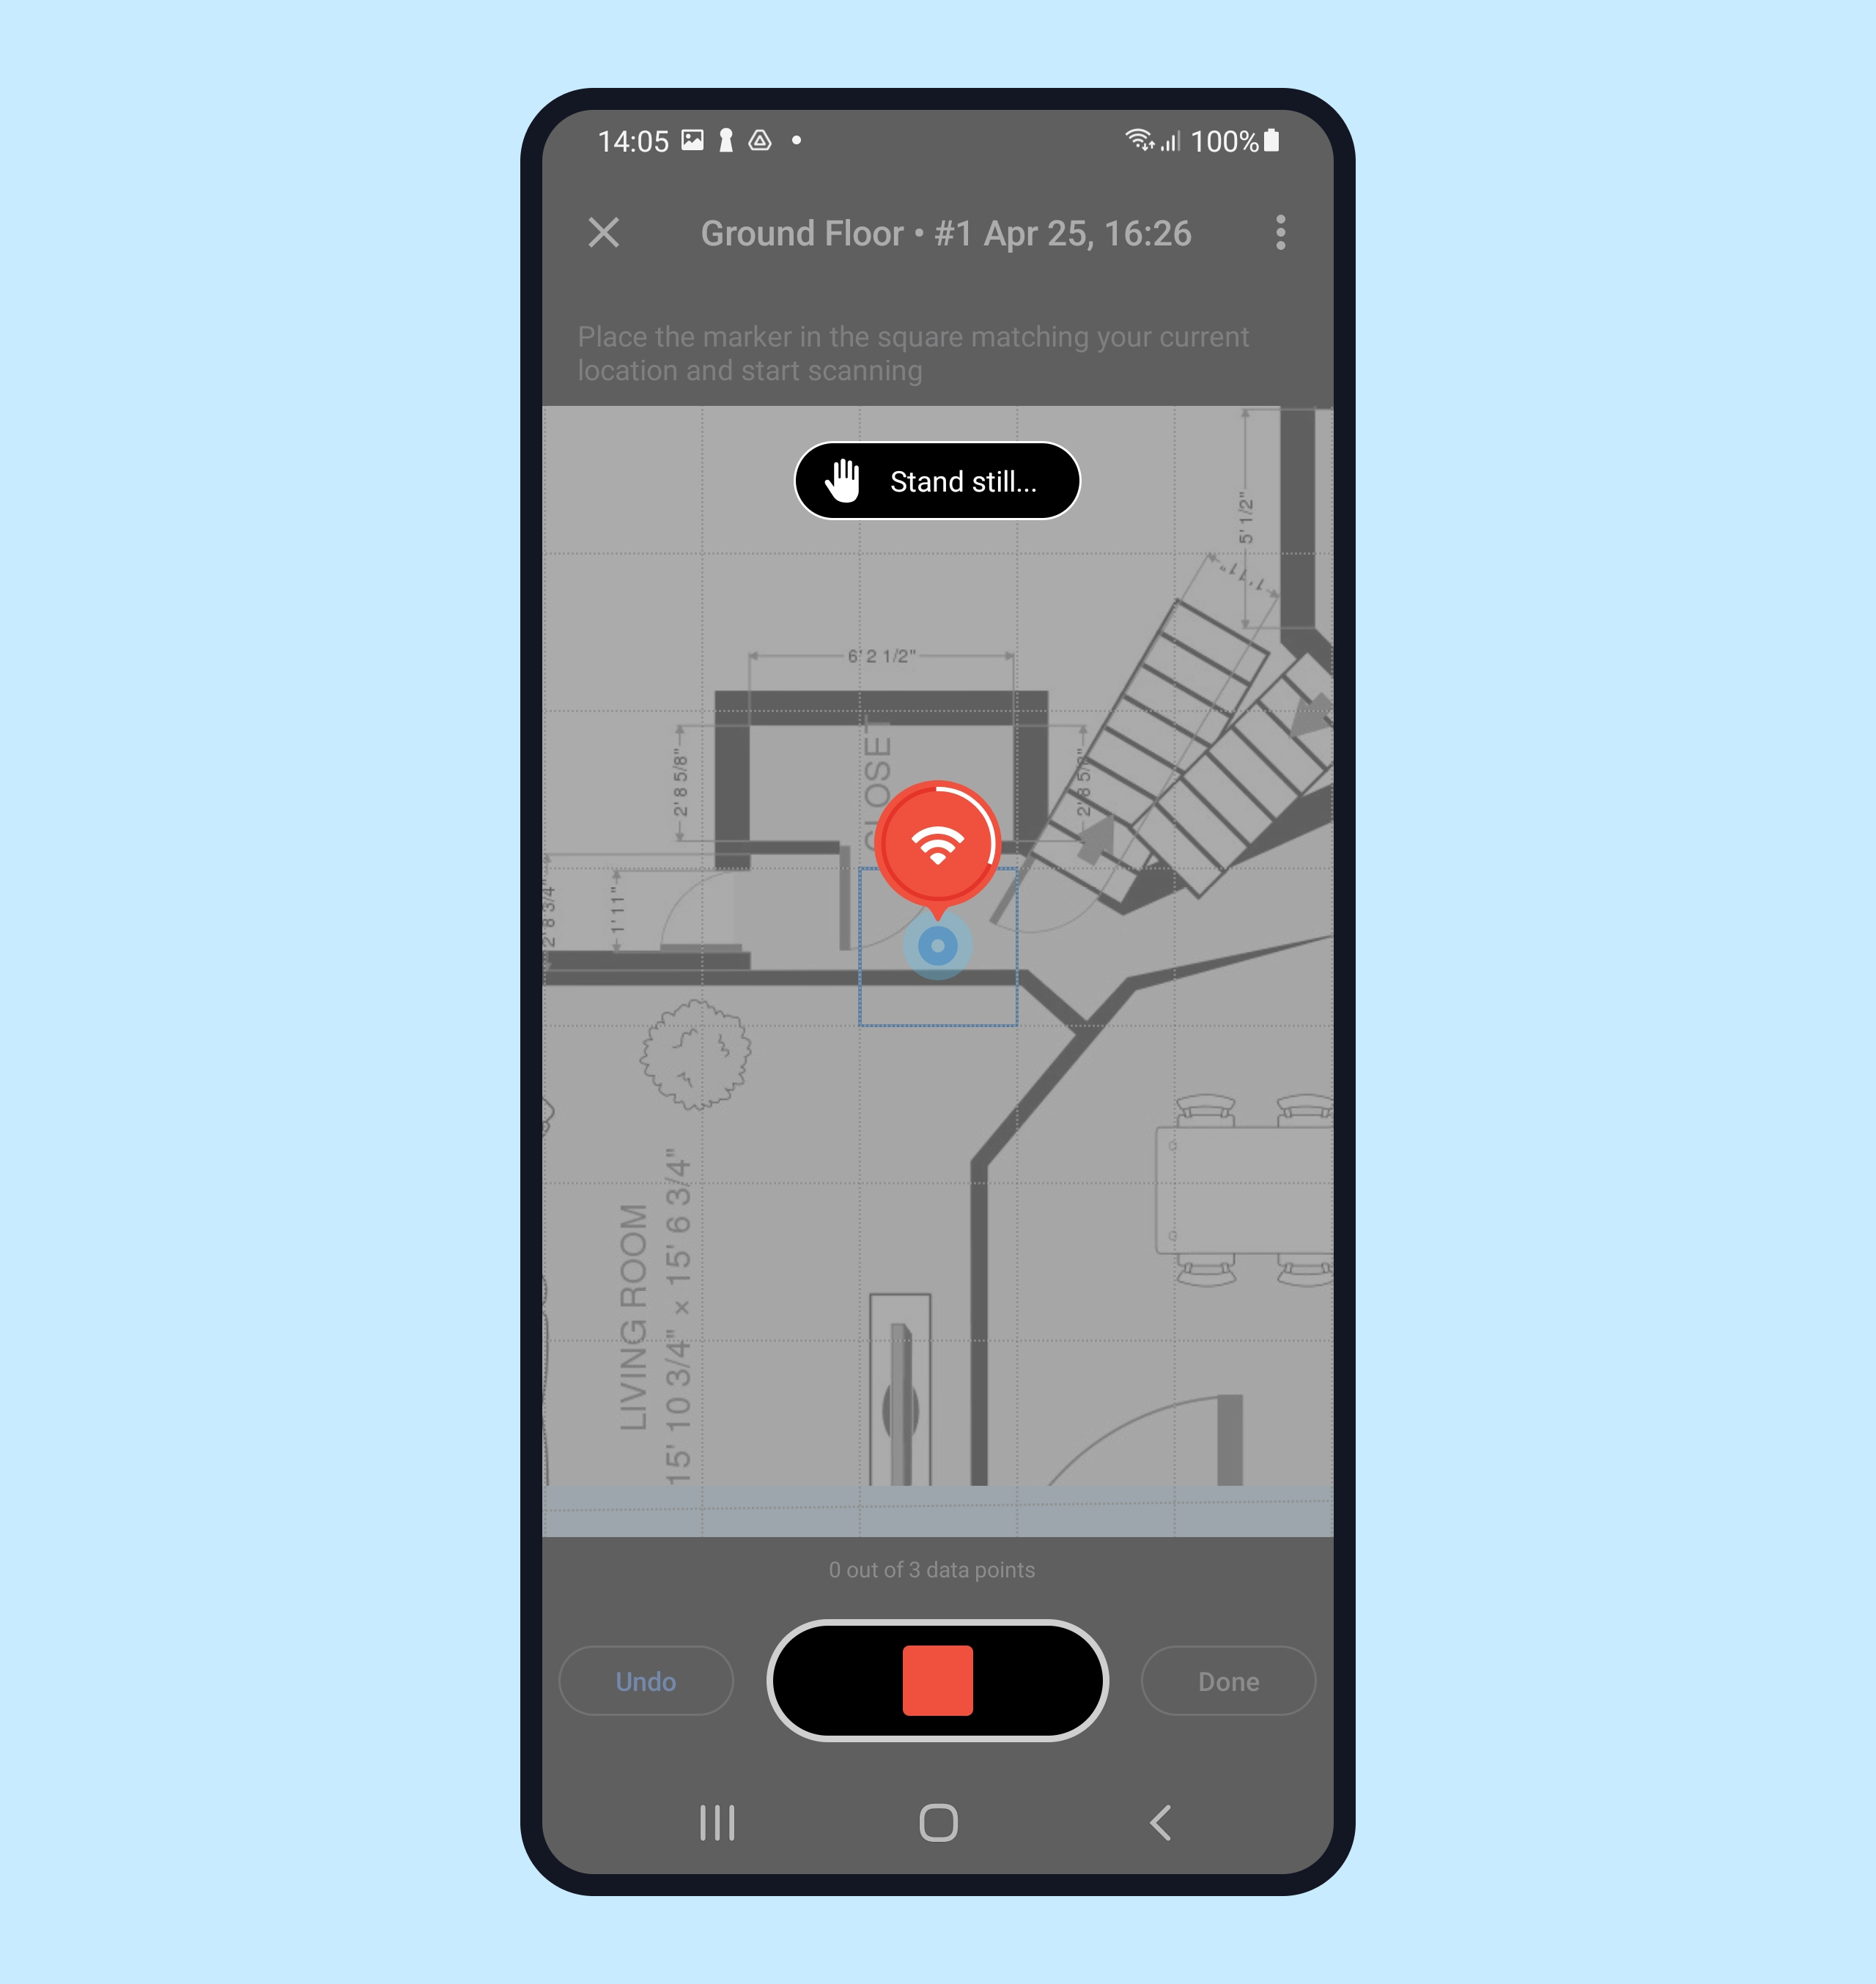
Step 7. Proceed with taking measurements covering the map densely as you go. Take the measurements in each square of the map for a more precise result.
Note that if you don’t need to survey the whole map at this time, you can only cover a certain zone.
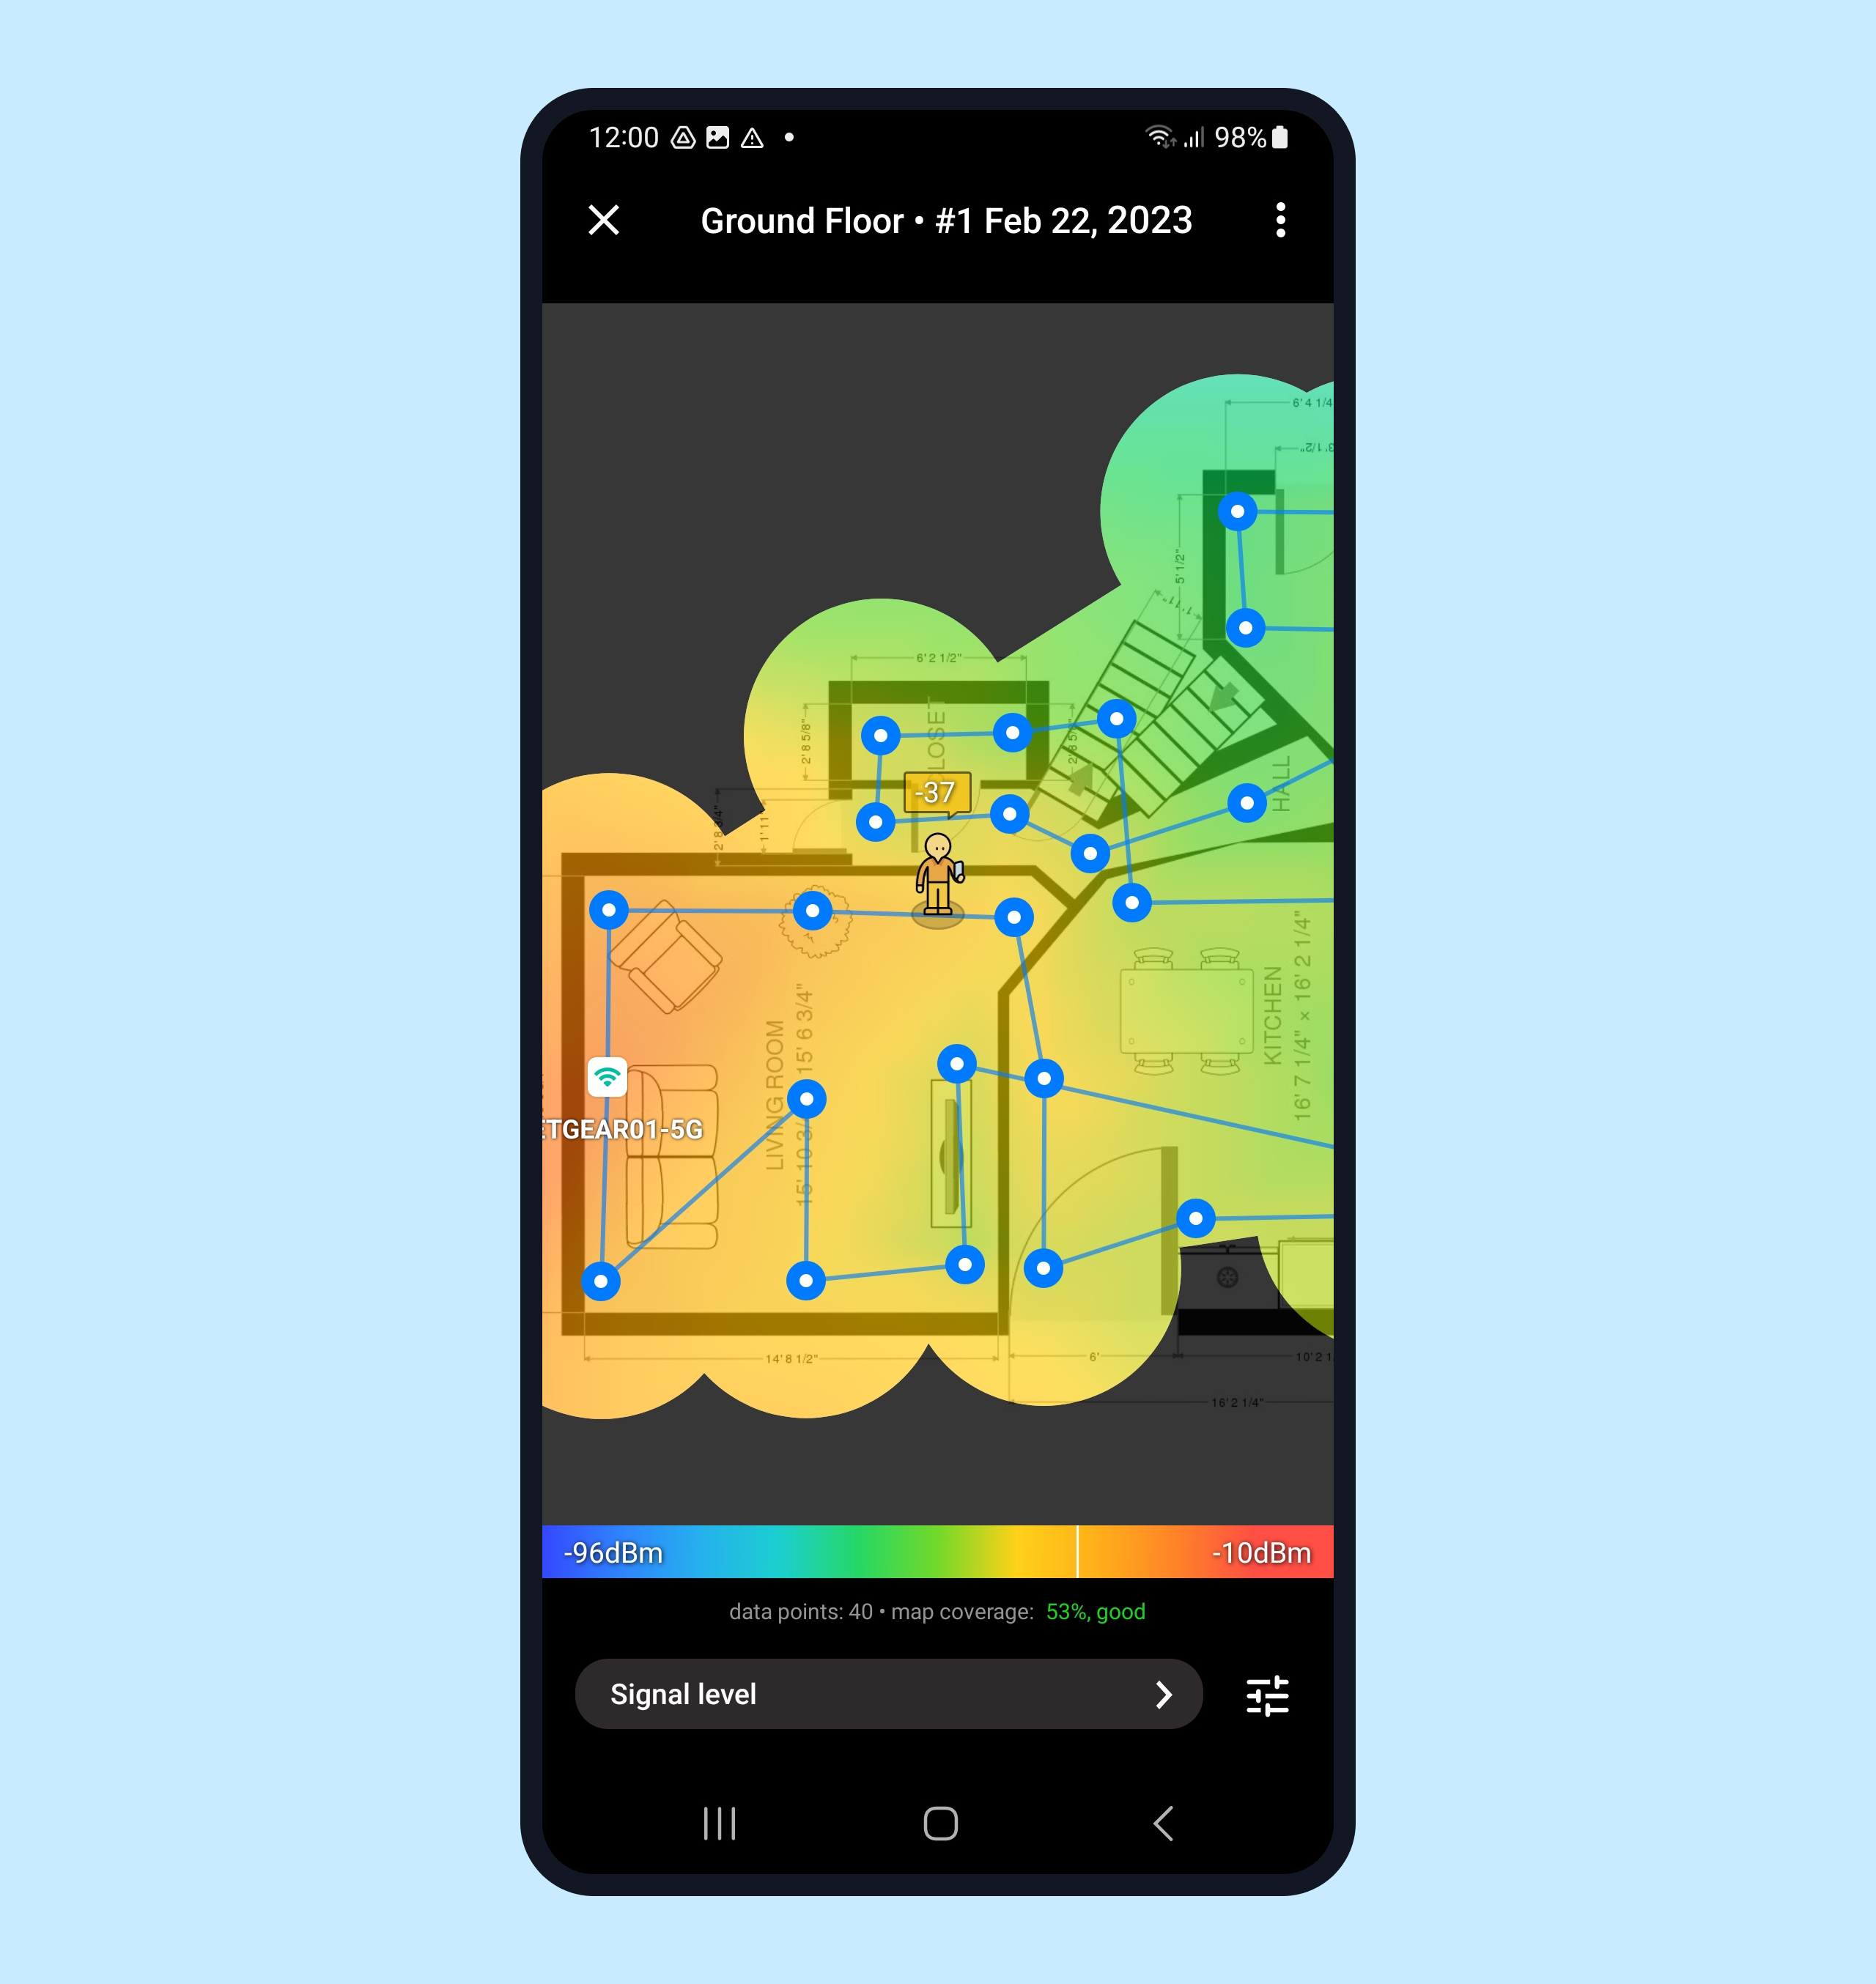
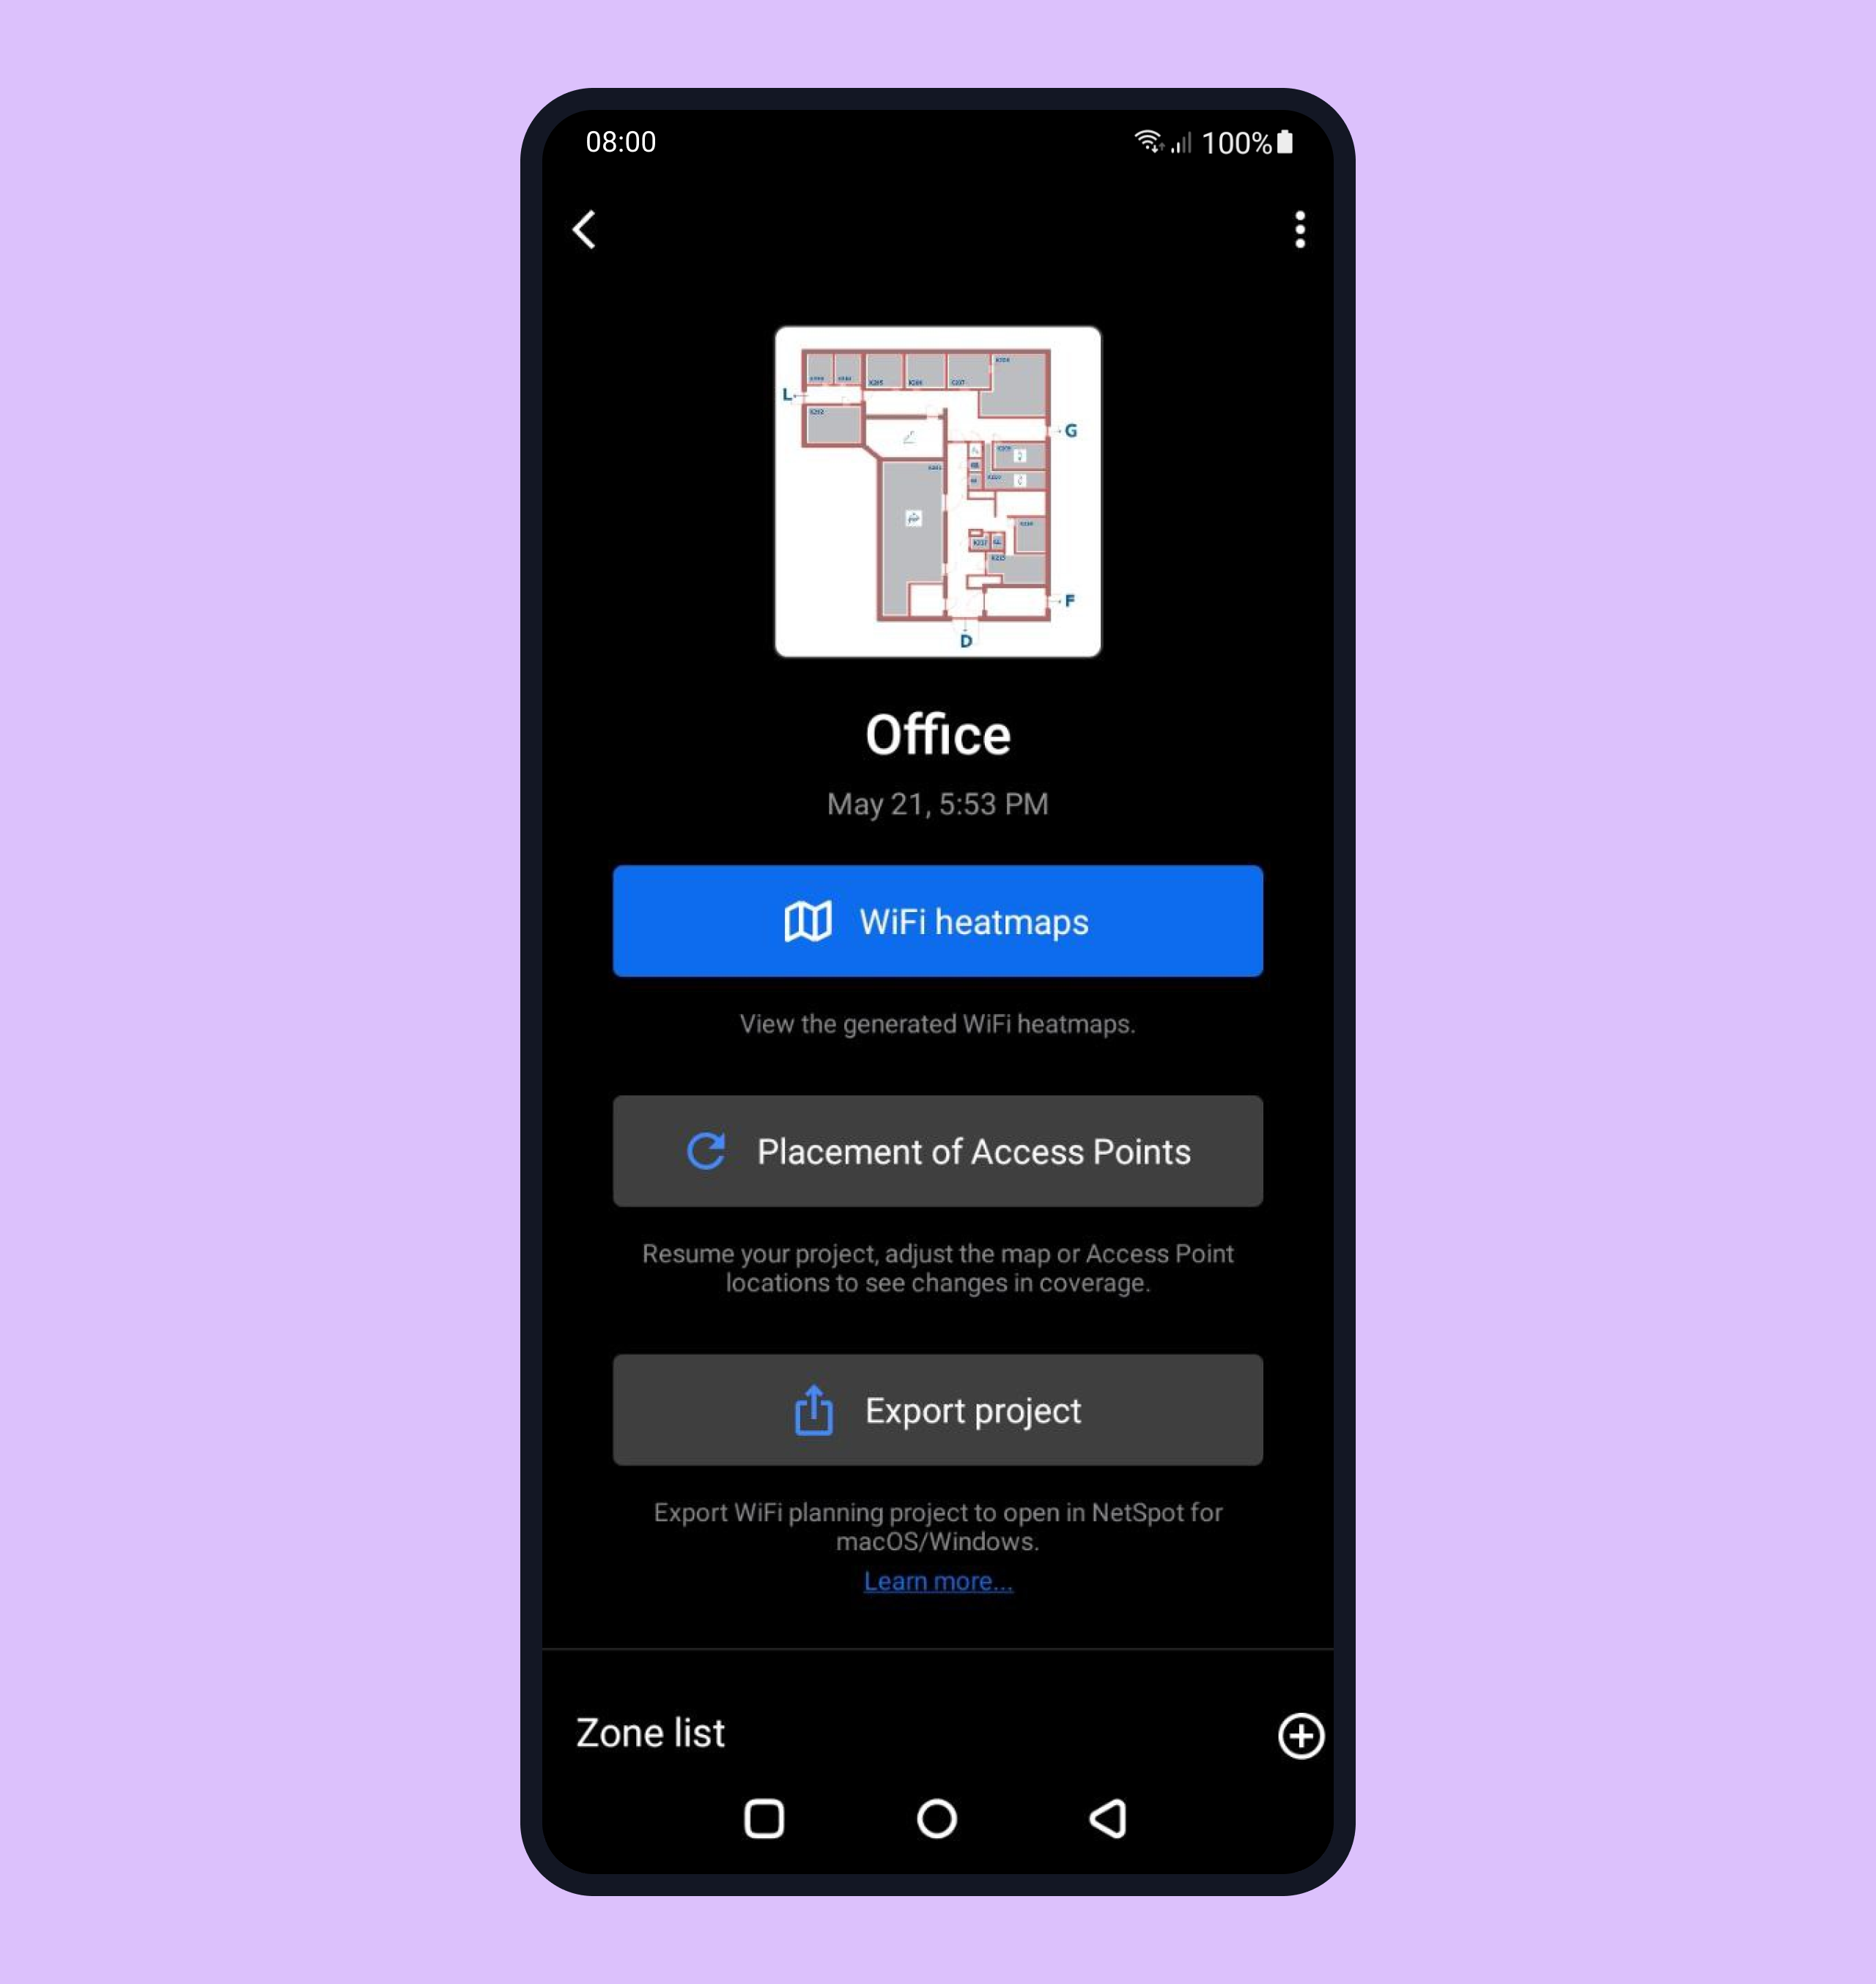
Step 8. Whenever you feel ready to analyze the collected data, tap the blue “Done” button that will appear next to “Scan” after the first three measurements were taken. You can now either build WiFi heatmaps on your Android device (three major types are available via a single in-app purchase) or export the project to open it in NetSpot for Windows or Mac and generate interactive visual heatmaps there.
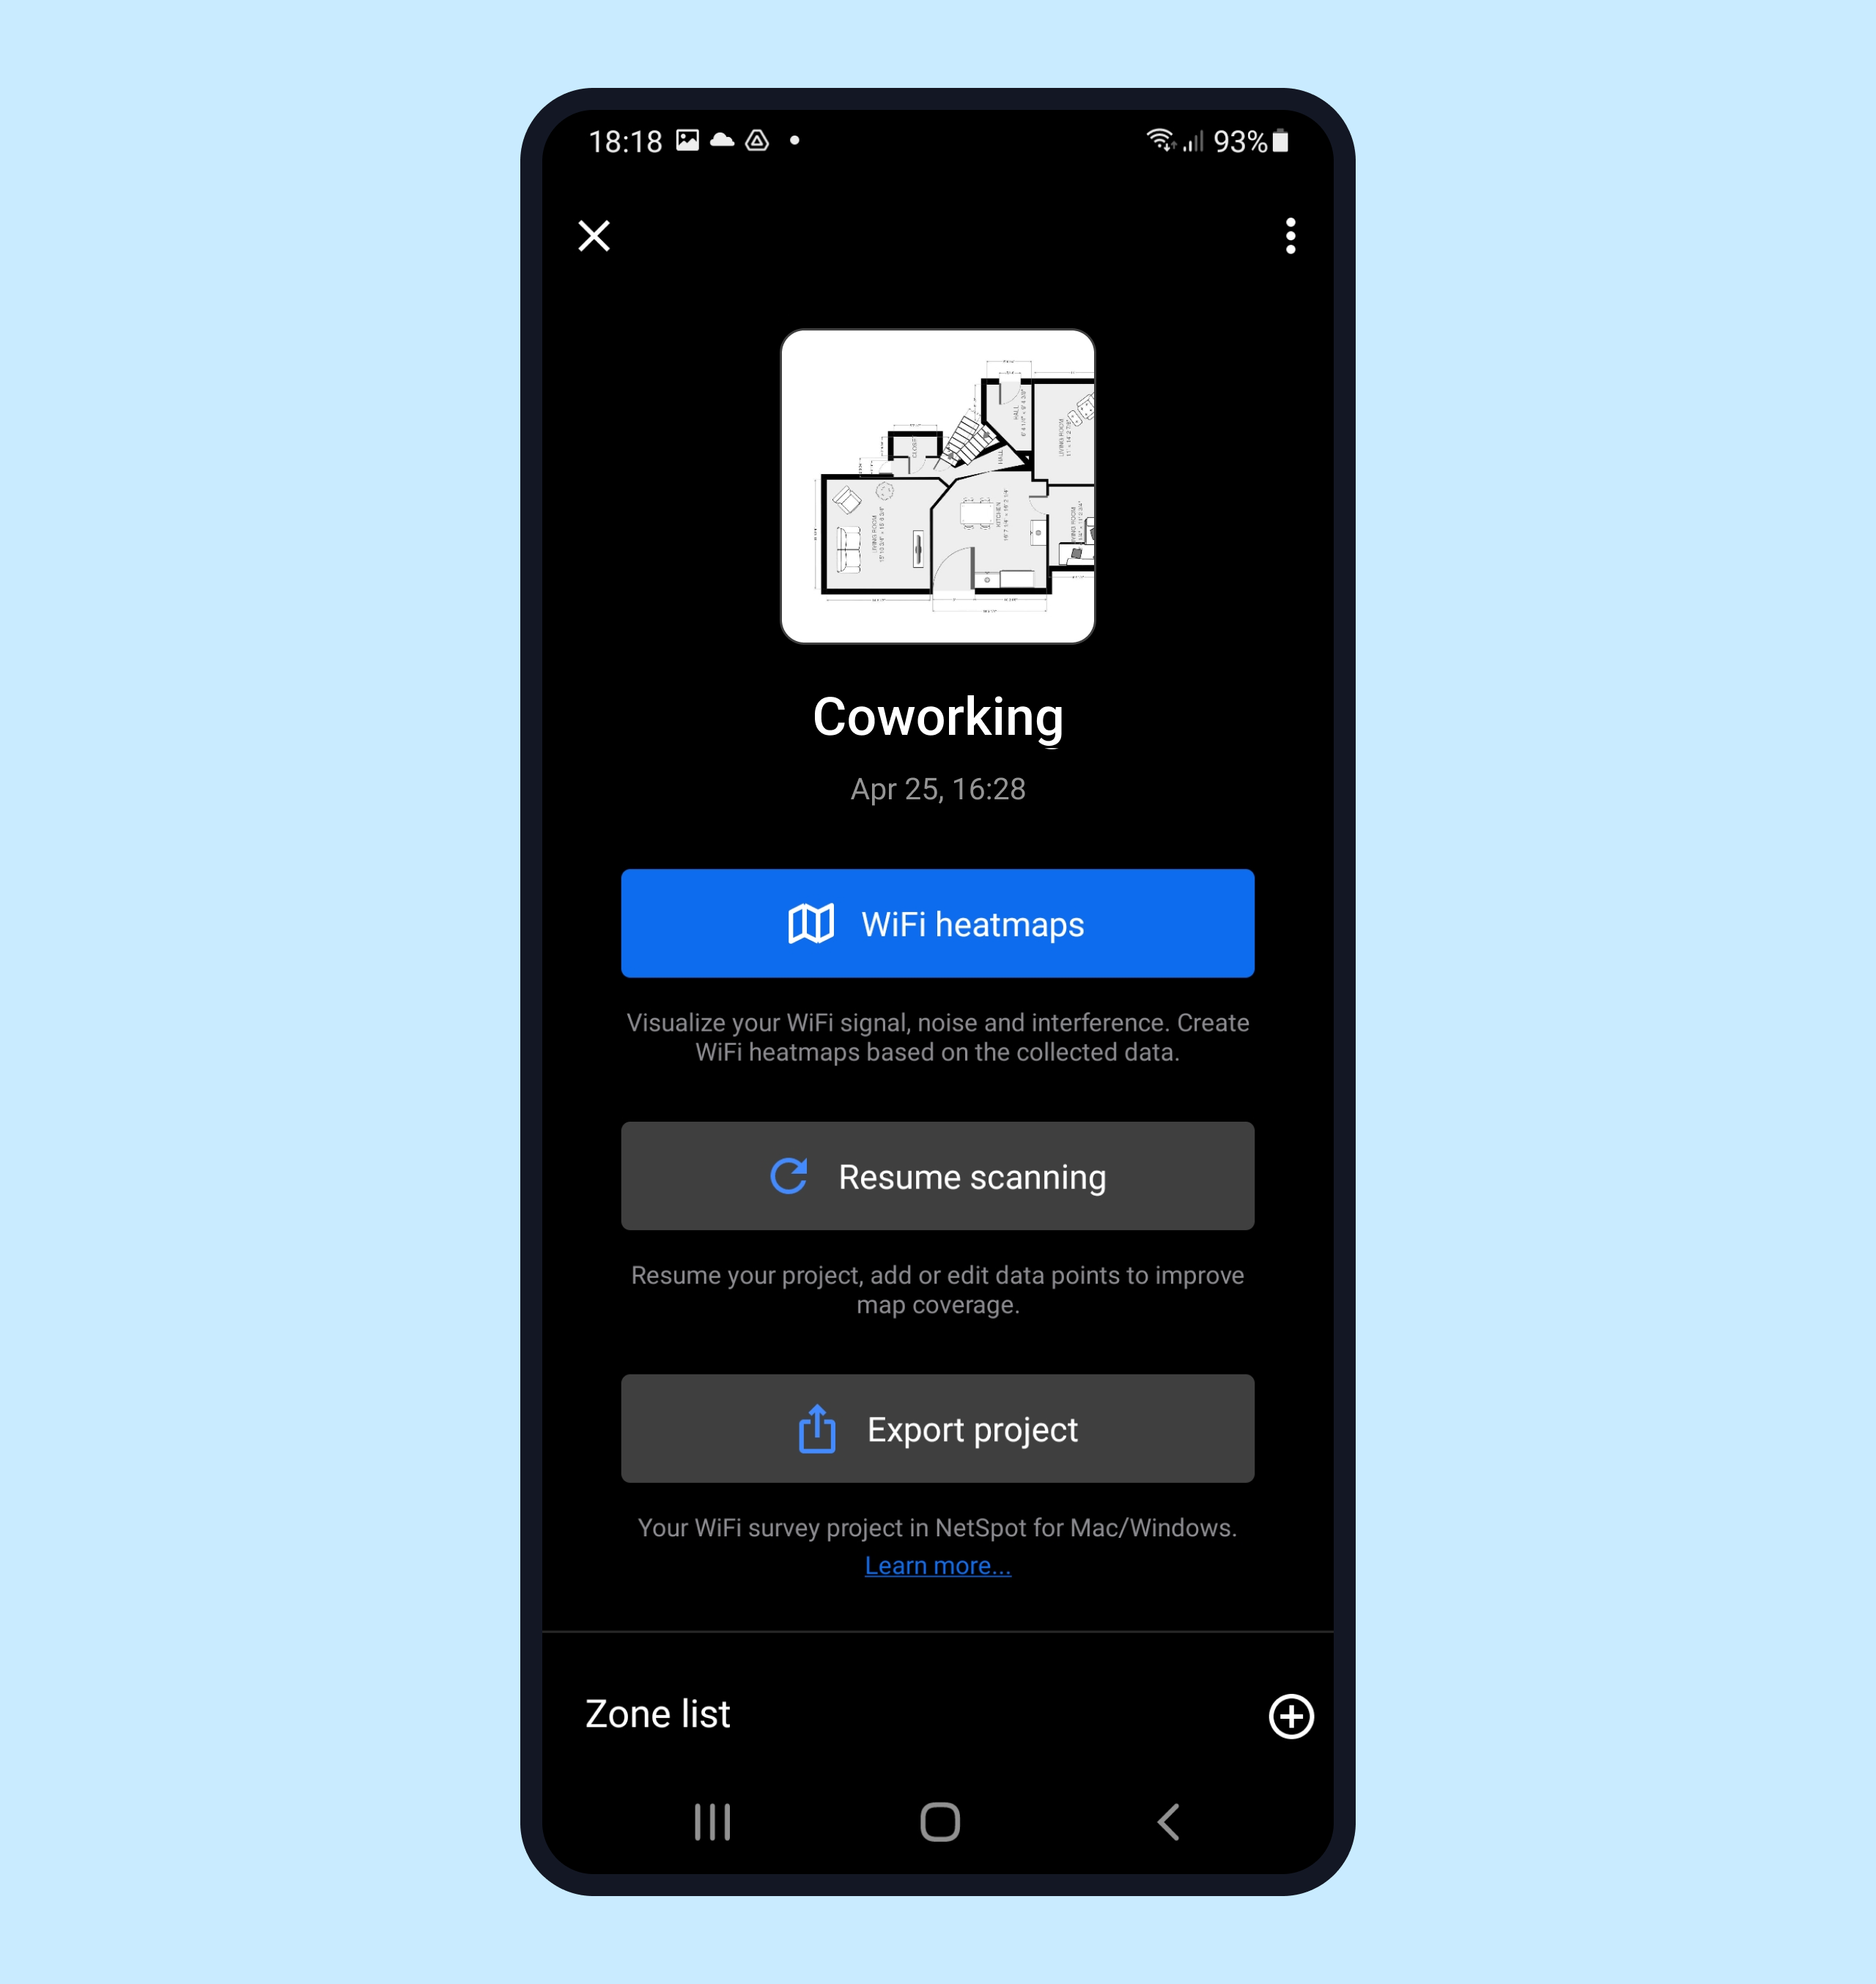
Step 9. To generate Signal level, Signal-to-interference ratio, or Signal-to-noise ratio heatmap on your Android device, tap “WiFi heatmaps” and allow some time for processing.
Step 10. To build Wi-Fi heatmaps in NetSpot for Windows or macOS, export the project on Android and then import it in NetSpot Home, PRO, or Enterprise.
Tip: NetSpot Home, PRO, or Enterprise can be purchased here if you don’t have a license yet.
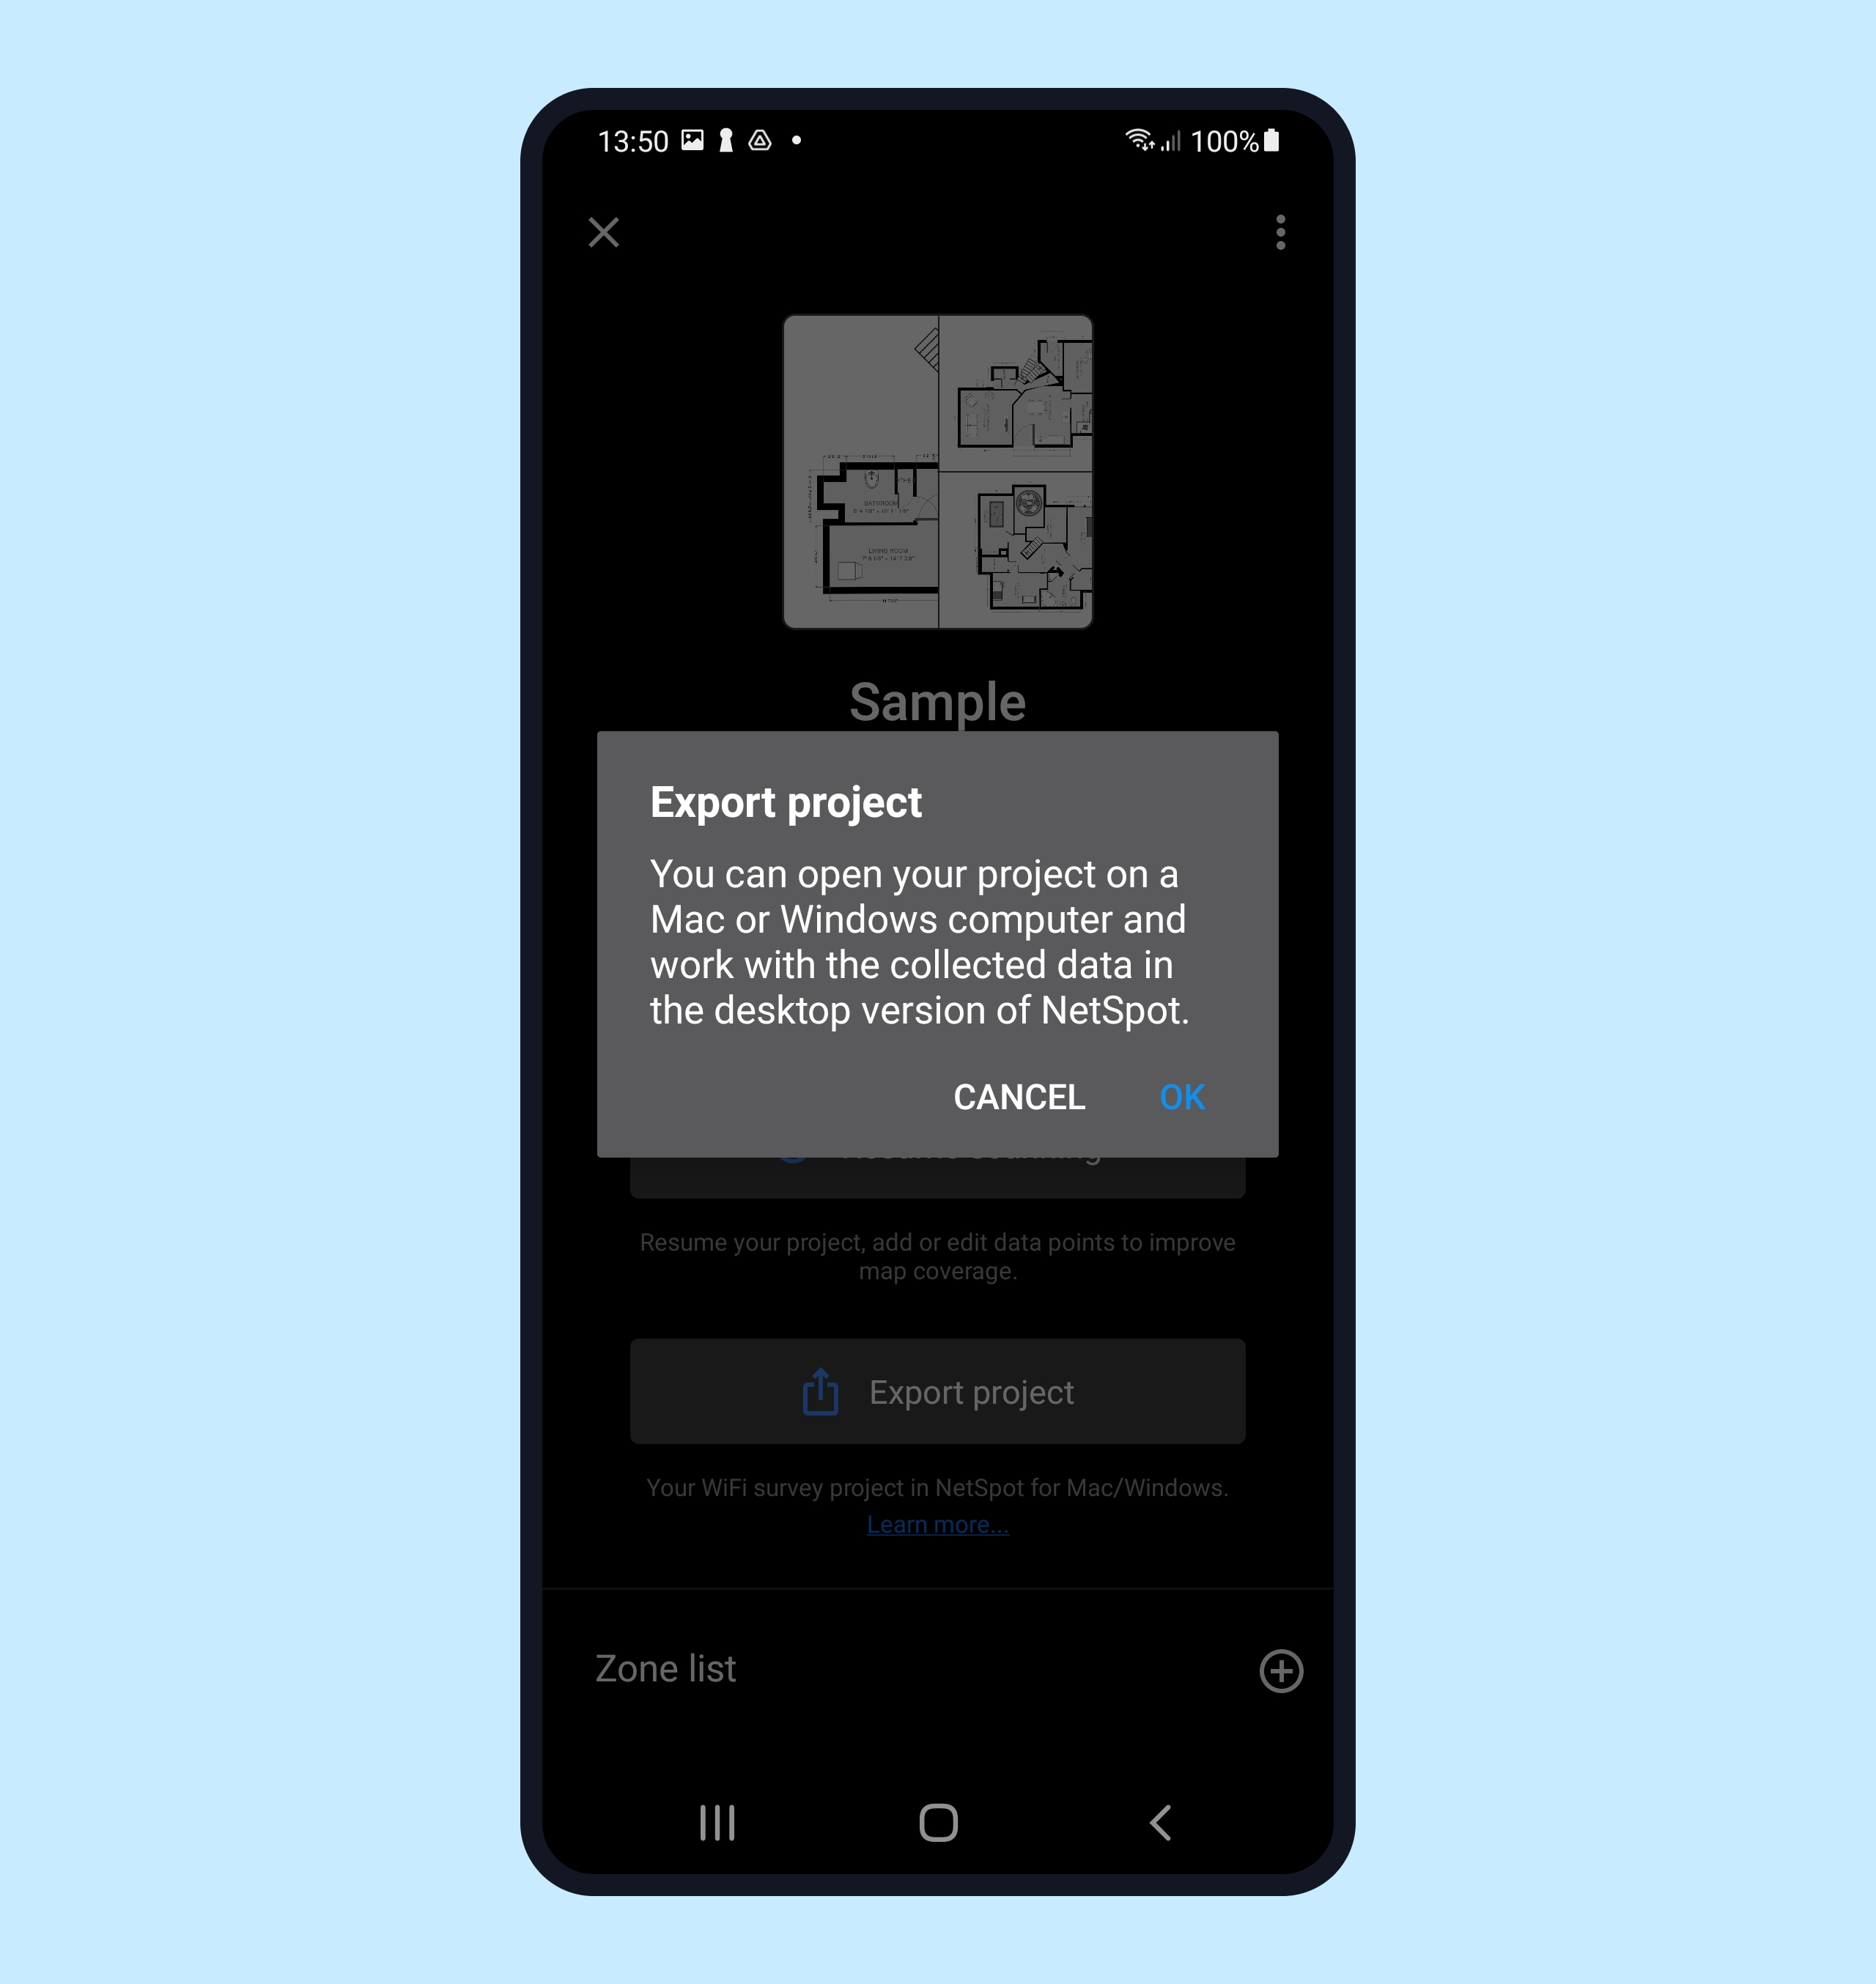
Step 11. Open the NetSpot app on your desktop or laptop, switch to Survey mode, then tap the “Open a saved project” button to load and work with your survey project built on an Android device.
Performing a predictive survey
NetSpot is a perfect tool for planning an entirely new wireless network in a new space when there is no previous estimate yet available on how many hotspots this network might require.
Step 1. Create a new project by tapping the + button.
Step 2. Select the Planning option.
Step 3. Load a file with the map of your surveyed area from your photo library, take a photo or start with a blank canvas.
Step 4. Name your project and add description if required.
Step 5. In case you are creating a layout, you’ll set the canvas size before clicking Select. In case of an uploaded file, you’ll need to calibrate your map for correct scaling after clicking Select. To calibrate the map, use a known real distance between any two points for the most accurate measurements.
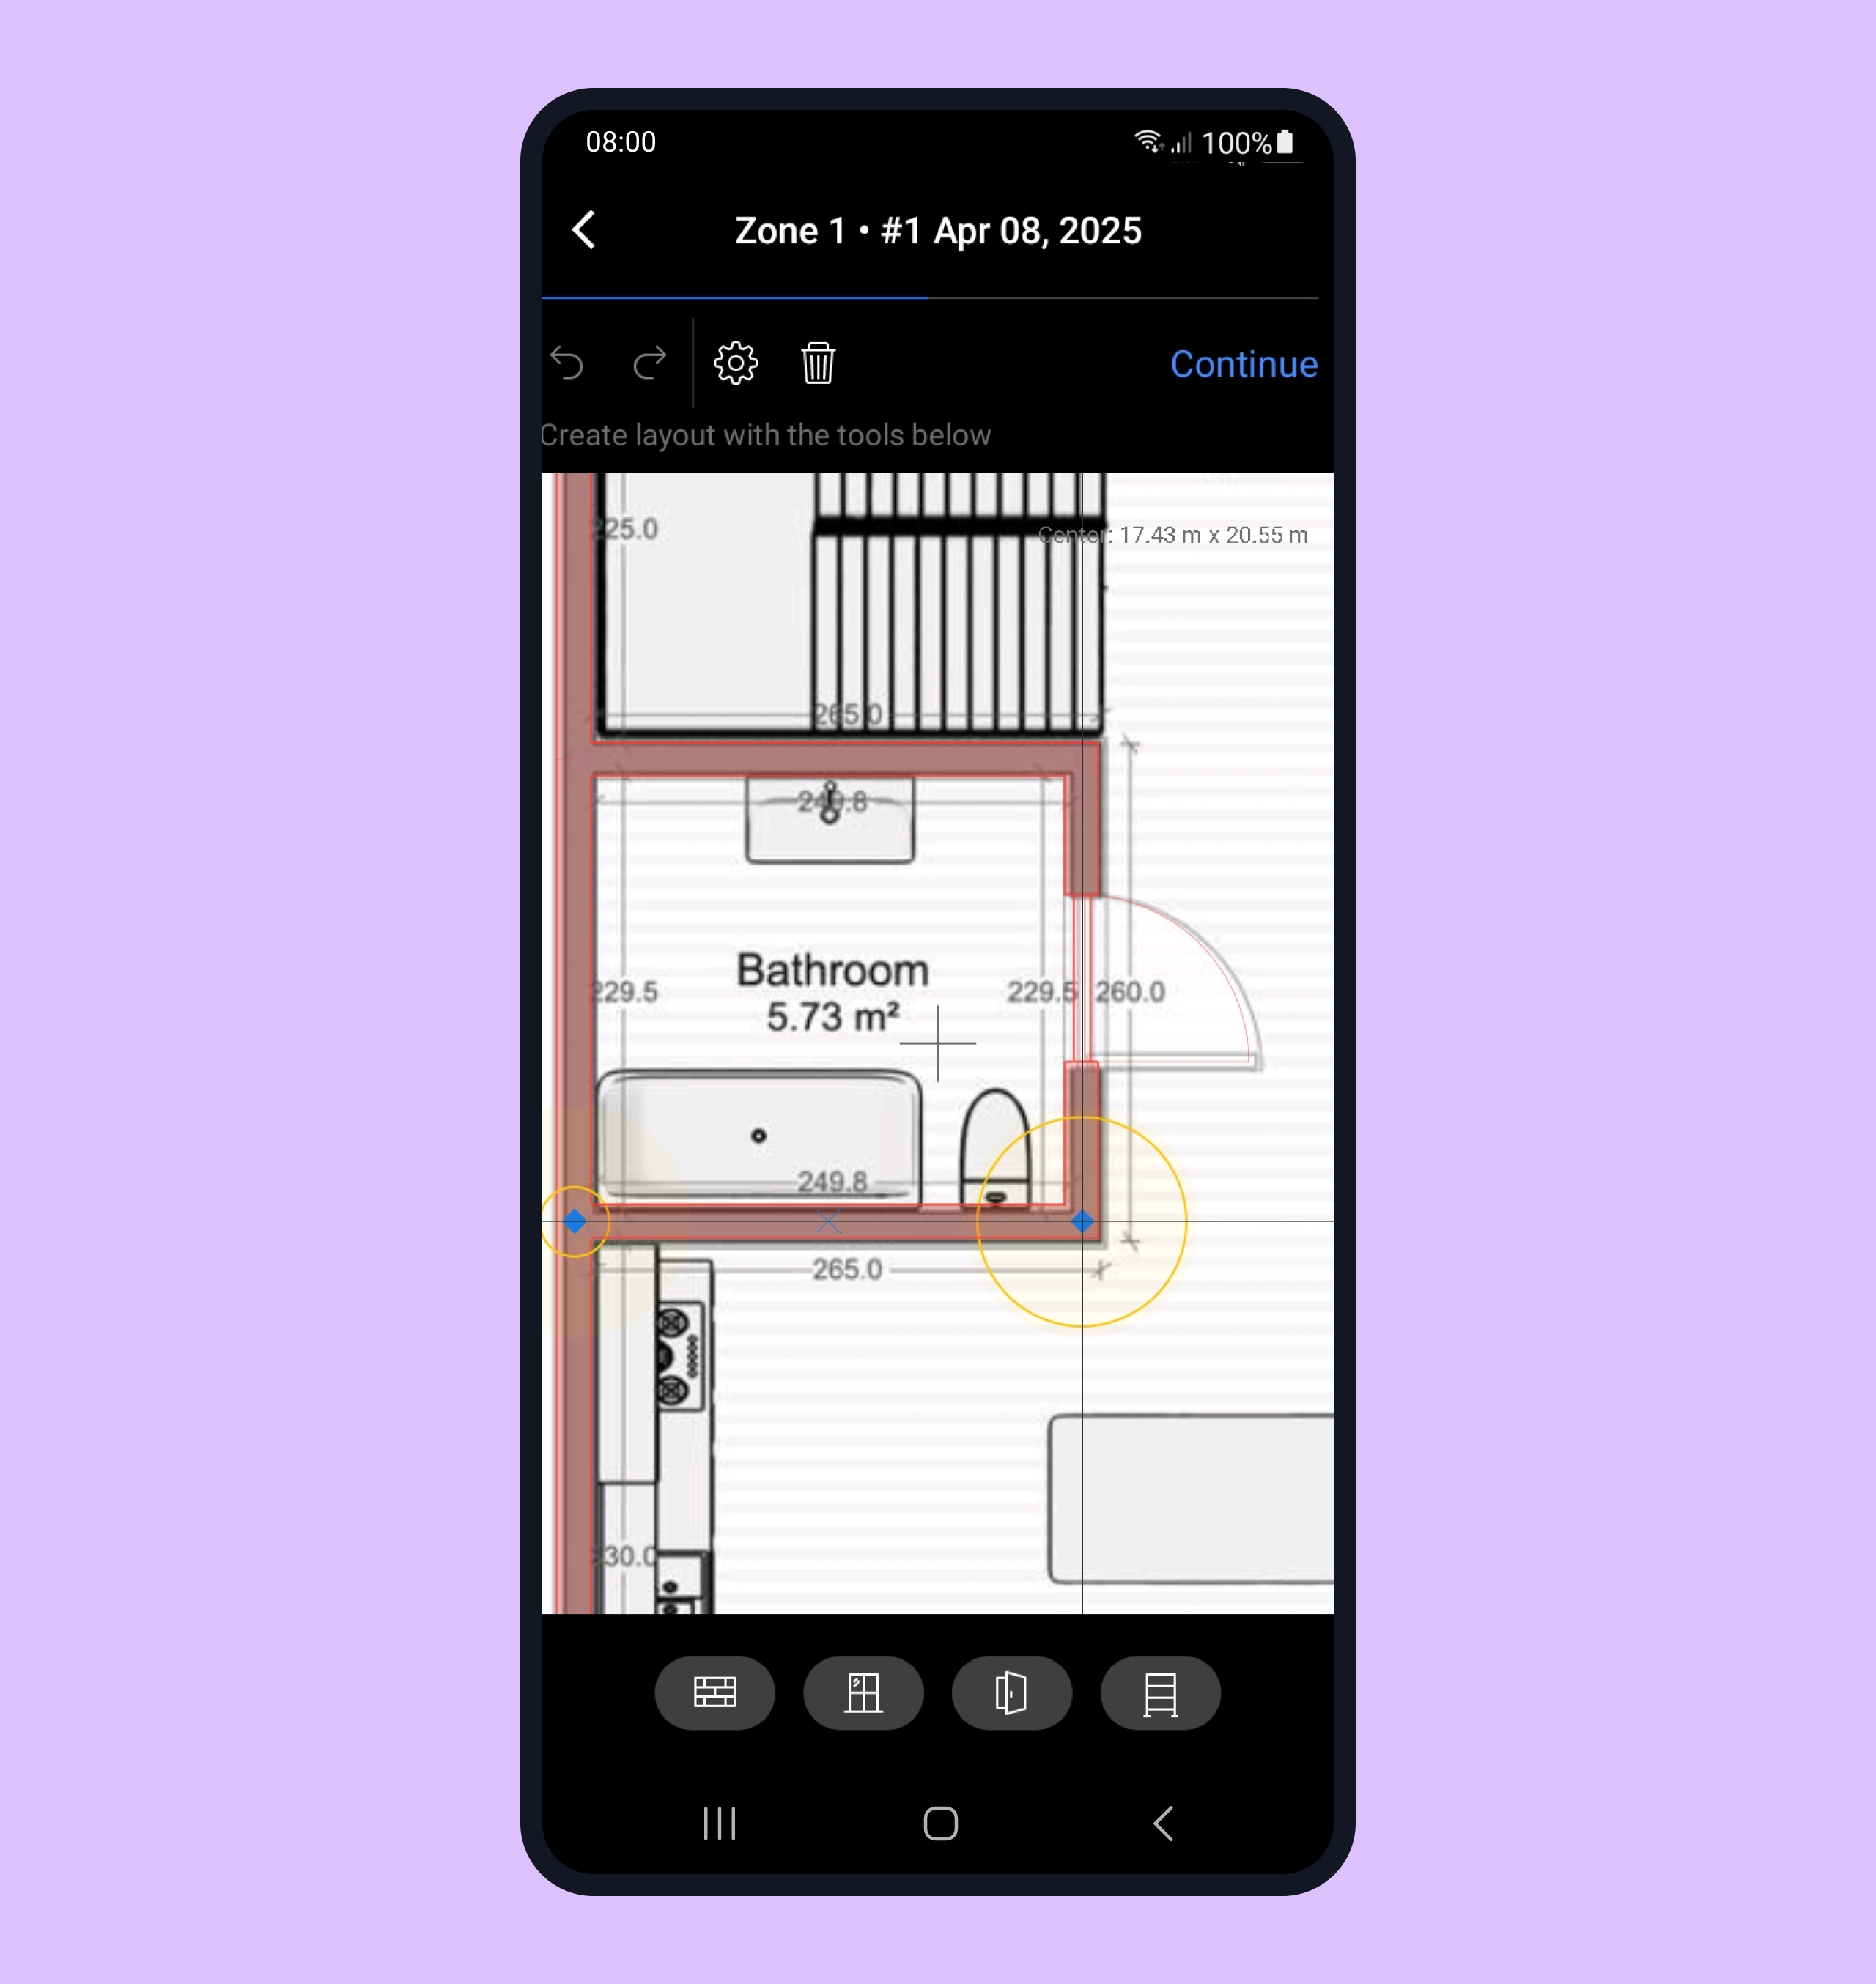
Step 6. Once done calibrating, it is time to “build” your space using the toolset in the bottom menu — doors, windows, walls, and racks. These are important, because they have a direct effect on wireless signal distribution.
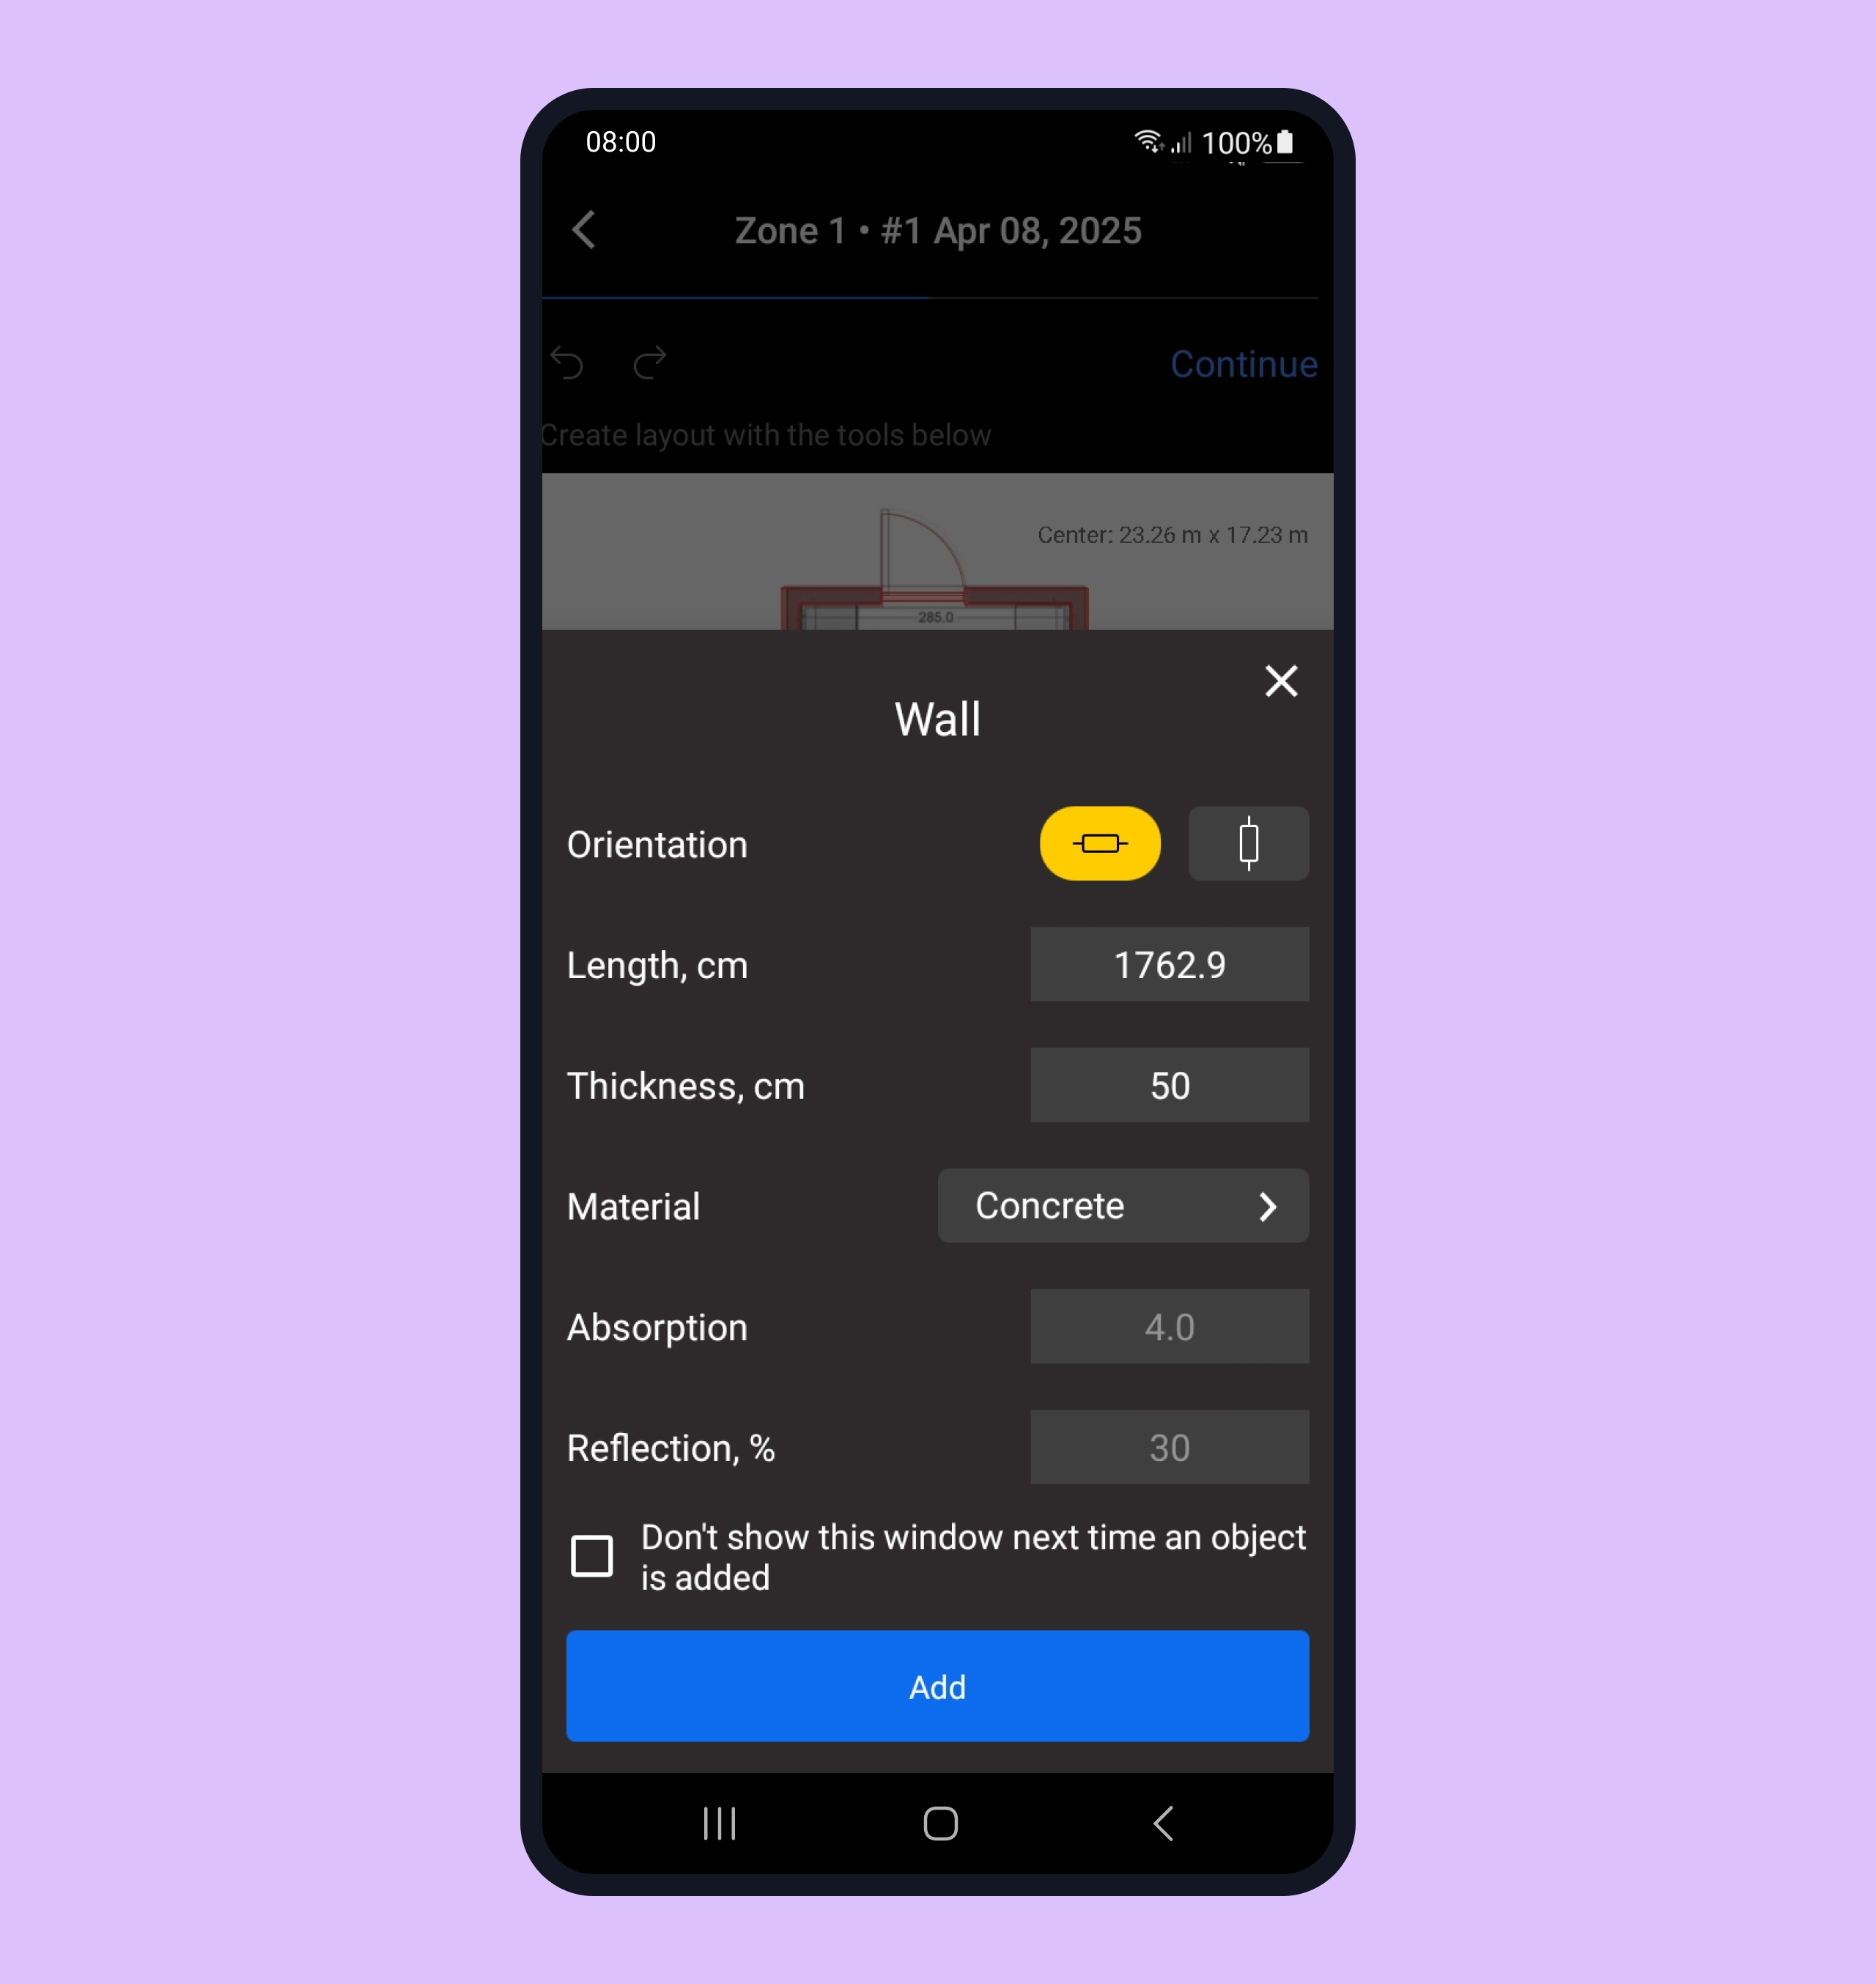
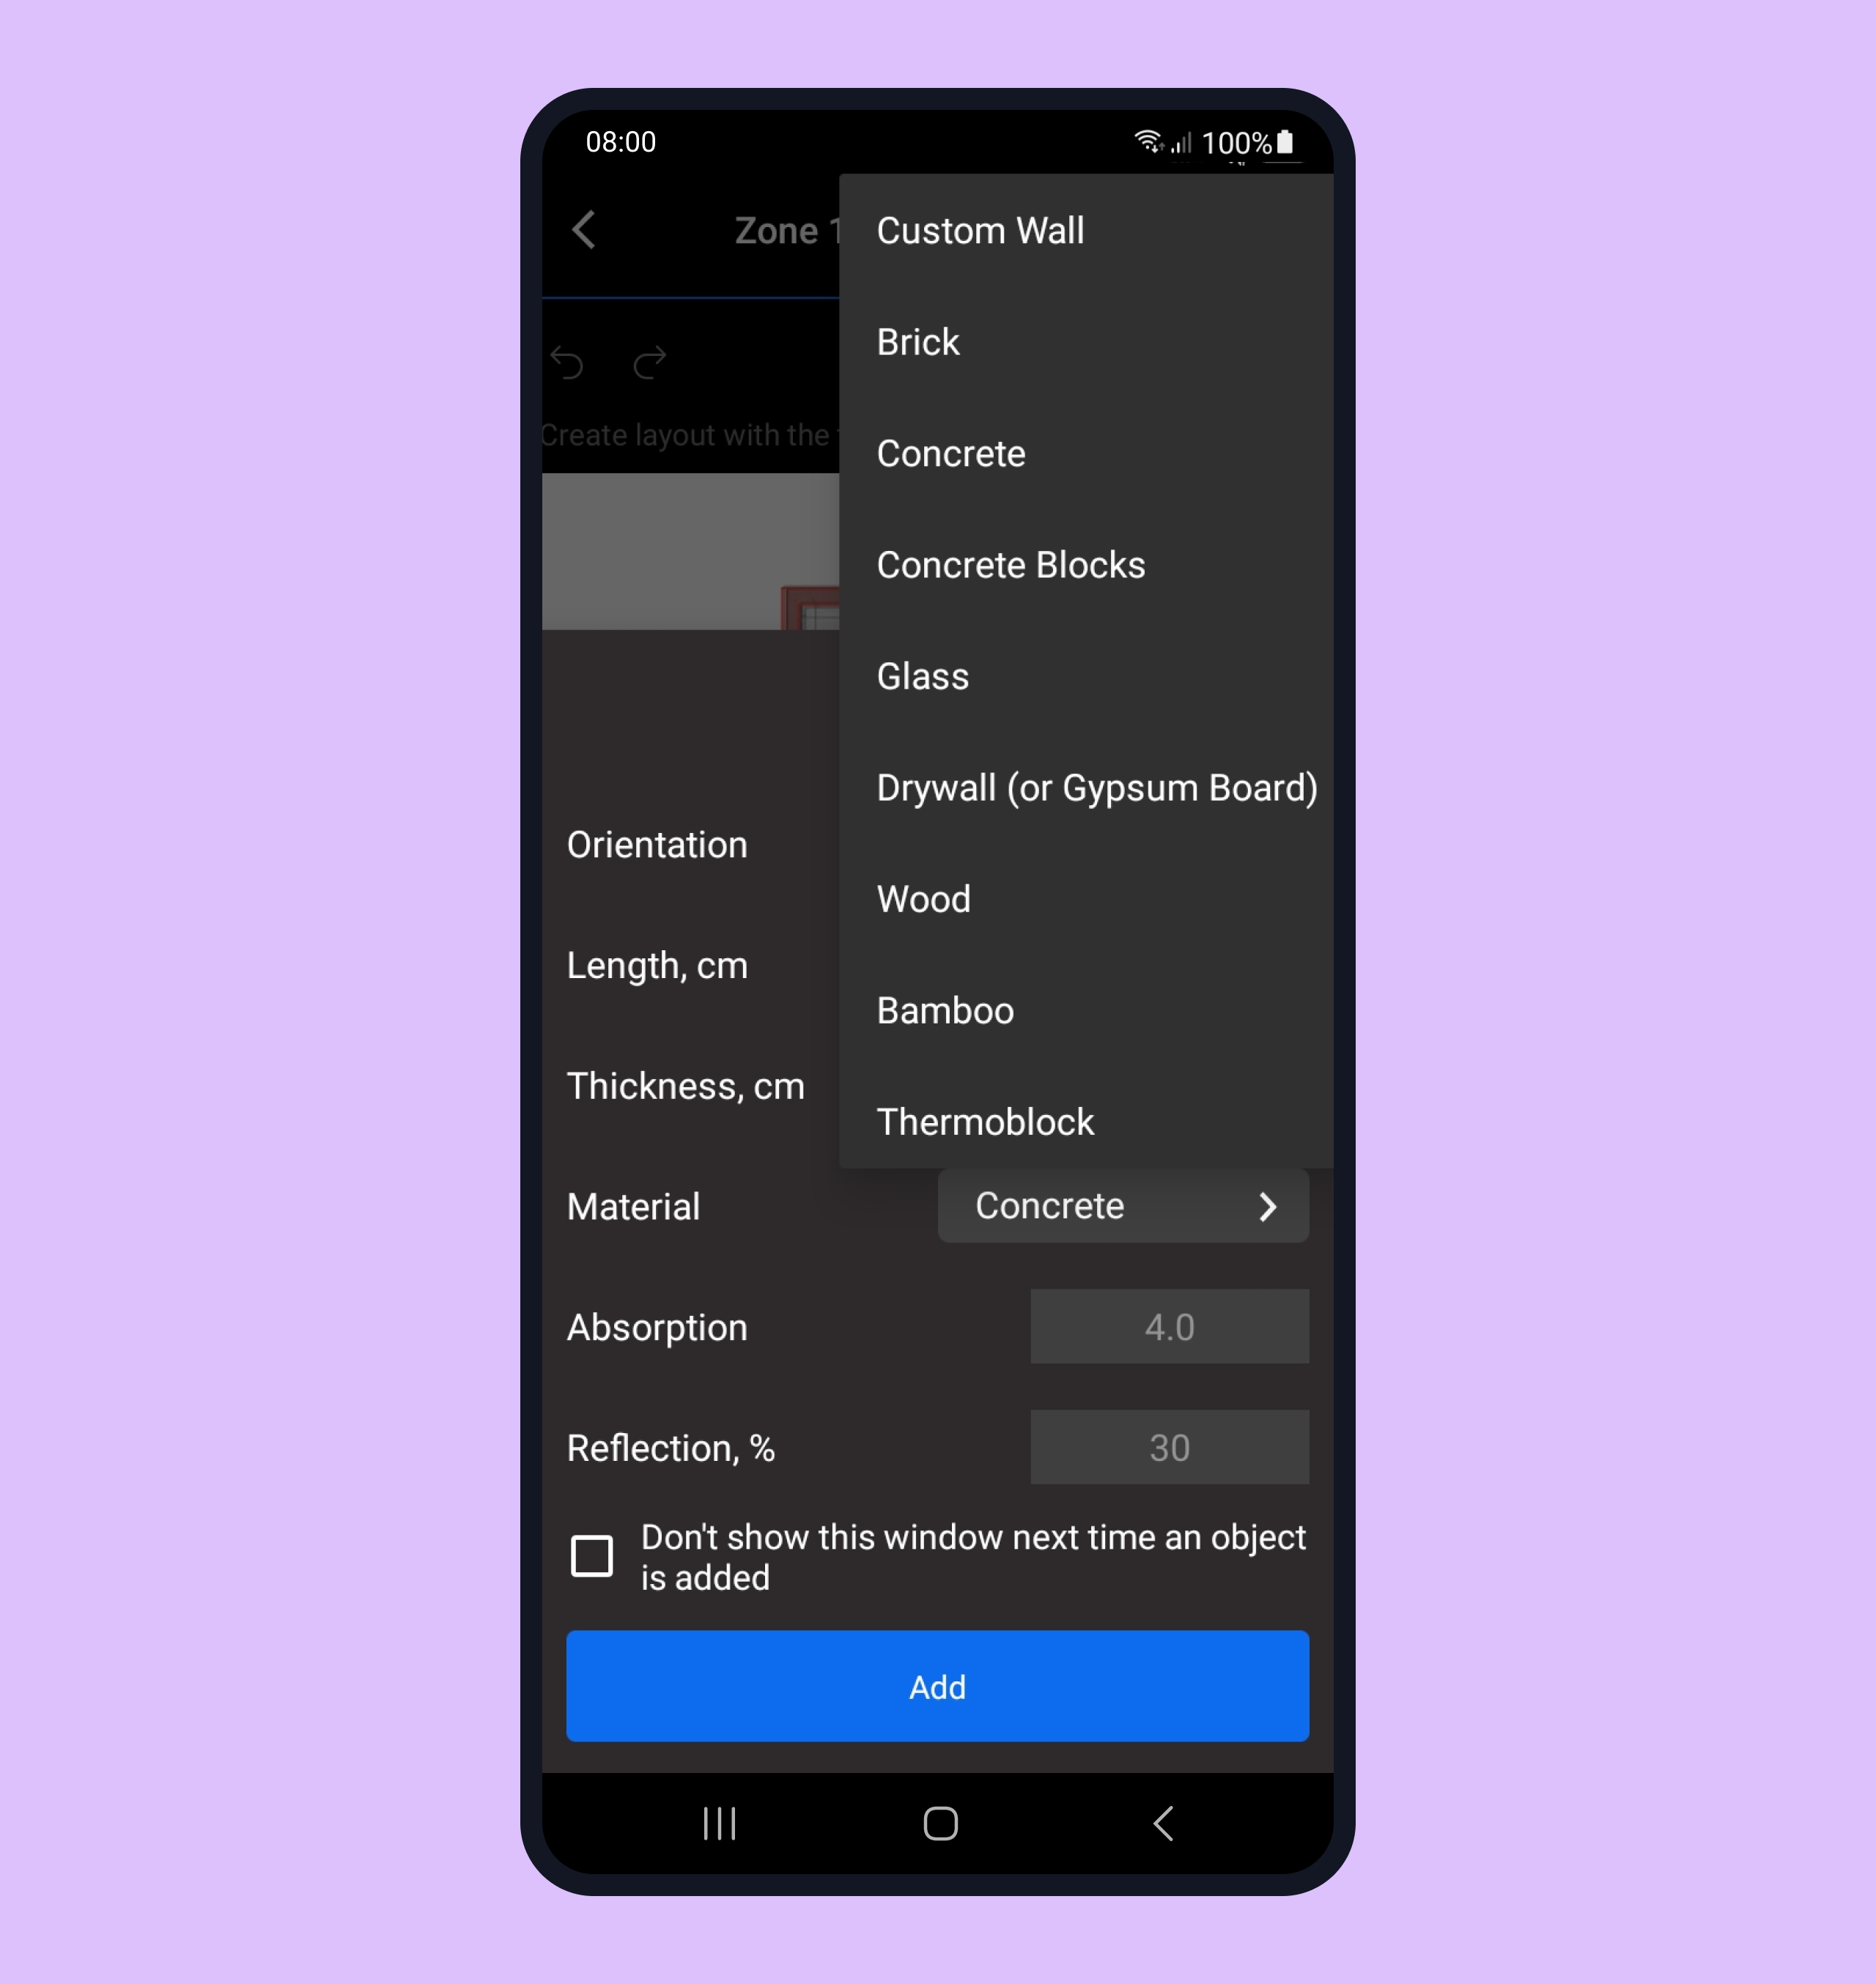
Step 7. Select the materials for each building element of your surveyed area. You can set your own custom material with specific reflection and absorption values. We have prepared a dedicated post on reflection and absorption, so please make sure to read it to choose the best values for your project.
NB: In order to change specifications of a certain element, select it and click Settings in the top toolbar. If you need to remove an element, select it and click the Trash icon in the top toolbar.
Step 8. After all building elements have been placed and their properties set, click Continue at the top right.
Step 9. Now it’s time to start placing the APs in the surveyed space. Add your first AP and select the AP brand and model. Specify AP’s desired settings.
Not finding certain APs in NetSpot? Just drop us a line with the desired AP brands and models, and we’ll add them promptly. If you know the desired AP specifications, you can simply create a custom AP.
Step 10. After you are done arranging the APs, click Done
Step 11. You will be taken to a project summary screen where you can view WiFi heatmaps or export project in order to view heatmaps in the desktop version of NetSpot PRO or Enterprise (more heatmaps available that way) or on another Android device if needed.
Step 12. When analyzing the generated heatmaps on Android device, the two handy and important things you can do are:
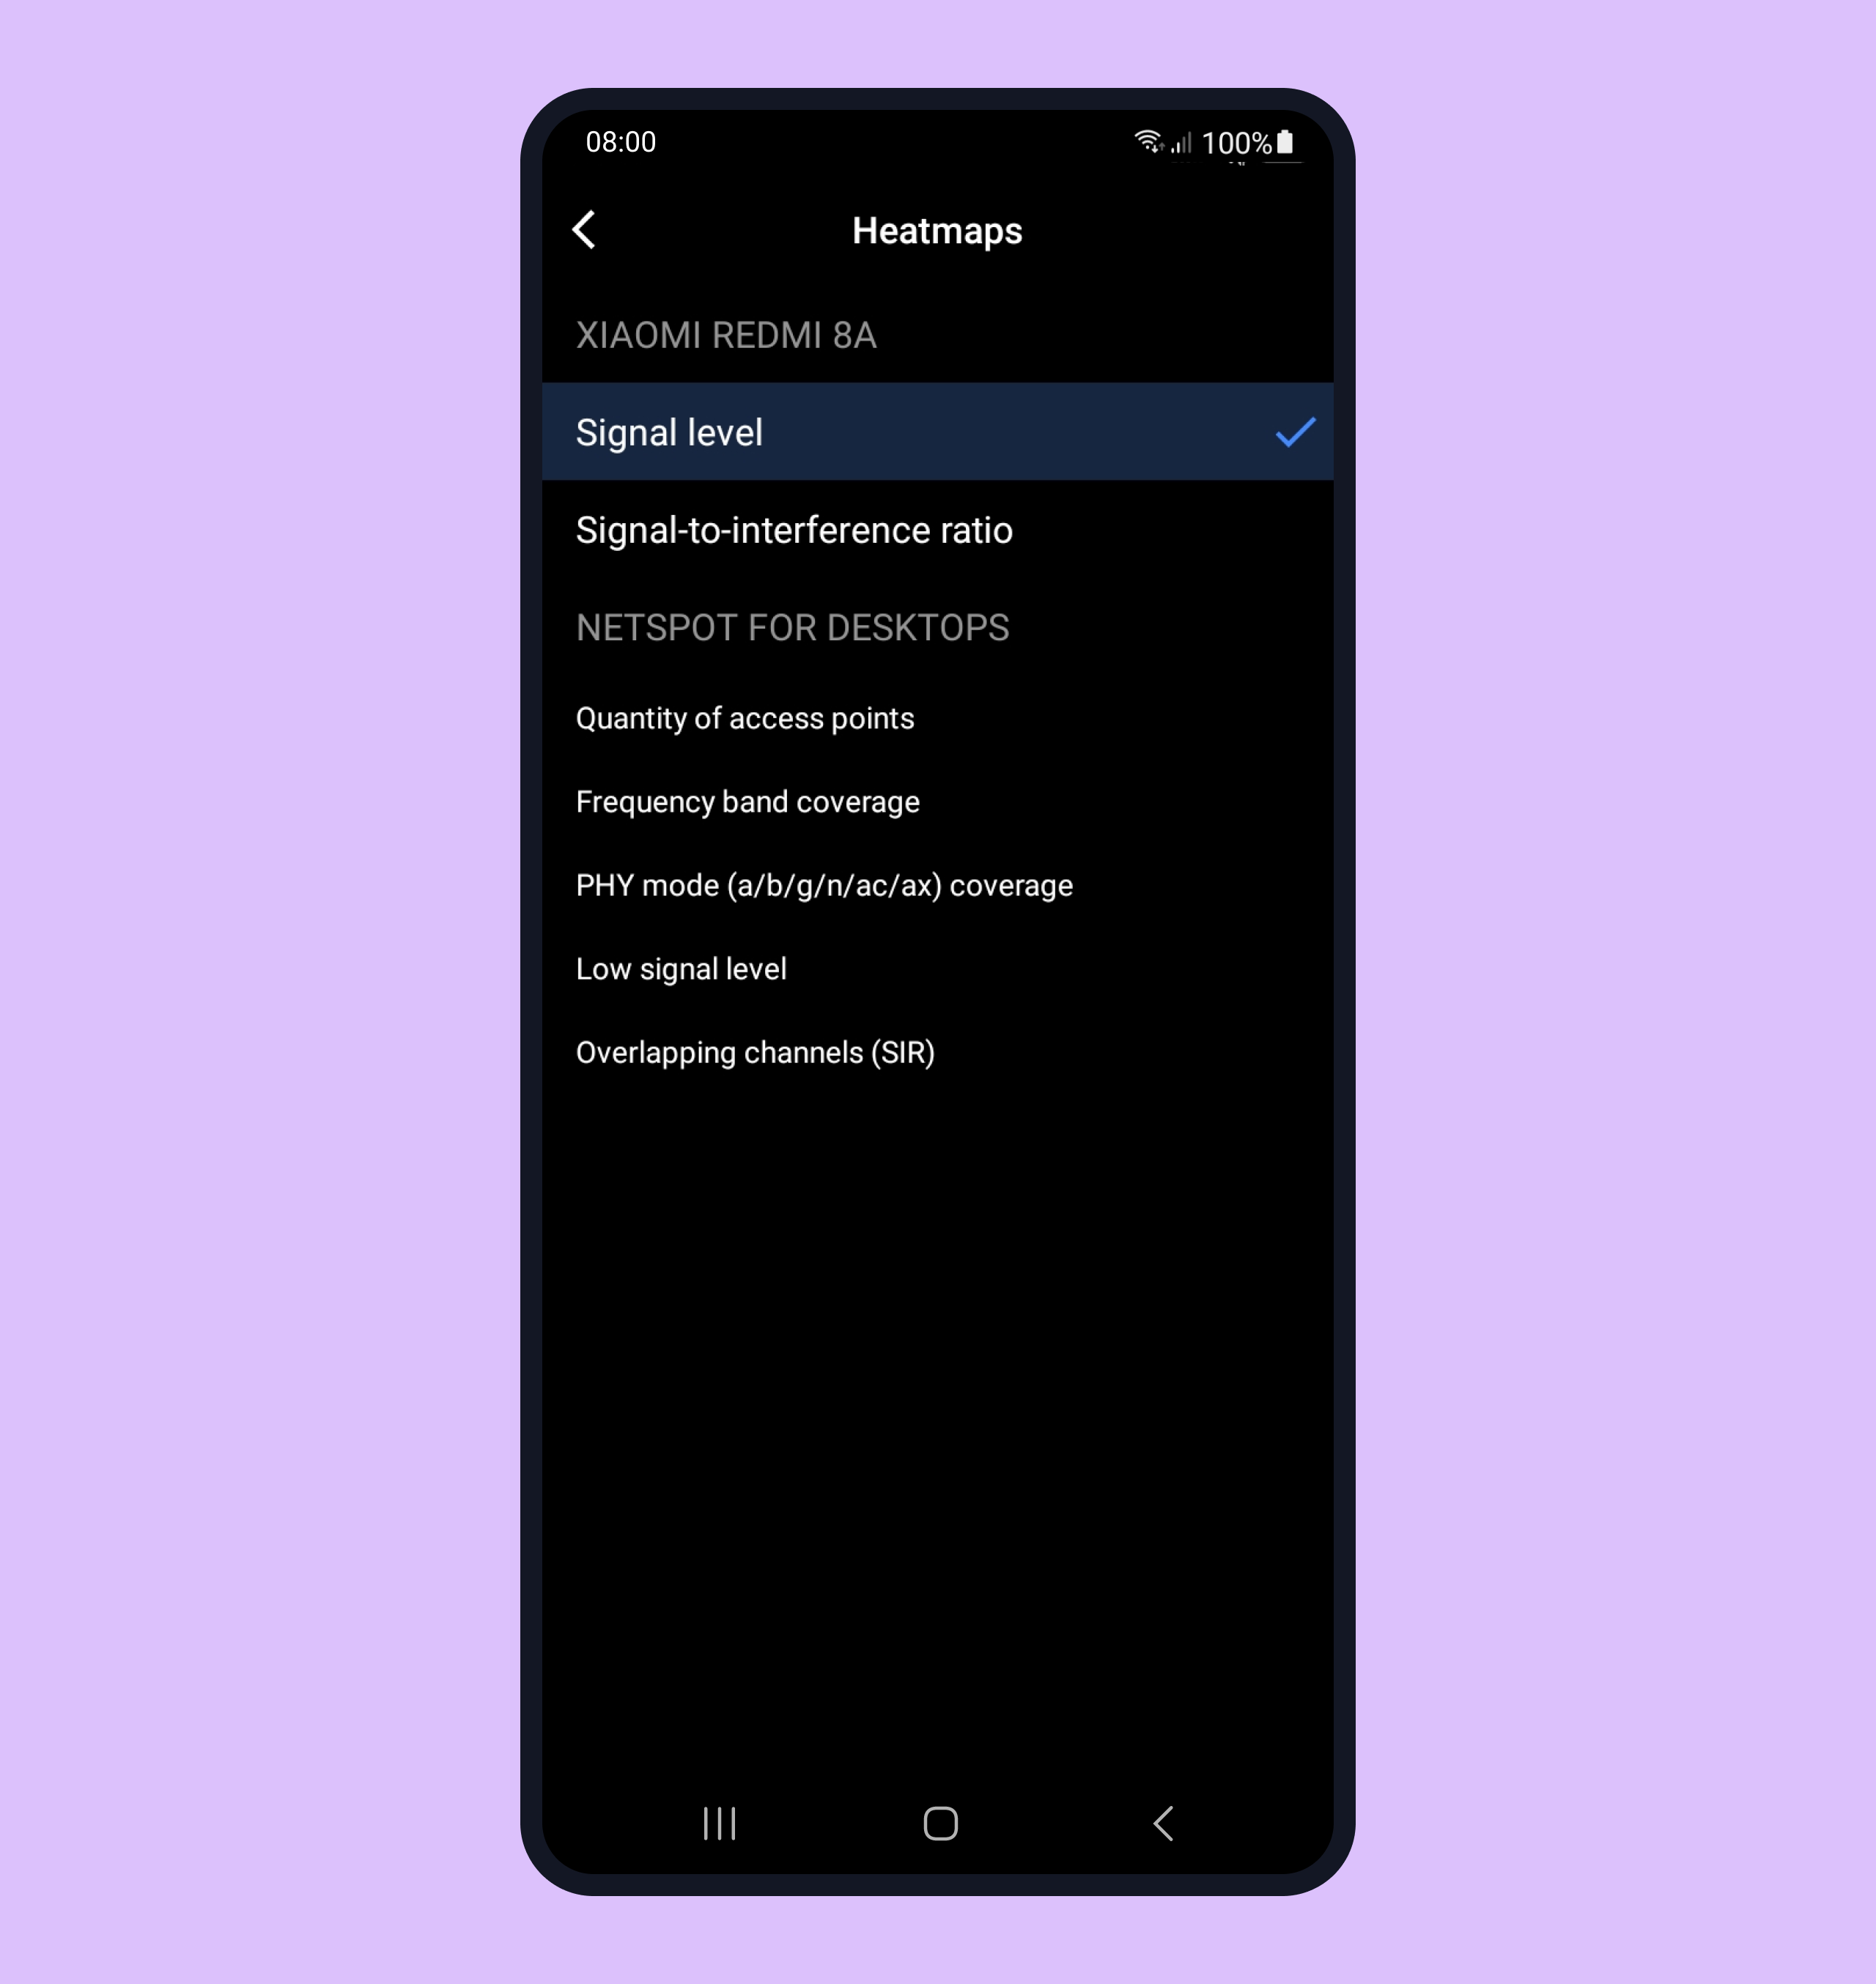
- Switch between two heatmap types to visually analyze different wireless coverage properties:
- Signal level
- Signal-to-interference ratio
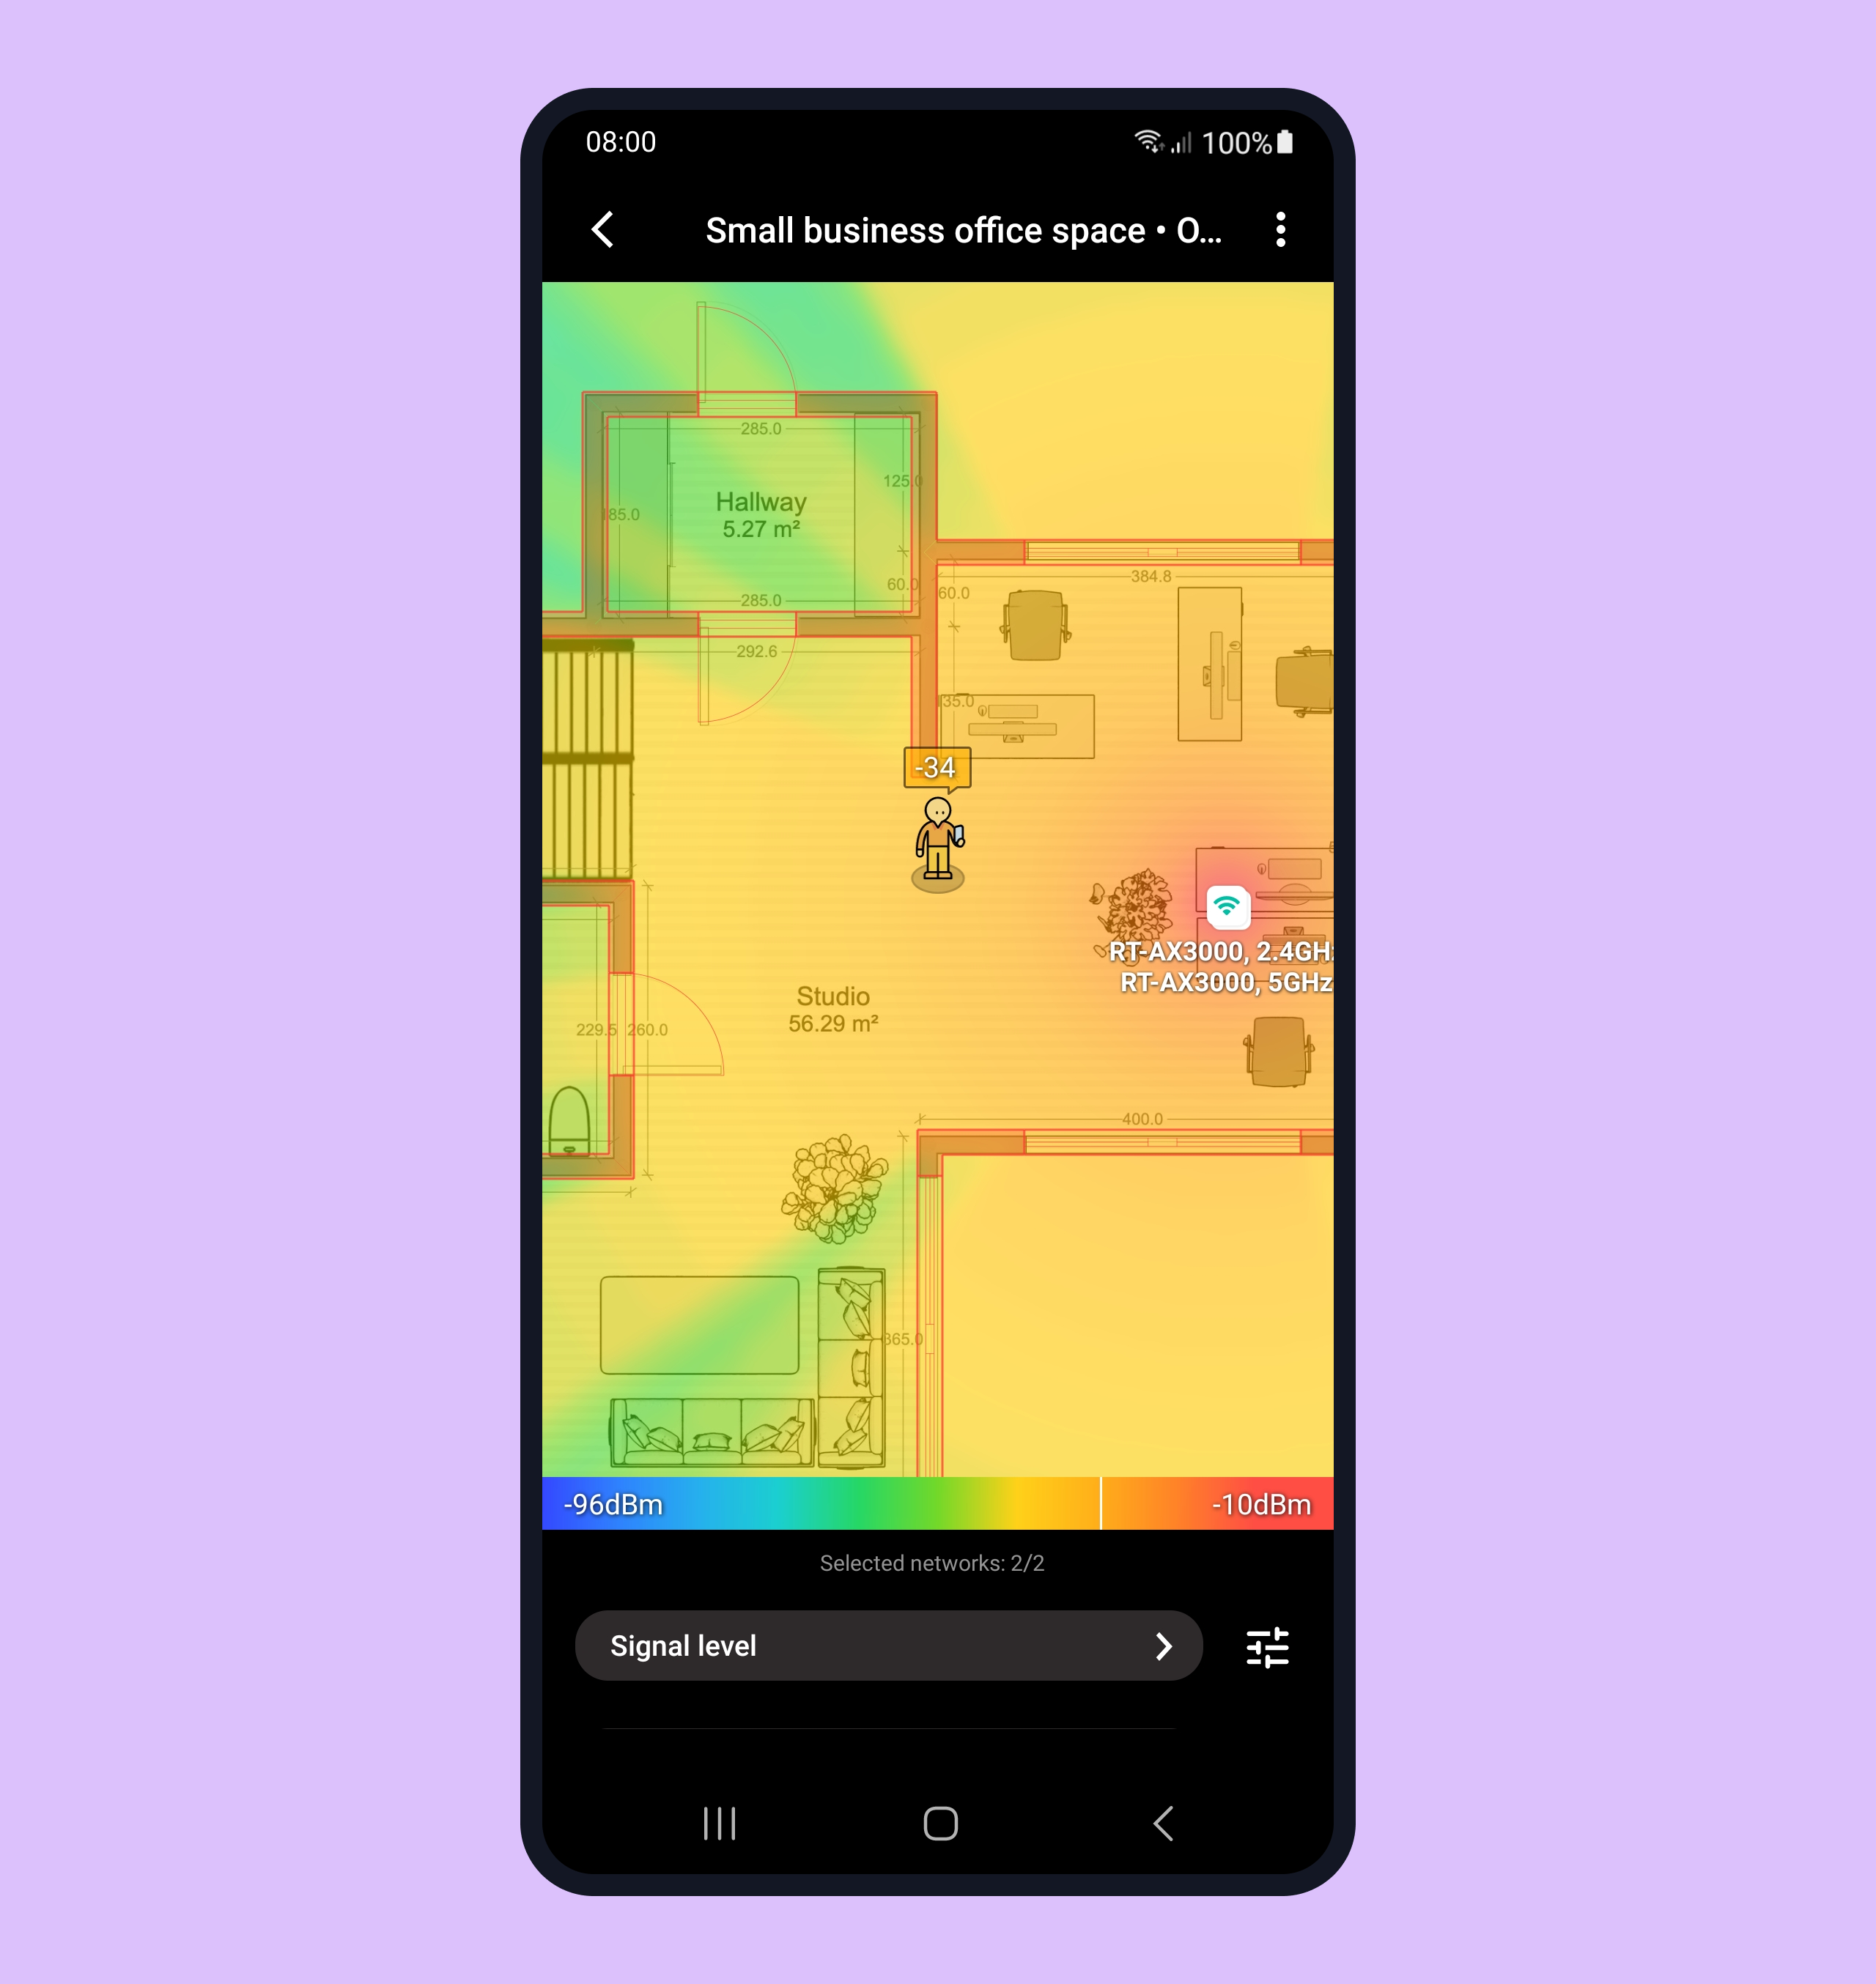
More WiFi heatmap types are available in NetSpot PRO or Enterprise
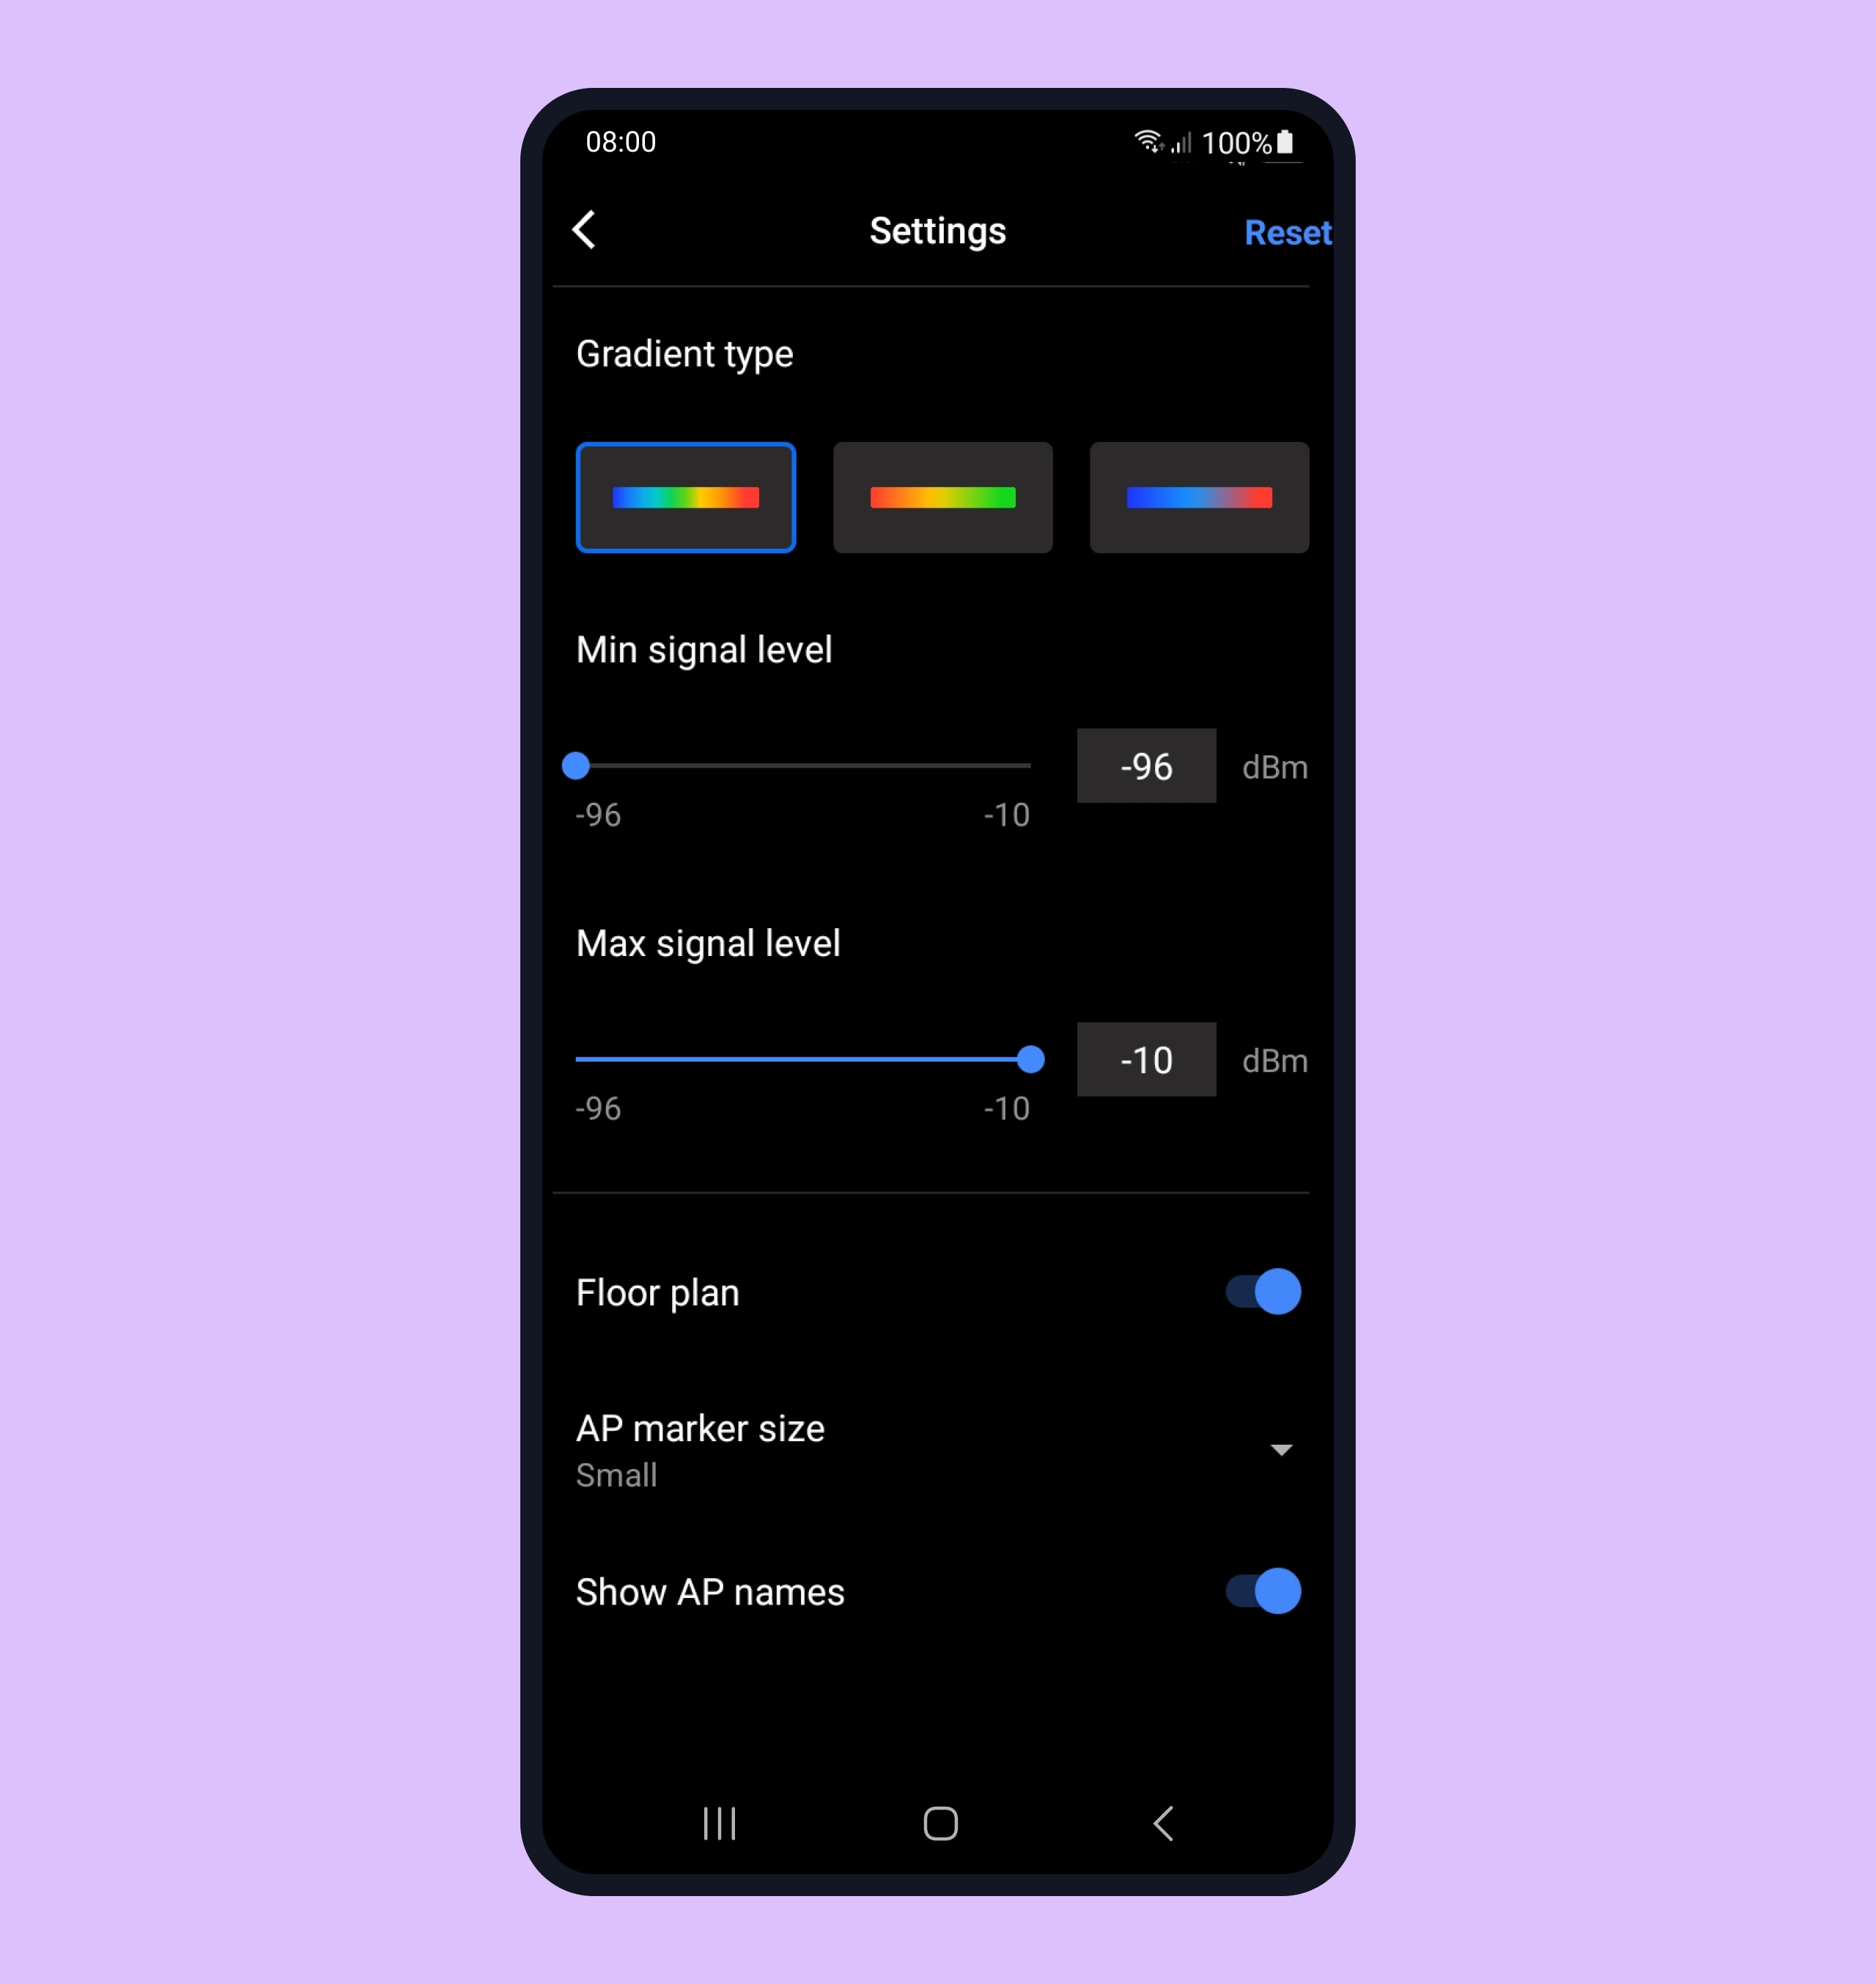
- Use the gradient menu at the lower right to change the color scheme of your heatmaps as well as define the minimum and maximum signal levels to be displayed in heatmaps.
FAQ:
Q: What devices does NetSpot support?
Any mobile device with Android 8.0 or later is supported.
Q: What area does NetSpot cover?
The covered area size usually depends on the device you are using. NetSpot can cover an area from 2 square meters (approximately 22 square feet) to 1000 square meters (around 10 thousand square feet).
Q: What’s the difference between this version and the desktop one?
NetSpot for Android allows scanning and analyzing surrounding WiFi networks to see if there are any issues and find the possible fixes for them. It also features the Survey Mode, where you can take all necessary measurements of your WiFi signal to then generate comprehensive heatmaps for visual analysis on your Android device or in the desktop version of NetSpot.
NetSpot for desktop offers an extended array of features. The following options are not available in the Android version yet:
- — Exporting survey results into CSV.
- — Exporting predictive heatmaps and enterprise-level reports.
Q: Why does NetSpot need my location?
To comply with current Google policies, the apps working with WiFi data have to request permissions to read the user’s/device’s location. You can read more about it here.
Q: Is my information safe?
We highly respect your privacy and never save your data or send it to any third parties.
Q: Does NetSpot for Android support Chrome OS?
Yes, Chromebook support has been added in the 1.1 version of NetSpot for Android. However, for the time being, the security type of a network (WPS, WEP, WPA, WPA2, WPA3) will not be shown on Chromebook.
Q: Will you ever release NetSpot for iPhone and iPad?
The great news is we already have NetSpot for iOS for you! It is not quite as powerful as its desktop sibling, but is a great supplemental addition to any WiFi coverage toolbox. At the moment, NetSpot for iOS features Survey mode, where you can generate heatmaps based on the download and upload speeds as well as Internet speed test.
We continue working on updates and improvements. Stay tuned!